Apexcharts.js: Feature request: explode pie/donut slice
I can see in the demos that clicking on a pie slice expands its radius, but I couldn't find anything in the docs about it.
Ideally, I would like to build a pie where any slice can be offset x pixels/percent from the centre point.
Less ideal, but perhaps easier: there is clearly already a function for expanding a slice's radius (on click), but it would be nice to be able to access it (so that it can be rendered with a slice in an expanded state, without having to click).
 andjules
All 13 comments
If I'm not wrong, are you proposing something like this?
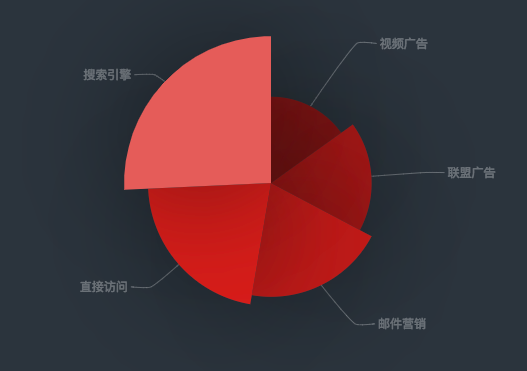
This is from echarts, and they give an option called roseType: radius which changes the radius of each pie depending on the value. Bigger the value, the bigger the radius. The smallest value becomes the 1st pie and the largest value becomes the last pie.
I just played with random values appended to each pie of the slice and got something like this

which is not far from what I see on echarts demo page.
In future, an option can be given in options.plotoptions.pie.roseType - which user can set to enable this.
 junedchhipa
on 4 Aug 2018
junedchhipa
on 4 Aug 2018
Actually, what I really want is the ability to do this:
However, your demo above is great.
I actually don't like the eCharts rose style (where radius is also based on slice value; I think it exaggerates data differences), but I like that by appending data in apexcharts, you could emphasize different slices (not dependent on their pie values).
andjules
on 4 Aug 2018
Ok, got your point.
So, I tried to provide a custom radius size to a particular slice, and it resulted in this

As you can see, it exaggerated the data in the last slice. The best solution is to just move the slice outwards (that is, what you call explode) - not expanding the radius.
I will see what I can do to move the slice oytwards / explode, sounds like a good idea, and many charts already implement it.
junedchhipa
on 4 Aug 2018
Thanks! It would be great if we had an option to move the slice (offset) from center.
In the meantime, how can I recreate the what you did above, with series-5? What option would I use?
Thanks again
andjules
on 4 Aug 2018
This is the branch which contains the custom-radius code
https://github.com/apexcharts/apexcharts.js/tree/pie-slices__custom-radius~~ DELETED
I have not merged it into master as I think, I need to find a better solution for exploding.
Thanks :)
junedchhipa
on 4 Aug 2018
Awesome, Thanks!
On Sat, Aug 4, 2018 at 1:50 PM, Juned Chhipa notifications@github.com
wrote:
This is the branch which contains the custom-radius code
https://github.com/apexcharts/apexcharts.js/tree/pie-slices__custom-radiusIn the samples, you will find example - /samples/pie/pie-with-custom-
slice-size.htmlI have not merged it into master as I think, I need to find a better
solution for exploding.
Thanks :)—
You are receiving this because you authored the thread.
Reply to this email directly, view it on GitHub
https://github.com/apexcharts/apexcharts.js/issues/16#issuecomment-410466373,
or mute the thread
https://github.com/notifications/unsubscribe-auth/AAirF9tp0DTL-QkUSHu5vFeuoqZ5cV2Uks5uNd7UgaJpZM4Vu_LN
.
andjules
on 4 Aug 2018
Hello, first of all, ApexCharts is an amazing chart lib with great documentation. Amazing Job.
I would like to know the situation for this Featured, it seems it wasn't implemented and this request was made a long time ago, I was looking for something like what you had manage to achieve here: https://github.com/apexcharts/apexcharts.js/issues/16#issuecomment-410450478 , I noticed that there was a branch with the implementation but it was deleted.
If this featured is not going to be implemented in a near future, how can I achieve that behavior? it seems that I only need to change the Radius of an individual Slice, but I can't find any doc related on how to access each series options nor create an individual option for a specific one.
I would like to have some guidance, I didn't create a new issue since this one exists, I would gladly transcribe this into an Issue format if that's the case.
 RicardoMoraisPOR
on 30 Mar 2020
RicardoMoraisPOR
on 30 Mar 2020
@RicardoMoraisPOR Do you want to explode a single slice at a time?
You can use toggleDataPointSelection method of ApexCharts.
If you want to do it on the initial load, it can be done this way
chart: {
  type: 'pie',
  events: {
    animationEnd: function(ctx) {
      ctx.toggleDataPointSelection(2)
    }
  }
}
@junedchhipa Not quite, quoting:
The best solution is to just move the slice outwards (that is, what you call explode) - not expanding the radius.
What I actually want is the Radius expansion in a pie/donut chart, that's why I said I would gladly transcribe this into an Issue format since what I was looking for is not quite what this issue refers to.
And yes, the toggleDataPointSelection works as expected for the explode functionality, what are my options for the expansion one?
RicardoMoraisPOR
on 31 Mar 2020
I think that the expansion should be based on values, not hardcoded.
So, a Polar Area Chart is best suited. I will add it to the roadmap.
junedchhipa
on 1 Apr 2020
Almost done with the Polar Area Charts

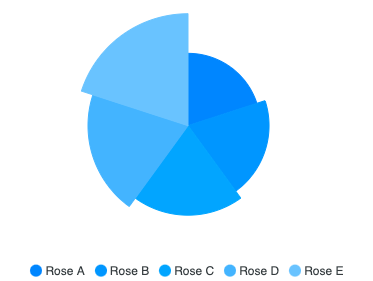
A minor version 3.18.0 will be released soon with these.
junedchhipa
on 1 Apr 2020
A minor version 3.18.0 will be released soon with these.
Yes! that's exactly what I was looking for! thank you for your time and work!
RicardoMoraisPOR
on 2 Apr 2020
Ok, got your point.
So, I tried to provide a custom radius size to a particular slice, and it resulted in this
As you can see, it exaggerated the data in the last slice. The best solution is to just move the slice outwards (that is, what you call explode) - not expanding the radius.
I will see what I can do to move the slice oytwards / explode, sounds like a good idea, and many charts already implement it.
@junedchhipa Hi ! thank you for a great library. I am trying to achieve the same like this but could not achieve.
here is the code that I have tried.
 events: {
                       animationEnd: function(ctx) {
                            ctx.toggleDataPointSelection(2)
                        },
              }
if I pass the value of parameter greater then 4 there would be a error . here is the screenshot .

 sandeshsapkota
on 10 Dec 2020
sandeshsapkota
on 10 Dec 2020
Related issues
 felixalguzman
·
3Comments
felixalguzman
·
3Comments
 tcarlsen
·
3Comments
tcarlsen
·
3Comments
 cstlaurent
·
3Comments
cstlaurent
·
3Comments
 jlil
·
3Comments
jlil
·
3Comments
 frlinw
·
3Comments
frlinw
·
3Comments