Apexcharts.js: Mixed Chart with both Column and Stacked Bar
Is there a way to have mixed charts with
- stacked bar
- column
- line
charts together.
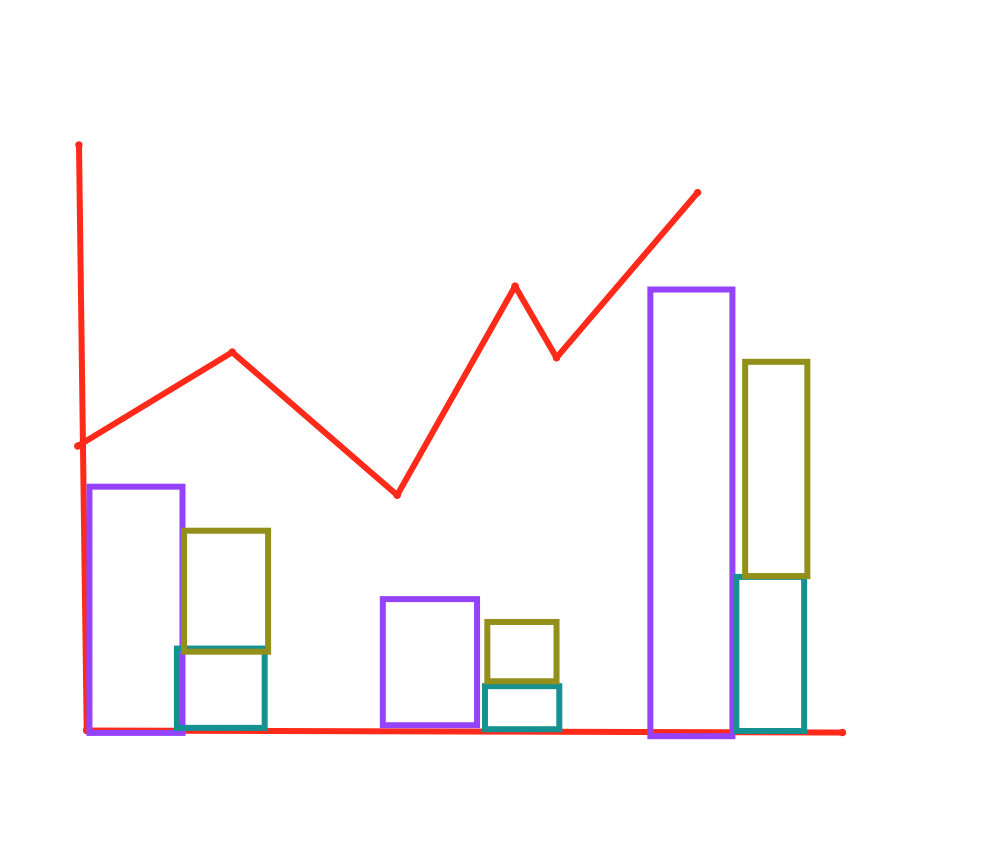
Is there a way to have column and stacked bar chart in the same graph with another line chart?
 thellimist
👍3
All 3 comments
Sorry, that's not achievable currently.
Grouped and Stacked column charts have been suggested before in this thread and may come in the future.
Related to #196, #26
 junedchhipa
on 22 Jan 2020
junedchhipa
on 22 Jan 2020
👍2
The way that another graphing library handles this is rather elegant.
For each series, you can pass in a stack id.
       <Bar dataKey="female" stackId="a" fill="#8884d8" />
       <Bar dataKey="male" stackId="a" fill="#82ca9d" />
       <Bar dataKey="uv" fill="#ffc658"/>
 JohnRomanski
on 3 Apr 2020
JohnRomanski
on 3 Apr 2020
+1 to this feature!
another library has this functionality, here's an example:
https://js.devexpress.com/Demos/WidgetsGallery/Demo/Charts/SideBySideStackedBar/React/Light/
 L1qu1d1c3
on 25 Jan 2021
L1qu1d1c3
on 25 Jan 2021
👍1
Was this page helpful?
0 / 5 - 0 ratings
Related issues
 ordago
·
3Comments
ordago
·
3Comments
 rudeayelo
·
3Comments
rudeayelo
·
3Comments
 frlinw
·
3Comments
frlinw
·
3Comments
 jeroenpol
·
3Comments
jeroenpol
·
3Comments
 piyushSinghalDemo
·
3Comments
piyushSinghalDemo
·
3Comments
Most helpful comment
Sorry, that's not achievable currently.
Grouped and Stacked column charts have been suggested before in this thread and may come in the future.
Related to #196, #26