Apexcharts.js: Poor handling for non-integer values on the y-axis
When making charts that have float/decimal values, the values always round. This makes it extremely annoying for plotting data under 1. Right now I have a workaround so that I can see the actual value on hover by setting the formatter like:
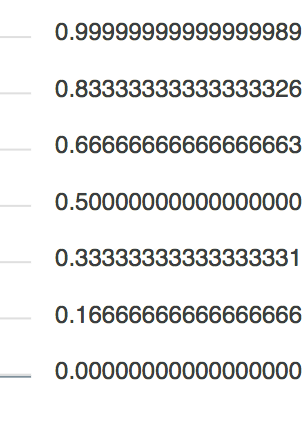
options.yaxis.labels.formatter = val => val.toFixed(2)
However there doesn't seem a way to get any non integer ticks to show up. Therefore if all data is between 0 and 1, you'll only be able to see two ticks: 0 and 1.
P.S. Thanks for the great library! A lot easier to use than chart.js for simple stuff.
 MichaelDanielTom
All 6 comments
@MichaelDanielTom
Removed the condition where smaller values were generating no ticks / single tick on y-axis.
Now, You can control the number of ticks that can be generated by this option
options.yaxis.tickAmount = 6
However, the way you have handled the float values by .toFixed(2) is required for now. I will check whether the series contains float numbers and based on that - decide whether to round off or not.
Thanks
 junedchhipa
on 2 Aug 2018
junedchhipa
on 2 Aug 2018
Thanks so much Juned!
MichaelDanielTom
on 2 Aug 2018
Fixed the decimal places also.
Now you don't need to provide options.yaxis.labels.formatter = val => val.toFixed(2) for handling small values
junedchhipa
on 2 Aug 2018
@junedchhipa Quick possible improvement could also be to default the representation for floats to truncate after a reasonable amount. Thoughts?
MichaelDanielTom
on 3 Aug 2018
Not a bad idea to avoid long fraction parts.
And what should be the name of this option? options.yaxis.decimalsInFloat sounds good? :)
junedchhipa
on 3 Aug 2018
Updated the "fraction/decimal" part to allow the user to give a default value.
Currently, the default is set to 2 - https://github.com/apexcharts/apexcharts.js/commit/b37f2490f28bd1d41f95ec14c4b6bfafb91a76a4
The option can be set at options.yaxis.decimalsInFloat
Need to add in the docs
junedchhipa
on 3 Aug 2018
Related issues
 astone2014
·
15Comments
astone2014
·
15Comments
 Bilge
·
15Comments
Bilge
·
15Comments
 benhaynes
·
19Comments
benhaynes
·
19Comments
 GalacticSun
·
29Comments
GalacticSun
·
29Comments
 jsinhSolanki
·
23Comments
jsinhSolanki
·
23Comments
Most helpful comment
Updated the "fraction/decimal" part to allow the user to give a default value.
Currently, the default is set to 2 - https://github.com/apexcharts/apexcharts.js/commit/b37f2490f28bd1d41f95ec14c4b6bfafb91a76a4
The option can be set at
options.yaxis.decimalsInFloatNeed to add in the docs