Altair: Specifying Images as labels along Y-axis
Hi,
Is there a way to specify images as labels along Y-axis in Altair as shown in the image?
(Image Source: https://in.pcmag.com/news/132040/countries-that-spend-the-most-time-on-social-media-face-the-most-consequences)

question
 gowrishankarnath
All 2 comments
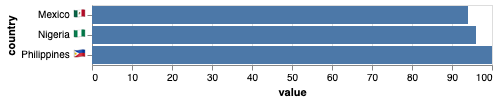
There are two ways to do something like this. Images can be included in the labels if the images can be expressed as unicode emojis; here is an example:
import altair as alt
import pandas as pd

df = pd.DataFrame({
    "country": ["Philippines 🇵🇭", "Nigeria 🇳🇬", "Mexico 🇲🇽"],
    "value": [100, 96, 94]
})

alt.Chart(df).mark_bar().encode(
    y='country:N',
    x='value:Q'
)
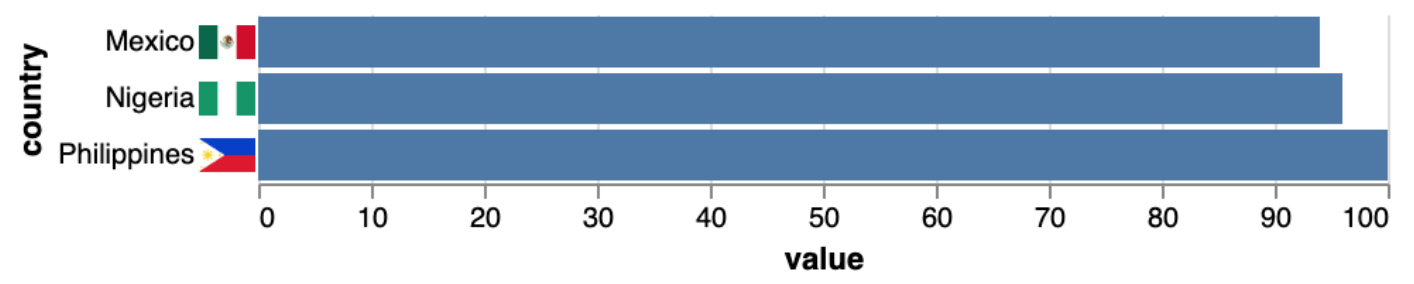
If the images you want to use are available by URL, you can use an image mark along with concatenation to achieve roughly the same effect:
df = pd.DataFrame({
    "country": ["Philippines", "Nigeria", "Mexico"],
    "value": [100, 96, 94]
})

df['flag_image'] = [
    f"https://www.countries-ofthe-world.com/flags-normal/flag-of-{country}.png"
    for country in df['country']
]

flags = alt.Chart(df).mark_image().encode(
    y=alt.Y('country', axis=alt.Axis(domainOpacity=0, ticks=False)),
    url="flag_image"
)

chart = alt.Chart(df).mark_bar().encode(
    y=alt.Y('country', axis=None),
    x='value'
)

alt.concat(
    flags, chart
).configure_concat(
    spacing=0
).configure_view(
    strokeOpacity=0
)
 jakevdp
on 6 Feb 2020
jakevdp
on 6 Feb 2020
👍2
Awesome. Thank you very much, Jake.
gowrishankarnath
on 7 Feb 2020
Was this page helpful?
0 / 5 - 0 ratings
Related issues
 mroswell
·
54Comments
mroswell
·
21Comments
mroswell
·
54Comments
mroswell
·
21Comments
 hugo-pires
·
19Comments
jakevdp
·
36Comments
hugo-pires
·
19Comments
jakevdp
·
36Comments
 noklam
·
20Comments
noklam
·
20Comments
Most helpful comment
There are two ways to do something like this. Images can be included in the labels if the images can be expressed as unicode emojis; here is an example:
If the images you want to use are available by URL, you can use an image mark along with concatenation to achieve roughly the same effect: