Altair: Adjust marker width in heat map (mark_rect) ?
Hi,
is it possible to adjust the width of the rectangles in a mark_rect() heat map, so that they are not square anymore?
This would be useful for cases where there are many more values on the x axis than on the y axis (as in a phenotypic profile (my use case)).
Many thanks in advance for your help.
Kind regards,
Axel
 apahl
apahl
All 4 comments
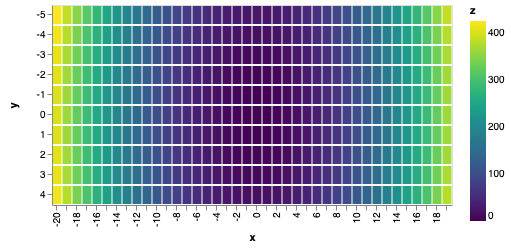
The easiest way to do this is to explicitly set the width and height of the chart; e.g.
import altair as alt
import numpy as np
import pandas as pd

# Compute x^2 + y^2 across a 2D grid
x, y = np.meshgrid(range(-20, 20), range(-5, 5))
z = x ** 2 + y ** 2

# Convert this grid to columnar data expected by Altair
source = pd.DataFrame({'x': x.ravel(),
                     'y': y.ravel(),
                     'z': z.ravel()})

alt.Chart(source).mark_rect().encode(
    x='x:O',
    y='y:O',
    color='z:Q'
).properties(
    width=400,
    height=200
)
 jakevdp
on 8 Mar 2019
jakevdp
on 8 Mar 2019
Cool, that totally works!
Thanks a lot for the quick and illustrative answer!
Awesome project.
Kind regards,
Axel
apahl
on 8 Mar 2019
Well, my question is regarding setting the size (width and height) of each of the cells in mark_rect(). How can we do that such that the size is fixed, and the overall heatmap just gets bigger if we have more boxes to show?
 ilyasustun
on 19 Jul 2019
ilyasustun
on 19 Jul 2019
(For future searches, this last question is answered here: https://github.com/altair-viz/altair/issues/1618#issuecomment-513424086)
jakevdp
on 20 Jul 2019
Related issues
 HalukaMB
·
31Comments
HalukaMB
·
31Comments
 pagpires
·
21Comments
jakevdp
·
24Comments
pagpires
·
21Comments
jakevdp
·
24Comments
 wmayner
·
22Comments
jakevdp
·
34Comments
wmayner
·
22Comments
jakevdp
·
34Comments
Most helpful comment
Cool, that totally works!
Thanks a lot for the quick and illustrative answer!
Awesome project.
Kind regards,
Axel