Altair: Adding text to stacked bar charts
Hi,
I was wondering how we can add text to stacked bar charts that have differing lengths. I've found this image online but it only has html code for vega-lite. Is there a way to implement this in Altair?

 tzbaris
All 16 comments
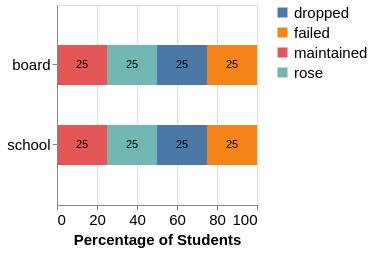
@tzbaris If the issue is how to get the text marks positioned on their respective segments, I usually write a python function to calculate the midpoints of each segment. Then, I add a column to my DataFrame to use as the position of the text mark (so the X position in this case). You can change the align property of the text mark to shift the marks to the right or left.
df=pd.DataFrame({'Org': ['school','school','school','school', 'board', 'board', 'board', 'board'],
'variable': ['rose', 'dropped', 'maintained', 'failed','rose', 'dropped', 'maintained', 'failed'],
'percent': [25,25,25,25,25,25,25,25],
'position': [12.5, 37.5,62.5, 87.5,12.5, 37.5,62.5, 87.5]})
bars=alt.Chart().mark_bar().encode(
x=alt.X('sum(percent)', title='Percentage of Students'),
y=alt.Y('Org', title=None),
color=alt.Color('variable', title=None)
)
text=alt.Chart().mark_text(align='center', baseline='middle').encode(
y=alt.Y('Org', title=None),
x='position',
text='percent')
alt.layer(bars, text, data=df)
 Alcampopiano
on 27 Sep 2018
Alcampopiano
on 27 Sep 2018
@Alcampopiano
Thanks for your reply. I guess what I'm struggling with is that I have different lengths of bars, so a universal 'position' won't exist. How would I specify the position of the text for each bar differently?
tzbaris
on 27 Sep 2018
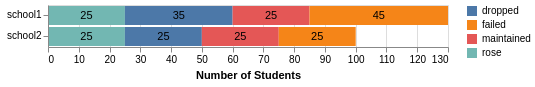
Perhaps I don't understand your question but in my example the position is explicitly set for each bar segment. This is why it does not matter if the segments or full bars have different lengths. Here is another example where segments and bars are different lengths.
df=pd.DataFrame({'Org': ['school1','school1','school1','school1', 'school2', 'school2', 'school2', 'school2'],
'variable': ['rose', 'dropped', 'maintained', 'failed','rose', 'dropped', 'maintained', 'failed'],
'numbers': [25,35,25,45,25,25,25,25],
'position': [12.5, 42.5, 72.5, 107.5, 12.5, 37.5,62.5, 87.5]})
bars=alt.Chart().mark_bar().encode(
x=alt.X('sum(numbers)', title='Number of Students'),
y=alt.Y('Org', title=None),
color=alt.Color('variable', title=None),
)
text=alt.Chart().mark_text(align='center', baseline='middle').encode(
y=alt.Y('Org', title=None),
x='position',
text='numbers')
alt.layer(bars, text, data=df)
Alcampopiano
on 27 Sep 2018
@Alcampopiano
Oh I see now, my mistake! Would you be able to share the code you used to calculate the midpoints by any chance? Thank you!
tzbaris
on 27 Sep 2018
Something like this for every bar.
def calc_midpoints(y):
x=[]
for i in range(len(y)):
trailing_quant=y[:i]
x.append(y[i]/2 + sum(trailing_quant))
return x
y=[25,35,25,45]
x=calc_midpoints(y)
print(x)
[12.5, 42.5, 72.5, 107.5]
@Alcampopiano
Great, thank you so much for your help. I've now got it all working!
tzbaris
on 27 Sep 2018
@tzbaris Cool, my pleasure. Feel free to close the issue.
Alcampopiano
on 27 Sep 2018
@tzbaris If you can share the vega-lite code for the original plot, I can translate it to the altair code for you.
 jakevdp
on 27 Sep 2018
jakevdp
on 27 Sep 2018
@jakevdp
I've pasted the code below but I got it from this site: https://bl.ocks.org/pratapvardhan/00800a4981d43a84efdba0c4cf8ee2e1
{
"$schema": "https://vega.github.io/schema/vega-lite/v2.json",
"data": {"url": "https://vega.github.io/editor/data/barley.json"},
"width": 500, "height": 250,
"resolve": {"scale": {"color": "independent"}},
"layer": [
{"mark": "bar",
"encoding": {
"x": {"aggregate": "sum", "field": "yield", "type": "quantitative", "stack": "zero"},
"y": {"field": "variety", "type": "nominal"},
"color": {"field": "site", "type": "nominal"}}
},
{"mark": {"type": "text", "dx": -15, "dy": 3},
"encoding": {
"x": {"aggregate": "sum", "field": "yield", "type": "quantitative", "stack": "zero"},
"y": {"field": "variety", "type": "nominal"},
"color": {"field": "site", "type": "nominal", "scale": {"range": ["white"]}, "legend": null},
"text": {"aggregate": "sum", "field": "yield", "type": "quantitative", "format": ".1f"}}
}
]
}
tzbaris
on 27 Sep 2018
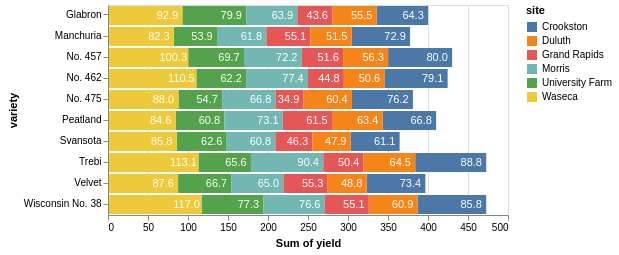
@tzbaris @jakevdp
To save Jake the time, and yes this is a much better way to do it. Lots to learn from here. It appears that I may never need to manage positions of text marks manually. Amazing.
import altair as alt
import pandas as pd
from vega_datasets import data

df=data.barley()

bars=alt.Chart().mark_bar().encode(
    x=alt.X('sum(yield)',stack='zero'),
    y=alt.Y('variety'),
    color=alt.Color('site')
)

text=alt.Chart().mark_text(dx=-15, dy=3).encode(
    y=alt.Y('variety'),
    x=alt.X('sum(yield)',  stack='zero'),
    color=alt.Color('site', legend=None, scale=alt.Scale(range=['white'])),
    text=alt.Text('sum(yield)',format='.1f')
)

alt.layer(bars, text, data=df).resolve_scale(color='independent')
Alcampopiano
on 27 Sep 2018
Thanks @Alcampopiano!
jakevdp
on 27 Sep 2018
Does this also apply for layered, faceted stacked barplots ?
stacked_bar = alt.Chart().mark_bar().encode(
    alt.X('Strand:N'),
    alt.Y('percent:Q'),
    color=alt.Color('rntp:N')
)

text=alt.Chart().mark_text(
        align='center',
        baseline='middle',
    ).encode(
        y = alt.Y('percent'),
        x = alt.X('Strand:N'),
        text=alt.Text('percent:Q',format='.1f')
)

alt.layer(stacked_bar, text, data=data).facet(
    column='organ:N',
    row='age:N'
)
produces
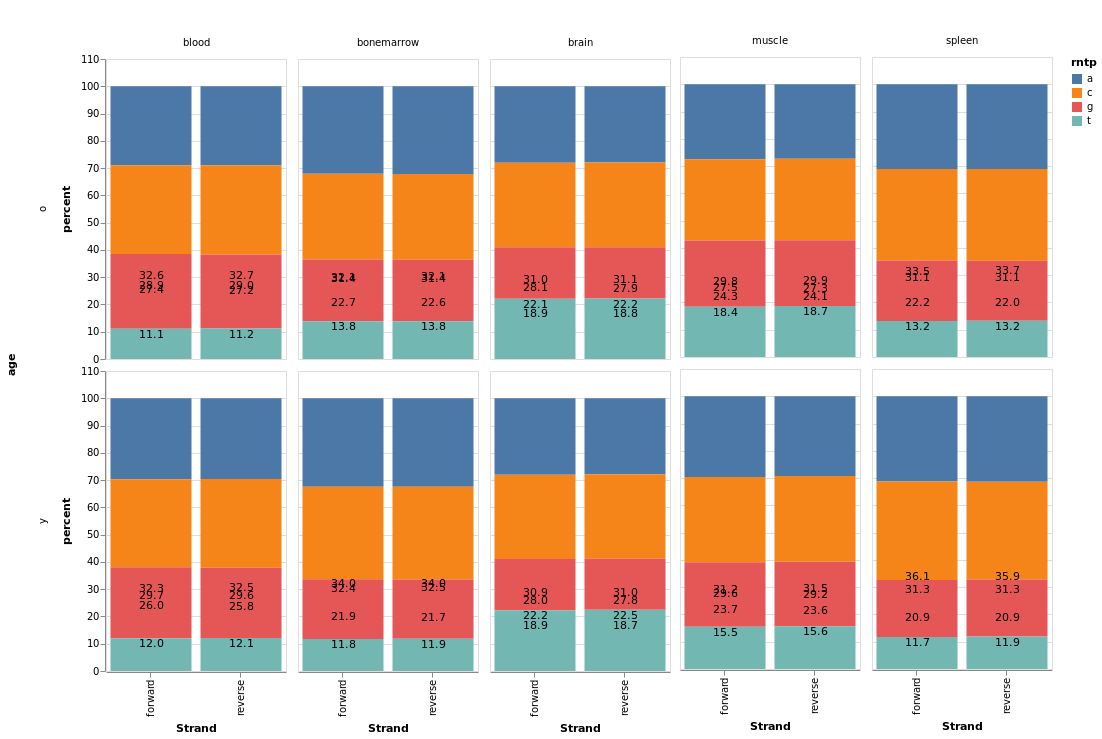
I cannot quite seem to get it to place the labels in the correct position. Adjusting the dx and dy just moves the whole group of numbers. Is the takehome from above that I need to calculate the midpoints ?
 dejmail
on 13 Mar 2019
dejmail
on 13 Mar 2019
The issue is that your bars are stacked (so the top of bar a is at position y = a + c + g + t), while your text is not stacked, so the text for a is at position y = a.
Unfortunately, in the current version of Altair there's no easy way to stack the text encoding, aside from computing the stacked values as part of the input data. In Altair 3.0, you'll be able to do this within the chart spec using a Stack Transform (here's the vega-lite docs for this transform: https://vega.github.io/vega-lite/docs/stack.html#transform).
We will work on releasing Altair 3.0 once Vega-Lite 3.0 is released.
jakevdp
on 13 Mar 2019
Live example is here: https://altair-viz.github.io/gallery/stacked_bar_chart_with_text.html
jakevdp
on 25 Jun 2019
@Alcampopiano @jakevdp this works well when the stack is zero, but fails when the stack is normalize, the text starts gettng in other areas. Since dx is kind of an absolute value, playing around with it doesn't help because if it works for one of the bars, then it will fail for another one. Is there a way to do this for normalize bars or do I have to calculate the midpoints and add them as data points?
As you can see, when the stack is zero, it works -

Fails when the stack is normalize -

 armsp
on 22 Jul 2020
armsp
on 22 Jul 2020
@jakevdp @Alcampopiano any luck with the above?
armsp
on 23 Jul 2020
Related issues
 mroswell
·
4Comments
mroswell
·
4Comments
 pabloinsente
·
3Comments
pabloinsente
·
3Comments
 morberg
·
3Comments
morberg
·
3Comments
 LukeMathWalker
·
3Comments
LukeMathWalker
·
3Comments
 breadbaron
·
4Comments
breadbaron
·
4Comments
Most helpful comment
@tzbaris @jakevdp
To save Jake the time, and yes this is a much better way to do it. Lots to learn from here. It appears that I may never need to manage positions of text marks manually. Amazing.