Altair: Bar graph width overlapping with size parameter
I am trying to increase the width of the bar chart because the default one is too thin for my purposes. I passed size=25 but as you can see, it causes overlapping. Not really sure how to fix it without making the chart a giant mess.
bar_graph = alt.Chart(data).mark_bar(size=25).encode(
    x='is_missing:N',
    y='sum(count)',
    color=alt.Color('prim_code', sort=alt.SortField(op='sum', field='count'), legend=None)
)
bar_graph.encoding.x.title='Category'
bar_graph.encoding.y.title='Records'

bar_graph

 f0lie
f0lie
All 9 comments
You are adjusting the width of the bar marks, which does not affect the scale used to map x-axis data to x-axis locations. There are two ways you can adjust this:
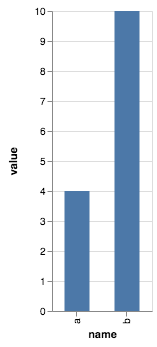
1) adjust the overall chart size explicitly:
data = pd.DataFrame({'name': ['a', 'b'], 'value': [4, 10]})

alt.Chart(data).mark_bar(size=25).encode(
    x='name:N',
    y='value:Q'
).properties(
    width=100
)
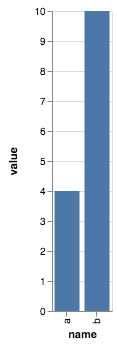
2) Adjust the size of the rangeStep in the x-axis scale:
data = pd.DataFrame({'name': ['a', 'b'], 'value': [4, 10]})

alt.Chart(data).mark_bar(size=25).encode(
    alt.X('name:N', scale=alt.Scale(rangeStep=30)),
    y='value:Q'
)
 jakevdp
on 27 Jul 2018
jakevdp
on 27 Jul 2018
There's not much on this in the Altair docs, but here is the relevant part of the Vega-Lite docs: https://vega.github.io/vega-lite/docs/size.html
jakevdp
on 27 Jul 2018
There been several times I referenced the vega docs for Altair purposes. I think it would be worth while to explain what Altair does under the hood.
For example, you could have simple code examples in Altair and their Vega json output. I think it would help people to understand what Altair and Vega is for. It shouldn't be in the starting guide but maybe the advanced section called "Under the Hood".
f0lie
on 27 Jul 2018
Sure... all that Altair does is provide a wrapper around Vega-Lite, and you can use chart.to_dict() to export the vega-lite spec.
Everything else is outside Altair.
jakevdp
on 27 Jul 2018
I agree it would be useful to have that in the docs... any volunteers? 😀
jakevdp
on 27 Jul 2018
I can do it, since I am the one that suggested it. lol
I'll take the simple examples that exist, paste the Vega json and example what happened. I'll sprinkle in my own examples like using alt.Y() to add titles since they are basically nested Json statements.
f0lie
on 27 Jul 2018
Sadly, the example:
data = pd.DataFrame({'name': ['a', 'b'], 'value': [4, 10]})

alt.Chart(data).mark_bar(size=25).encode(
    alt.X('name:N', scale=alt.Scale(rangeStep=30)),
    y='value:Q'
)
SchemaValidationError: Invalid specification
    altair.vegalite.v4.schema.core.Scale, validating 'additionalProperties'

    Additional properties are not allowed ('rangeStep' was unexpected)
no longer works.
Could you please share how we can do this with new version of Altair?
 tonysepia
on 4 Jan 2021
tonysepia
on 4 Jan 2021
Use width={'step': 30}; see https://altair-viz.github.io/releases/changes.html#grammar-changes
jakevdp
on 5 Jan 2021
Thank you, @jakevdp
tonysepia
on 5 Jan 2021
Related issues
 Hisham-Hussein
·
29Comments
Hisham-Hussein
·
29Comments
 mroswell
·
21Comments
jakevdp
·
36Comments
jakevdp
·
34Comments
jakevdp
·
17Comments
mroswell
·
21Comments
jakevdp
·
36Comments
jakevdp
·
34Comments
jakevdp
·
17Comments