Altair: Set axis range and absolute chart width
Hi,
can please someone tell me how to limit the range of y-axis to [50, 100] for example?
Also is there option to set chart absolute dimensions in pixels?
Thanks
 klonuo
All 10 comments
Hi,
These things are not all that well documented in Altair itself at the moment (we're working on that), but you can find info by searching for how things are done in Vega-Lite.
For example, take a look at this chart:
from altair import *

# load data as a pandas DataFrame
cars = load_dataset('cars')

chart = Chart(cars).mark_point().encode(
    y='Miles_per_Gallon',
    x='Horsepower',
    color='Origin',
)

chart

You can adjust the plot size in pixels using the configure_cell command: (Note: this is not true for current versions of Altair, version 2.0 or later. This issue revers to Altair version 1)
chart.configure_cell(height=200, width=200)

And you can adjust the axis limits using the domain subfield of any Channel (channels are the things passed to encode):
chart.encode(Y('Miles_per_Gallon', scale=Scale(domain=[-100, 100])))

Until we mirror the full vega-lite docs in Altair, you can learn more within the Vega-Lite docs themselves. The translation is pretty strightforward: JSON fields in Vega-Lite become Python attributes in Altair.
 jakevdp
on 18 Aug 2016
jakevdp
on 18 Aug 2016
Excellent. Thanks for your time and walkthrough.
klonuo
on 18 Aug 2016
it might be implied / intended, but in my hands the scale=Scale() does limit the ticks and box, but outliers I aim to exclude with this command are still displayed and I get a huge blank space above my graph like below. As a user, when I am set axis limits, I usually want no outliers to be displayed at all. Is there a chance to change the behaviour?

 DSLituiev
on 14 Apr 2017
DSLituiev
on 14 Apr 2017
Altair/Vega-Lite will not filter-out data points unless you explicitly ask it to. The config docs have some discussion of how to get around this: https://altair-viz.github.io/documentation/config.html#adjusting-axis-limits
jakevdp
on 14 Apr 2017
Thank you! Unfortunately I get complete nonsense when my data is of temporal type:
x_ = 'year'
y_ = 'num_citations'

xrange = [1980, 2020]
# data = data[data[x_]<xrange[-1]]
yrange = [0, 1.6e3]
# data = data[data[y_]<yrange[-1]]

chart = Chart(data[[x_, y_]].dropna()).mark_point().encode(
    x=X(x_, scale=Scale(domain=xrange, clamp=True),
        type="temporal", timeUnit="year",  # when this line is commented it's OK
        title="year"),
    y=Y(y_, scale=Scale(domain=yrange, clamp=True), title="number of citations"),
#     color='r',
)
# chart.configure_axis?
chart.display()

DSLituiev
on 14 Apr 2017
Yeah... I recall this being an issue, and somewhere I submitted a related bug report to vega-lite – if I recall correctly, when referencing temporal data you currently need to use the internal representation of the data, which is some integer number of nanoseconds I believe. I'll see if I can find the reference to that issue
Jake
jakevdp
on 14 Apr 2017
This is what I was thinking of: https://github.com/altair-viz/altair/issues/187
The conversion used here is what you need: https://github.com/altair-viz/altair/issues/187#issuecomment-244126070
Basically, you need to specify axis limits and filters in seconds since the zero-point, which is around 1970 I think.
From what I've heard, this issue will be addressed in the next release of Vega-Lite & Altair.
jakevdp
on 14 Apr 2017
Is there a reason that chart.configure_cell() would not work with mark_bar?
Modifying your example above:
import altair as alt
alt.enable_mime_rendering()

cars = alt.load_dataset('cars')
cars = cars.iloc[0:5]
chart = alt.Chart(cars).mark_bar().encode(
    y='Miles_per_Gallon',
    x='Name',
)

chart
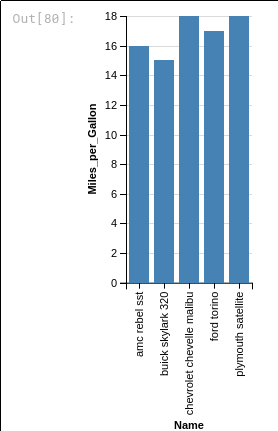
chart.configure_cell(height=200, width=800)

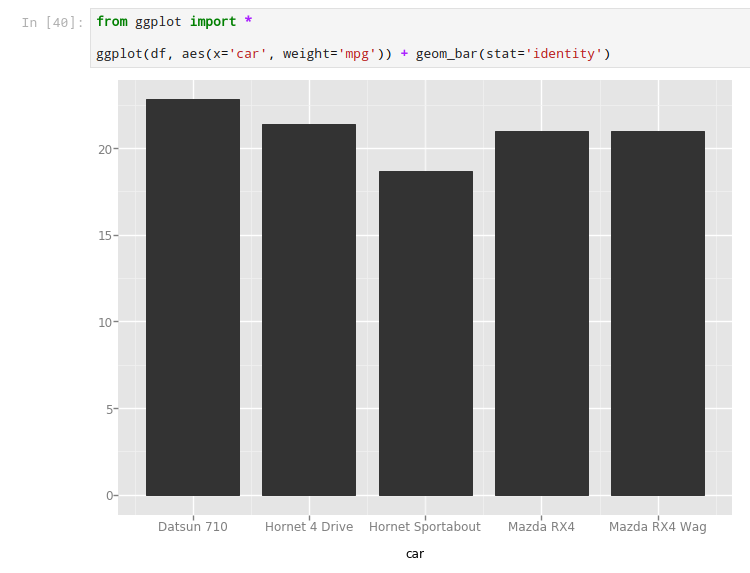
The specification appears to shrink the height, but it doesn't widen it. I just wanted to beef up the bars. No particular reason, just looks skinny to me. Here's the ggpy equivalent for reference.
 jwhendy
on 23 Dec 2017
jwhendy
on 23 Dec 2017
Is .configure_cell() not supported anymore in altair 2.0.1?:
---------------------------------------------------------------------------
AttributeError                            Traceback (most recent call last)
<ipython-input-10-09fe7b9dd3ab> in <module>()
     21 )
     22
---> 23 sample_chart.configure_cell(height=200, width=200)
     24
     25 sample_chart | tech_chart | logplot

~/.miniconda/envs/testing-altair/lib/python3.6/site-packages/altair/utils/schemapi.py in __getattr__(self, attr)
    173             except AttributeError:
    174                 _getattr = super(SchemaBase, self).__getattribute__
--> 175             return _getattr(attr)
    176
    177     def __setattr__(self, item , val):

AttributeError: 'Chart' object has no attribute 'configure_cell'
 brainstorm
on 8 Jun 2018
brainstorm
on 8 Jun 2018
Correct, most everything in this issue refers to version 1 and does not work on version 2. The documentation details how to customize charts in version 2.
In v2, you should use chart.properties(width=200, height=100)
jakevdp
on 8 Jun 2018
Related issues
 bmcfee
·
3Comments
bmcfee
·
3Comments
 HalukaMB
·
3Comments
HalukaMB
·
3Comments
 floringogianu
·
3Comments
floringogianu
·
3Comments
 Juan-132
·
3Comments
Juan-132
·
3Comments
 zanarmstrong
·
4Comments
zanarmstrong
·
4Comments
Most helpful comment
Hi,
These things are not all that well documented in Altair itself at the moment (we're working on that), but you can find info by searching for how things are done in Vega-Lite.
For example, take a look at this chart:
You can adjust the plot size in pixels using the
configure_cellcommand: (Note: this is not true for current versions of Altair, version 2.0 or later. This issue revers to Altair version 1)And you can adjust the axis limits using the
domainsubfield of anyChannel(channels are the things passed toencode):Until we mirror the full vega-lite docs in Altair, you can learn more within the Vega-Lite docs themselves. The translation is pretty strightforward: JSON fields in Vega-Lite become Python attributes in Altair.