Almanac.httparchive.org: Finalize assignments: Chapter 7. Performance
Section | Chapter | Coauthors | Reviewers
-- | -- | -- | --
II. User Experience | 7. Performance | @rviscomi @zeman | @JMPerez @obto @sergeychernyshev
Due date: To help us stay on schedule, please complete the action items in this issue by June 3.
To do:
- [x] Assign subject matter expert (author)
- [x] Assign peer reviewers
- [x] Finalize metrics
Current list of metrics:
- Field (Chrome UX Report)
- global distribution of FCP fast/avg/slow
- global distribution of FID fast/avg/slow
- % of fast FCP websites
- % of fast FID websites
- % of fast FCP+FID websites, per PSI definition
- % of websites with offline experiences
- country/region comparison of any/all of the above
- mobile vs desktop comparison of any/all of the above
- ECT comparison of any/all of the above
- Lab (HTTP Archive)
- Hero times
- first/last painted hero
- H1 rendering time
- Largest Image
- Largest Background Image
- Visually Complete
- First CPU Idle
- Time To Interactive
- Blocking CSS requests
- Blocking JS request
- Time To First Byte (Backend)
- Scripting CPU time
- Layout CPU time
- Paint CPU time
- Loading CPU time
- Lighthouse Performance Score
👉 AI (coauthors): Finalize which metrics you might like to include in an annual "state of web performance" report powered by HTTP Archive. Community contributors have initially sketched out a few ideas to get the ball rolling, but it's up to you, the subject matter experts, to know exactly which metrics we should be looking at. You can use the brainstorming doc to explore ideas.
The metrics should paint a holistic, data-driven picture of the web perf landscape. The HTTP Archive does have its limitations and blind spots, so if there are metrics out of scope it's still good to identify them now during the brainstorming phase. We can make a note of them in the final report so readers understand why they're not discussed and the HTTP Archive team can make an effort to improve our telemetry for next year's Almanac.
Next steps: Over the next couple of months analysts will write the queries and generate the results, then hand everything off to you to write up your interpretation of the data.
Additional resources:
 rviscomi
All 31 comments
@igrigorik any interest in peer reviewing this chapter? 😀
rviscomi
on 23 May 2019
@JMPerez @obto I've updated the list of current metrics above. Let me know if there's anything you'd change.
rviscomi
on 24 May 2019
Thanks for the heads-up. I'll take a look tonight
On Fri, May 24, 2019, 09:45 Rick Viscomi notifications@github.com wrote:
@JMPerez https://github.com/JMPerez @obto https://github.com/obto
I've updated the list of current metrics above. Let me know if there's
anything you'd change.—
You are receiving this because you were mentioned.
Reply to this email directly, view it on GitHub
https://github.com/HTTPArchive/almanac.httparchive.org/issues/9?email_source=notifications&email_token=AAFHFS5ASWVEZTHQ5H7FI63PW75R5A5CNFSM4HOOL7R2YY3PNVWWK3TUL52HS4DFVREXG43VMVBW63LNMVXHJKTDN5WW2ZLOORPWSZGODWFTCHY#issuecomment-495661343,
or mute the thread
https://github.com/notifications/unsubscribe-auth/AAFHFSY7AGWLJ72F34AZQ23PW75R5ANCNFSM4HOOL7RQ
.
 obto
on 24 May 2019
obto
on 24 May 2019
I'd like to see additional performance metrics that reflect the user experience included as well. Metrics like start render, speedindex and hero times that capture what a user is actually seeing on screen.
Happy to be a reviewer if you're looking for more people.
 zeman
on 27 May 2019
zeman
on 27 May 2019
I agree with adding a metric like SpeedIndex that gives some info about the overall loading experience. Combined with FID and FCP would give a better picture.
Hero times might be difficult to get. At Google I/O it was announced the Largest Contentful Paint (also Layout Stability). I assume both of them are in beta. If they are being tracked on HTTP Archive the Almanac could be a suitable way to share about them.
 JMPerez
on 27 May 2019
JMPerez
on 27 May 2019
How are we deciding what network speed to use? Averages published by places like opensignal (https://www.opensignal.com/market-analysis) can be helpful, but averages aren't very representative of how bad mobile data can be in congested areas or when you're in a low coverage area -- which happens a lot.
Putting more metrics in is always great but what's truly important is giving more context to these results we are collecting. Here are some ideas of mine of how to do so:
- I'd like to see breakdowns of these performance metrics by several industries. While looking at stats across the board is interesting... its much more meaningful to see how others in my industry are doing (my competitors). This is what ends up driving decision makers.
- For similar reasons to the above, it'd be really interesting to see how sites powered by Wordpress, and other frameworks and platforms, perform.
- How much faster do sites using CDNs tend to load vs those that do not? Sites using webfonts vs those that are not? Those offering webp vs not? Several others could be interesting, but the goal here is to see what optimizations tend to have the largest impact... and how large do they tend to be?
obto
on 27 May 2019
Also, I think it'd be really valuable to have a quick Google Meet sometime in the next few weeks to bounce ideas off each other or just get on the same page. We'd accomplish a lot in just 20 minutes. Let me know.
obto
on 27 May 2019
@zeman yes, it'd be great to have you as a reviewer! Thanks!
Metrics like start render, speedindex and hero times that capture what a user is actually seeing on screen.
I was planning to draw from the Chrome UX Report dataset, which includes real user data for FP, FCP, DCL, OL, and FID.
Start render should be covered by FCP. SI and hero timing are good ideas. We'll have to be sure to clearly denote which metrics are measured in the field and which are from the lab.
How are we deciding what network speed to use?
HTTP Archive uses 3G throttling for mobile and cable for desktop. Probably best not to make any changes to these configs until after the Almanac is out for consistency across tests.
I'd like to see breakdowns of these performance metrics by several industries.
Would _love_ to have this and it'd be useful as a dimension for pretty much every other chapter as well. The thing is that I'm not aware of a public dataset that we could use for mapping websites to industry.
it'd be really interesting to see how sites powered by Wordpress, and other frameworks and platforms, perform.
Yeah I looked into this before, for example: https://discuss.httparchive.org/t/cms-performance/1468?u=rviscomi
Since it's CMS specific maybe it's best to include in #16 and have something like "For CMS-specific performance, see Chapter 14"? cc @amedina FYI
How much faster do sites using CDNs tend to load vs those that do not?
Similarly, this might be best done in #19. cc @andydavies @colinbendell FYI
Sites using webfonts vs those that are not? Those offering webp vs not? Several others could be interesting, but the goal here is to see what optimizations tend to have the largest impact... and how large do they tend to be?
For these dimensions in particular I'm not sure they're clear enough signals from which to draw meaningful conclusions. "Do web fonts or webp affect performance?" seems like a question only an A/B test can reliably answer.
Also, I think it'd be really valuable to have a quick Google Meet sometime in the next few weeks to bounce ideas off each other or just get on the same page. We'd accomplish a lot in just 20 minutes. Let me know.
Great idea! I'm happy to meet if there's a time that works for everyone. Not sure how feasible that would be but open to trying it.
rviscomi
on 28 May 2019
In regards to industry breakdowns, if we're ok with not classifying each site but instead using large enough samples... then there are several options available. The first one off the top of my head being Alexa. Happy to look into other providers.
seems like a question only an A/B test can reliably answer.
Good point. It'd just be nice to know what changes tend to have the largest impacts overall since I've found it exceptionally helpful to get newcomers on the performance train some quick wins.
I can be pretty flexible. Just give me a couple times that work for you all.
obto
on 28 May 2019
@pmeenan has enabled hero rendering times for the next HTTPArchive crawl so there are metrics like first/last painted hero or H1 rendering time we'll be able to use to represent/compare when users actually see important content on the page.
Hero rendering times do have some important caveats around animated content and overlapping content that I'm happy to help write up.
zeman
on 30 May 2019
Nice! @zeman I'd be happy to add you as a coauthor and you can take the lab-based performance metrics. WDYT?
rviscomi
on 30 May 2019
@rviscomi sure, happy to take a crack at it and do a first pass assuming there's help with querying the data.
zeman
on 30 May 2019
Great! Yes, we're forming a team of data analysts to offload the query work from the authors. See #23
rviscomi
on 30 May 2019
@zeman @JMPerez @obto hoping to finalize the metrics for this chapter today. Could you give it a quick look at let us know if there's anything you'd change?
rviscomi
on 3 Jun 2019
I'll be giving every chapter I'm a part of a final look through again tonight
obto
on 3 Jun 2019
@rviscomi I was assuming that all the existing HTTP Archive metrics are available as well. But if we need to list them then here's the other important ones I'd want to look at. I wouldn't necessarily write about all these, but I'd like to explore the data to see if there are interesting correlations.
Hero times: Largest Image
Hero times: Largest Background Image
Visually Complete
First CPU Idle
Time To Interactive
Blocking CSS requests (via WPT custom metric, need to confirm with our team)
Blocking JS request (via WPT custom metric, need to confirm with our team)
Time To First Byte (Backend)
Scripting CPU time
Layout CPU time
Paint CPU time
Loading CPU time
First Paint
First Contentful Paint
First Meaningful Paint
DOM Interactive
DOM Content Loaded
DOM Complete
Page Load
Lighthouse Performance Score
Does CRUX have long tasks? That would be good to look at for JS performance. We find it more meaningful than FID at the moment.
zeman
on 4 Jun 2019
Thanks @zeman! Yes all HTTP Archive metrics are fair game. Keep in mind that each metric we list here will need to be queried by the Data Analyst team, so it'd be good to narrow it down as best we can.
For lab metrics, I think we can drop timing metrics like FP, FCP, DCL, OL which are available in CrUX. Lab timing data also tends to be more reliable as an indicator of trends than as absolute numbers. Also things like CPU stats are interesting to see what the shape of their distributions are, but individual stats like median JS parse time for example may be less conclusive/applicable.
CrUX doesn't currently have long tasks. I'd keep an eye on https://github.com/WICG/layout-instability/blob/master/README.md though. 🤐
rviscomi
on 4 Jun 2019
@zeman how do these lab metrics sound to you?
- Hero times
- first/last painted hero
- H1 rendering time
- Largest Image
- Largest Background Image
- Visually Complete
- First CPU Idle
- Time To Interactive
- Blocking CSS requests
- Blocking JS request
- Time To First Byte (Backend)
- Scripting CPU time
- Layout CPU time
- Paint CPU time
- Loading CPU time
- Lighthouse Performance Score
Let's lock them in and we can pass them off to the analysts.
rviscomi
on 6 Jun 2019
@zeman, @rviscomi it looks like original list at the top has Hero: H1 listed, but I don't see it in the final list, any reason for that?
I found that it works well for text-based sites and their relationship with fonts (e.g. FOIT on headlines).
 sergeychernyshev
on 6 Jun 2019
sergeychernyshev
on 6 Jun 2019
Thanks @sergeychernyshev, updated to include the lab metrics from the top comment.
rviscomi
on 6 Jun 2019
@sergeychernyshev @zeman @JMPerez @obto I've updated the list of metrics in https://github.com/HTTPArchive/almanac.httparchive.org/issues/9#issue-446805948 based on our discussions and I think we should be good to go now. I'll close this issue. Feel free to reopen if you have any concerns.
rviscomi
on 6 Jun 2019
Have mapped the following three performance metrics as shown below
- Scripting CPU time = _cpu.v8.compile + _cpu.FunctionCall + _cpu.EvaluateScript (e.g. CAST(JSON_EXTRACT(payload, "$['_cpu.v8.compile']") as INT64) compile)
- Layout CPU time = _cpu.Layout
- Paint CPU time = _cpu.Paint
Refer 160-162 of the Metrics Triage sheet. Wanted to check if the understanding is correct.
Refer to @paulcalvano post on "Using Wappalyzer to Analyze CPU Times Across JS Frameworks"
 raghuramakrishnan71
on 18 Jun 2019
raghuramakrishnan71
on 18 Jun 2019
Thanks @raghuramakrishnan71. That mapping LGTM.
cc @pmeenan @zeman @mathiasbynens in case they have any suggestions/corrections.
rviscomi
on 18 Jun 2019
Scripting CPU time = _cpu.v8.compile + _cpu.FunctionCall + _cpu.EvaluateScript (e.g. CAST(JSON_EXTRACT(payload, "$['_cpu.v8.compile']") as INT64) compile)
For scripting CPU time, what really matters is the time spent on the main thread (because that’s what potentially delays TTI), not necessarily the total time. I also noticed that parsing is not included?
In terms of RCS categories, it seems like you’d want "Parse" (but not "Parse-Background"), "Compile" (but not "Compile-Background"), "Optimize" (but not "Optimize-Background") and "JavaScript" (for execution).
cc @verwaest
 mathiasbynens
on 19 Jun 2019
mathiasbynens
on 19 Jun 2019
@zeman @rviscomi
Wanted to reconfirm that Time to interactive and First CPU idle are currently from Lighthouse (also saw similar mention in the current performance reports of Http Archive).
- Is First CPU idle = audits.first-cpu-idle.rawValue or first-interactive?
- Is Time to interactive = audits.interactive or consistently-interactive?
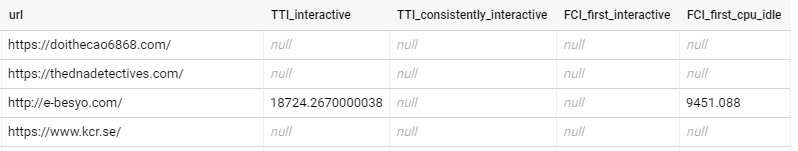
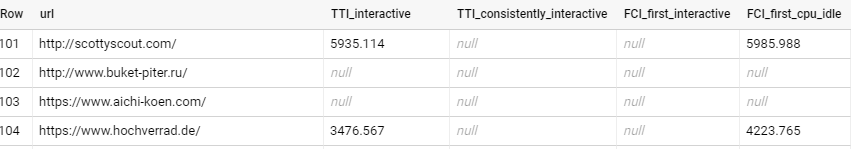
Ran the following query on the sample set.
SELECT
url AS url,
JSON_EXTRACT(report, "$.audits.interactive.rawValue") AS TTI_interactive,
JSON_EXTRACT(report, "$.audits.consistently-interactive.rawValue") AS TTI_consistently_interactive,
JSON_EXTRACT(report, "$.audits.first-interactive.rawValue") AS FCI_first_interactive,
JSON_EXTRACT(report, "$.audits.first-cpu-idle.rawValue") AS FCI_first_cpu_idle
FROM httparchive.sample_data.lighthouse_mobile_1k
Some of the values appear to have NULLs; so maybe we need take the value which is not NULL. In that case, is there a preferred attribute?
raghuramakrishnan71
on 21 Jun 2019
The wpt-reported CPU times are all main-thread.
On Wed, Jun 19, 2019 at 7:56 AM Mathias Bynens notifications@github.com
wrote:
Scripting CPU time = _cpu.v8.compile + _cpu.FunctionCall +
_cpu.EvaluateScript (e.g. CAST(JSON_EXTRACT(payload,
"$['_cpu.v8.compile']") as INT64) compile)For scripting CPU time, what really matters is the time spent on the main
thread (because that’s what potentially delays TTI), not necessarily the
total time. I also noticed that parsing is not included?In terms of RCS https://v8.dev/docs/rcs categories, it seems like you’d
want "Parse" (but not "Parse-Background"), "Compile" (but not
"Compile-Background"), "Optimize" (but not "Optimize-Background") and
"JavaScript" (for execution).cc @verwaest https://github.com/verwaest
—
You are receiving this because you were mentioned.Reply to this email directly, view it on GitHub
https://github.com/HTTPArchive/almanac.httparchive.org/issues/9?email_source=notifications&email_token=AADMOBMTKH4QCAKNWUEVIDLP3ING7A5CNFSM4HOOL7R2YY3PNVWWK3TUL52HS4DFVREXG43VMVBW63LNMVXHJKTDN5WW2ZLOORPWSZGODYBUABA#issuecomment-503529476,
or mute the thread
https://github.com/notifications/unsubscribe-auth/AADMOBODIE7B6CFSWR4374DP3ING7ANCNFSM4HOOL7RQ
.
 pmeenan
on 21 Jun 2019
pmeenan
on 21 Jun 2019
Is First CPU idle = audits.first-cpu-idle.rawValue or first-interactive?
first-cpu-idle
Is Time to interactive = audits.interactive or consistently-interactive?
interactive
Some of the values appear to have NULLs; so maybe we need take the value which is not NULL. In that case, is there a preferred attribute?
You may need to look at the numericValue field for some metrics as opposed to rawValue. Example for https://www.kcr.se/:
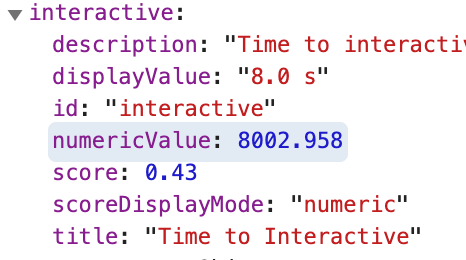
Thanks for looking into these @raghuramakrishnan71!
rviscomi
on 24 Jun 2019
Good chance it depends on which dataset you look at. T believe it changed
from rawValue to numericValue in Lighthouse 5 so if you are looking at a
comparison you may need to pull both.
On Mon, Jun 24, 2019 at 8:53 AM Rick Viscomi notifications@github.com
wrote:
For the Lighthouse metrics, you may need to look at the numericValue
field as opposed to rawValue. Example for https://www.kcr.se/:[image: image]
https://user-images.githubusercontent.com/1120896/60020203-d0daca00-968f-11e9-9f84-57c718339927.png—
You are receiving this because you were mentioned.
Reply to this email directly, view it on GitHub
https://github.com/HTTPArchive/almanac.httparchive.org/issues/9?email_source=notifications&email_token=AADMOBIPYP6XIIB6QGPN7EDP4C7WFA5CNFSM4HOOL7R2YY3PNVWWK3TUL52HS4DFVREXG43VMVBW63LNMVXHJKTDN5WW2ZLOORPWSZGODYM2JEA#issuecomment-504997008,
or mute the thread
https://github.com/notifications/unsubscribe-auth/AADMOBO75WTFMR2PYJTLS3DP4C7WFANCNFSM4HOOL7RQ
.
pmeenan
on 24 Jun 2019
@rviscomi I am not very clear about the metric "header volume" (Content Distribution/CDN). Does it refer to the size of the HTTP headers?
raghuramakrishnan71
on 28 Jun 2019
@zcorpan Does the metric "Attribute usage (stretch goal)" (Page Content/Markup) refer to the usage of HTML attributes. In that case we may be able to find out distribution (https://discuss.httparchive.org/t/usage-of-aria-attributes/778)
The same was marked as "Custom Metric Required" as I was not very clear initially.
raghuramakrishnan71
on 28 Jun 2019
@raghuramakrishnan71 could you post these comments in their respective chapters? #19 for CDN and #5 for Markup
rviscomi
on 28 Jun 2019
Related issues
rviscomi
·
6Comments
obto
·
5Comments
rviscomi
·
6Comments
rviscomi
·
3Comments
 bazzadp
·
4Comments
bazzadp
·
4Comments