Adguardforsafari: Possible Memory Leak
- [X] I am running the latest version
- [X] I checked the documentation and found no answer
- [X] I checked to make sure that this issue has not already been filed
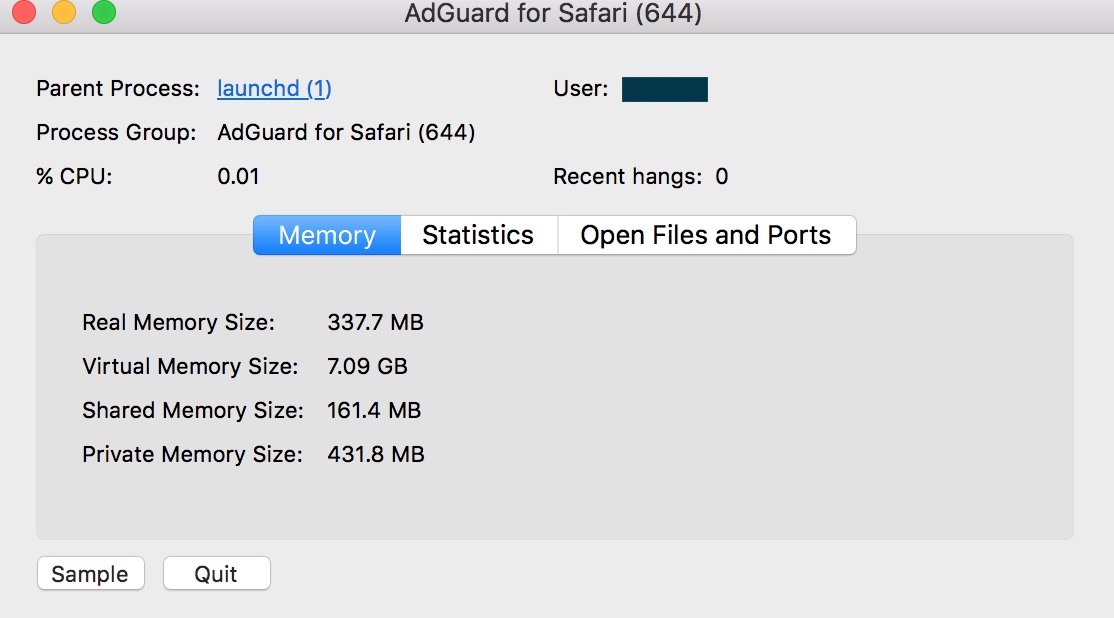
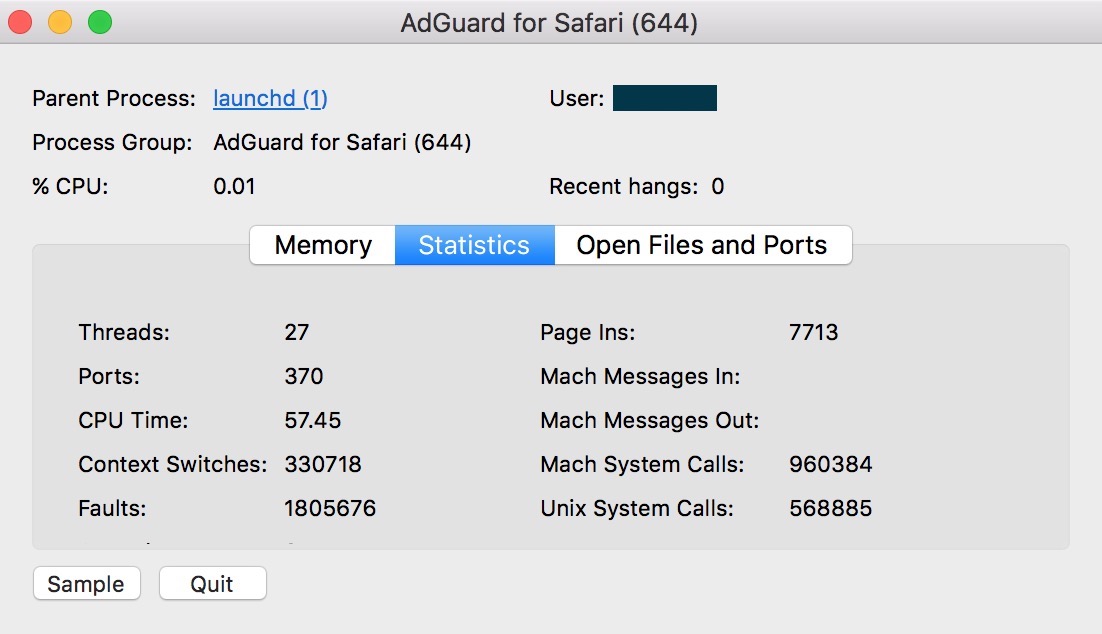
Noticing High Virtual Memory that keeps expanding with app running time (starts at around 7GB, after 24 hours, it'll reach over 32GB Virtual Memory, then macOS memory management starts caching files and swapping gigs of memory to disk, after some investigation, eliminated the source to be AdGuard for Safari (Started with 1.8.9 and continued with 1.8.10 (and 1.9.0 beta) both MAS and GitHub versions. Thought I highlight this issue as I don't see it mentioned previously, hopefully someone sheds some light into this.
- AdGuard for Safari version: 1.8.10
- Environment name and version: 12.1.2
- Operating System: macOS Sierra 10.12.6
- Filters you use in AdGuard: Recommended default filters (base/annoyance).
- Any other browser extensions you have installed: N/A
Screenshots
Upon App Startup after a clean system restart:
Additional Information
On Another note, I have a question (inquiry) about blocking popups with the $popup tag, how can this be implemented in the user filter in 1.8.x onwards versions to mimic its older behavior (pre-1.8.x) to block all popups from a specific domain without blocking the actually domain itself? As far as i can see the AdGuard Documentation is still referring to ||domain.xyz^$popup.
 JSPSolvent
All 9 comments
I can verify this. I’m not sure when exactly it started, but it’s fairly recent, possibly even before 1.8.10. Currently running 1.9.0 from the beta channel.
Currently, AdGuard is using 1.94 GB according to Activity Monitor. Eventually, it will cause the AdGuard app to crash and disable ad blocking in Safari.
This crash happens silently, and I only notice it because the status icon inside Safari shows AdGuard being paused, or because I look for AdGuard in my macOS menu bar and it’s no longer there.
adg_safari_logs_1610150238957.zip

 zecanard
on 9 Jan 2021
zecanard
on 9 Jan 2021
Is there anything that triggers it? Maybe checking filters updates?
 ameshkov
on 9 Jan 2021
ameshkov
on 9 Jan 2021
It’s possible, since I have my Update Interval set to Every hour. I don’t check filters manually.
Other than that, I’ve rarely touched AdGuard these past few weeks; I’ll just notice that ad blocking stopped out of the blue, and the app is no longer loaded. Since my previous post, memory usage has grown to 2.36 GB in Activity Monitor.
Also, running macOS Big Sur 11.1.
zecanard
on 9 Jan 2021
In my case, I have check filter updates set to every 48 hours, and I don't check manually either. So I don't think it's due to filter updates per say. I did notice though that when AdGuard for Safari reaches over 2GB RAM usage and OS starts swapping to disk (I have 8GB RAM; without adguard running I would have around 3-4GB out of 8GB physical ram being used on average) that this process 'com.apple.SafariServices.ExtensionHelper' uses more than 300% cpu followed by a Safari crash, and in some cases freezing the entire mac. The only solution was killing the process and quitting Adguard from the menu bar and/or restarting the mac, and then the whole cycle begins again after some time.
Note that I'm running macOS Sierra 10.12.6 and Safari 12.1.2 and I was not faced with this issue using older versions (e.g. 1.8.2, BUT I had a similar issue (in terms of Safari extension helper crashing Safari) when I was running 1.7.4 Git version).
PS. I wish I can upload my logs, but I'm currently away from the affected Mac.
JSPSolvent
on 10 Jan 2021
@JSPSolvent Would be great to see your logs. Although we only test the app starting from macOS 10.14.x, we might find something helpful.
@zecanard Please check for crash reports in console app. If it's possible please provide it.
Just in case, I suggest your may try to disable AdGuard Advanced Blocking extension in safari preferences.
 Mizzick
on 11 Jan 2021
Mizzick
on 11 Jan 2021
@Mizzick com.apple.SafariServices.ExtensionHelper is a part of AdGuard main process, not an extension.
I assume this is a process responsible with messaging between extensions and the main process (needs to be checked).
ameshkov
on 11 Jan 2021
@Mizzick I found this crash log from last week, which will hopefully help. I had to restart my computer last night, so AdGuard hasn’t crashed again since, but it had exceeded 3GB at the time I rebooted. I’ve now disabled Advanced Blocking with AdGuard sitting at 736MB of usage, and will keep an eye on it.
zecanard
on 12 Jan 2021
A few hours later, and AdGuard is sitting on 1.07GB of memory usage, so it’s probably not Advanced Blocking.
zecanard
on 12 Jan 2021
@Mizzick so the leak is 100% in JS code:
Thread 0 Crashed:: CrBrowserMain  Dispatch queue: com.apple.main-thread
0   com.github.Electron.framework   0x0000000104feb0d1 ElectronInitializeICUandStartNode + 1310993
1   com.github.Electron.framework   0x00000001086704f3 v8::internal::FatalProcessOutOfMemory(v8::internal::Isolate*, char const*) + 755
2   com.github.Electron.framework   0x0000000108670483 v8::internal::FatalProcessOutOfMemory(v8::internal::Isolate*, char const*) + 643
3   com.github.Electron.framework   0x0000000108749105 v8::internal::Heap::FinalizeIncrementalMarkingAtomically(v8::internal::GarbageCollectionReason) + 1781
4   com.github.Electron.framework   0x00000001055aab34 v8::internal::Heap::builtin(int) + 4564
@zecanard please do the following:
- Wait until AG starts using a lot of memory again
- Open it, press CMD+Option+I
- Dev tools window will be opened
- Go to the "Memory" tab
- Take a "Heap snapshot" there
- Export it to a file and upload it here
ameshkov
on 12 Jan 2021
Related issues
 Oleg-Chashko
·
7Comments
Oleg-Chashko
·
7Comments
 crankygeologist
·
6Comments
ameshkov
·
6Comments
Oleg-Chashko
·
4Comments
crankygeologist
·
6Comments
ameshkov
·
6Comments
Oleg-Chashko
·
4Comments
 interpretor
·
5Comments
interpretor
·
5Comments