Zotero-better-bibtex: Export (manual) stuck at 40 percent
For the last few (beta) versions, my manual export gets stuck at 40 percent.
Support log ID: IFZNF83B-euc
MacOS 11.3.1 (20E241)
Zotero 5.0.97-beta.27+861d5787d
 jrennstich
All 103 comments
Can you disable zotero-scite, restart, and try again? There are no BBT errors in IFZNF83B-euc but a lot of zotero-scite errors.
 retorquere
on 20 May 2021
retorquere
on 20 May 2021
Sure thing:
Support Log ID: GL5ZTW4F-euc
Same problem on my end here, though. :-(
jrennstich
on 20 May 2021
I see just one export, but that's an auto-export that completes. Can I get a copy of your database to see if I can replicate this?
retorquere
on 20 May 2021
It’s huge…
jrennstich
on 20 May 2021
How big? I can set up a file drop off if it's less than 100G
retorquere
on 20 May 2021
Yes, we need that drop off again (it’s grown since last time, but not that much :-)
jrennstich
on 20 May 2021
10G max, sorry. https://forms.gle/KN8tRjj5QhQVY72Q8
retorquere
on 20 May 2021
Loading now.
...
done.
jrennstich
on 20 May 2021
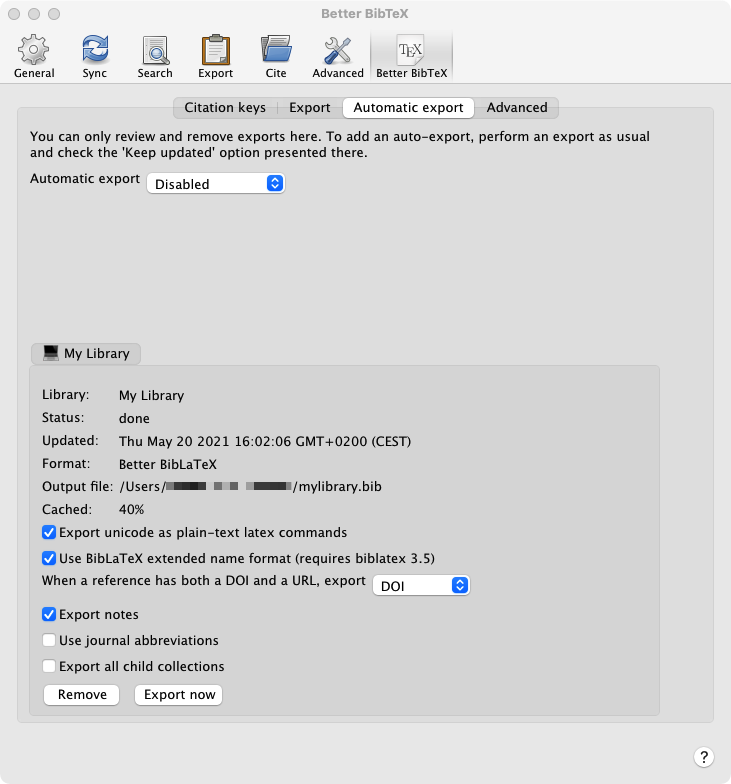
How do you know it's stuck at 40%? I don't get progress feedback.
retorquere
on 21 May 2021
I am probably to trusting in dialog boxes :-) Always stops with 40 percent.
jrennstich
on 21 May 2021
Oh I thought it was a manual export?
retorquere
on 21 May 2021
My bad/misunderstanding. I thought, when I choose "Automatic export - disabled" and thus have to trigger the exports manually that also means "manual export". I forgot that you can export manually directly as well.
jrennstich
on 21 May 2021
That's alright, I realize now that's ambiguous. But then I did see that one manually-triggered auto-export in IFZNF83B-euc, and that finished correctly.
It is in principle possible that the cache isn't fully filled, but the export completed correctly. I'll have to think about providing some kind of feedback for large exports.
retorquere
on 21 May 2021
:robot: this is your friendly neighborhood build bot announcing test build 5.4.15.901 ("show export progress")
Install in Zotero by downloading test build 5.4.15.901, opening the Zotero "Tools" menu, selecting "Add-ons", open the gear menu in the top right, and select "Install Add-on From File...".
![github-actions[bot] picture](https://avatars.githubusercontent.com/in/15368?v=4&s=40) github-actions[bot]
on 22 May 2021
github-actions[bot]
on 22 May 2021
Thanks for updating BBT. Alas, no change, I do see a new "Progress: " Info line, which is something you included here, I am sure.
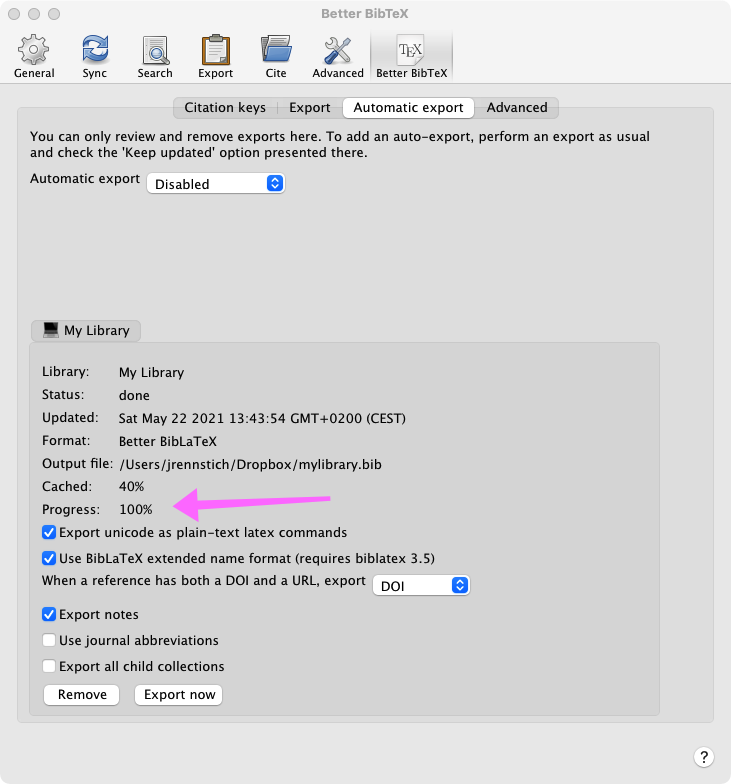
Here's the
Support log ID: ZQGLNISY-euc
Thanks for all your awesome support!
jrennstich
on 22 May 2021
You should be able to see the progress climb; in the main interface there's also a progress bar left of the quick search that shows while an export is running.
retorquere
on 22 May 2021
There was no change for me, unfortunately.
jrennstich
on 22 May 2021
:robot: this is your friendly neighborhood build bot announcing test build 5.4.15.910 ("show progress")
Install in Zotero by downloading test build 5.4.15.910, opening the Zotero "Tools" menu, selecting "Add-ons", open the gear menu in the top right, and select "Install Add-on From File...".
github-actions[bot]
on 24 May 2021
Oooooh, I LOVE ❤️ that new "Status" line in the dialog. Gives more information, uses less space, well-done you! Here's the result from the log:
BDIU22HX-euc
Works as advertised.
jrennstich
on 24 May 2021
So you do see the progress climb now?
retorquere
on 24 May 2021
:robot: this is your friendly neighborhood build bot announcing test build 5.4.15.934 ("show prev cacherate")
Install in Zotero by downloading test build 5.4.15.934, opening the Zotero "Tools" menu, selecting "Add-ons", open the gear menu in the top right, and select "Install Add-on From File...".
github-actions[bot]
on 24 May 2021
I've re-added the cache rate -- I have a method now which is faster and more precise.
retorquere
on 24 May 2021
So you do see the progress climb now?
Indeed!
jrennstich
on 24 May 2021
With the 5.4.15.934 testbuild, I don't get the loading BBT info window on the bottom right anymore. Also I get a dialog box that looks like this:
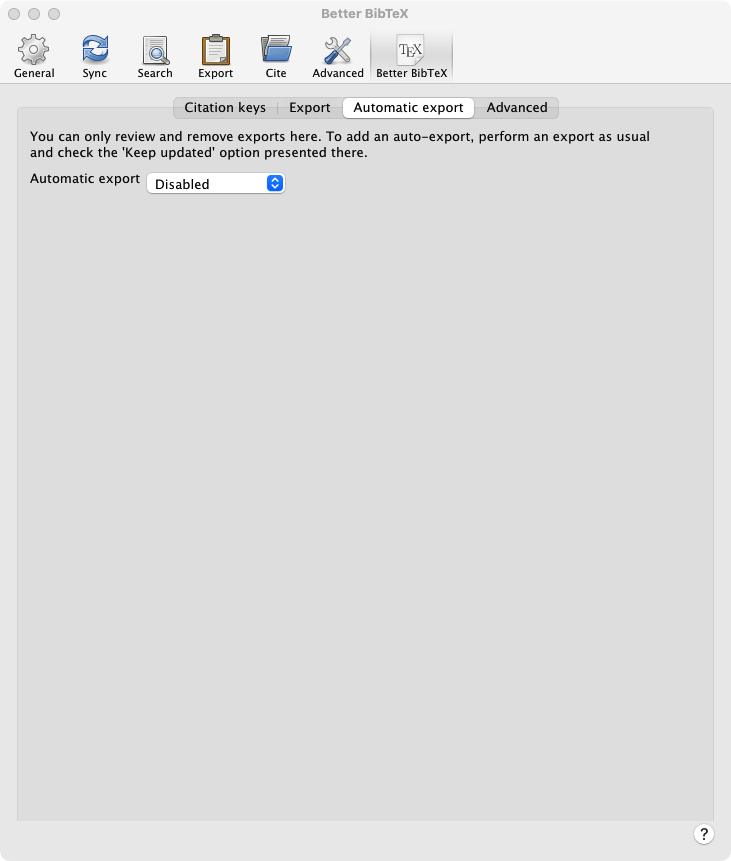
How do I trigger an export now?
jrennstich
on 25 May 2021
Also, I cannot start the sending the BBT support log process anymore. Rebooted Zotero (beta: 5.0.97-beta.27+861d5787d) to no avail.
jrennstich
on 25 May 2021
~That means BBT didn't finish loading. The preferences are hidden until the load is done.~ that isn't right, there's text showing, so BBT did load. ~Can you get me a debug log, making sure to check the 'send DB' checkbox?~ OK, you can't. Hold on.
retorquere
on 25 May 2021
Does 901 work for you?
retorquere
on 25 May 2021
Does 901 work for you?
Yes and no. Everything works as advertised the FIRST time I install BBT 910. But when I reboot Zotero to enable the support log, no window, no reaction after selecting the menu (Send BBT support log). Same with 934. After installing and first reboot it works. Second reboot, it's gone.
jrennstich
on 25 May 2021
934 also seems to show status in 5 percent increments. This works only after a fresh install and the first reboot.
jrennstich
on 25 May 2021
When it starts failing (preferably on 934), can you quit Zotero and then start it using
/Applications/Zotero.app/Contents/MacOS/zotero -purgecaches -jsconsole -ZoteroDebugText > ~/BBT.log &
and get me BBT.log
retorquere
on 25 May 2021
(it is correct that progress is reported in 5% increments)
retorquere
on 25 May 2021
I cannot reproduce the problem locally with your database yet. I can restart Zotero beta at will with your database.
retorquere
on 25 May 2021
Do I copy each line individually from the error console? I don't seem to be able to select more than one.
jrennstich
on 25 May 2021
You can skip the error console
retorquere
on 25 May 2021
Support log: CV6CXQ99-euc
jrennstich
on 25 May 2021
I thought you had a problem where you couldn't send a debug log?
retorquere
on 25 May 2021
With that command you send me it works
jrennstich
on 25 May 2021
I ran that in the Terminal
jrennstich
on 25 May 2021
Ehm... that's not supposed to make any difference. There's also way too little in the logs. What about if you run
/Applications/Zotero.app/Contents/MacOS/zotero -ZoteroDebugText > ~/BBT.log &
Ehm... that's not supposed to make any difference. There's also way too little in the logs. What about if you run
/Applications/Zotero.app/Contents/MacOS/zotero -ZoteroDebugText > ~/BBT.log &
Well, it did 😳 - booted up normally and back to square one.
jrennstich
on 25 May 2021
Sorry, I am confused. Is this a Terminal command or a link to a folder?
jrennstich
on 25 May 2021
both work. which is super odd to me.
jrennstich
on 25 May 2021
Terminal command, sorry.
retorquere
on 25 May 2021
When I ran it in Terminal, I wasn't able to get the error log again this time. How do I access the info you need?
jrennstich
on 25 May 2021
The output will be in a file called BBT.log in your home dir.
retorquere
on 25 May 2021
Thanks! 😳
BBT.log
jrennstich
on 25 May 2021
And this was with the error reproduced? There's zero BBT activity in that log.
retorquere
on 25 May 2021
I booted up Zotero from the Finder this time, not from the Terminal. This is the error log.
jrennstich
on 25 May 2021
Again zero BBT activity. I'm also missing info at the start of the log, for me it starts with
1621938051820 addons.manager  DEBUG Loaded provider scope for resource://gre/modules/addons/XPIProvider.jsm: ["XPIProvider", "XPIInternal"]
1621938051823 addons.manager  DEBUG Loaded provider scope for resource://gre/modules/LightweightThemeManager.jsm: ["LightweightThemeManager"]
1621938051844 addons.manager  DEBUG Loaded provider scope for resource://gre/modules/addons/GMPProvider.jsm
1621938051846 addons.manager  DEBUG Loaded provider scope for resource://gre/modules/addons/PluginProvider.jsm
1621938051847 addons.manager  DEBUG Starting provider: XPIProvider
1621938051847 addons.xpi  DEBUG startup
1621938051847 addons.xpi  INFO  SystemAddonInstallLocation directory is missing
1621938051848 addons.xpi  INFO  Removing all system add-on upgrades.
1621938051848 addons.xpi  DEBUG Skipping unavailable install location app-system-share
1621938051849 addons.xpi  DEBUG checkForChanges
1621938051850 addons.xpi  DEBUG Loaded add-on state: {"app-profile":{"addons":{"[email protected]":{"enabled":true,"lastModifiedTime":1621931997719,"path":"[email protected]","signedState":0,"version":"0.1.5","enableShims":true},"[email protected]":{"enabled":true,"lastModifiedTime":1621931997752,"path":"[email protected]","signedState":0,"version":"5.4.16.emile.limonia","enableShims":true},"[email protected]":{"enabled":true,"lastModifiedTime":1621931998443,"path":"[email protected]","signedState":0,"version":"4.1.2a1"}},"path":"/Users/emile/.BBTZ5TEST/extensions"},"app-global":{"addons":{"[email protected]":{"enabled":true,"lastModifiedTime":1619778875178,"path":"[email protected]","signedState":0,"version":"5.0.25.SA.5.0.96.2","enableShims":true,"currentModifiedTime":1619778875178},"[email protected]":{"enabled":true,"lastModifiedTime":1619778875206,"path":"[email protected]","signedState":0,"version":"5.0.36.SA.5.0.96.2","enableShims":true,"currentModifiedTime":1619778875206}},"path":"/Applications/Zotero.app/Contents/Resources/extensions","checkStartupModifications":true}}
1621938051851 addons.xpi  INFO  Mapping [email protected] to /Users/emile/.BBTZ5TEST/extensions/[email protected]
and that's missing in BBT.log. I also see this in the console when I start Zotero this way:
$ 2021-05-25 12:20:52.144 zotero[6062:101216] *** WARNING: Textured window <ToolbarWindow: 0x10ec34850> is getting an implicitly transparent titlebar. This will break when linking against newer SDKs. Use NSWindow's -titlebarAppearsTransparent=YES instead.
JavaScript warning: resource://zotero/loader.jsm -> resource://zotero/bluebird/util.js, line 205: unreachable code after return statement
JavaScript warning: resource://zotero/loader.jsm -> resource://zotero/bluebird/util.js, line 205: unreachable code after return statement
JavaScript warning: chrome://zotero/content/zoteroPane.js, line 5347: unreachable code after return statement
objc[6062]: Class ZoteroSBApplicationDelegate is implemented in both /Applications/Zotero-beta.app/Contents/Resources/extensions/[email protected]/resource/libZoteroWordIntegration.dylib (0x11eaafb30) and /Applications/Zotero-beta.app/Contents/Resources/extensions/[email protected]/resource/libZoteroWordIntegrationClient.dylib (0x11eacba88). One of the two will be used. Which one is undefined.
2021-05-25 12:20:56.118 zotero[6062:101216] Warning: Expected min height of view: (<NSButton: 0x156916c00>) to be less than or equal to 30 but got a height of 32.000000. This error will be logged once per view in violation.
can you make sure Zotero is not running, remove BBT.log, then start using
/Applications/Zotero.app/Contents/MacOS/zotero -ZoteroDebugText > ~/BBT.log &
again, reproduce the error, quit zotero, and then attach the log here.
retorquere
on 25 May 2021
Submitted through Zotero
D288127080
Debug Output
BBT.log
jrennstich
on 25 May 2021
If you just want to get on with your life, grab 5.4.14, but I'd hugely appreciate it if you would be around to test.
retorquere
on 25 May 2021
:robot: this is your friendly neighborhood build bot announcing test build 5.4.16.956 ("log startup errors")
Install in Zotero by downloading test build 5.4.16.956, opening the Zotero "Tools" menu, selecting "Add-ons", open the gear menu in the top right, and select "Install Add-on From File...".
github-actions[bot]
on 25 May 2021
Here's the support log: H2NXZ644-euc
jrennstich
on 25 May 2021
After reboot, same problem, so here's the file:
BBT.log
jrennstich
on 25 May 2021
Can you make a new log with
/Applications/Zotero-beta.app/Contents/MacOS/zotero -ZoteroDebugText 2>&1 > ~/BBT.log &
that doesn't work :-(
jrennstich
on 25 May 2021
do i need to add the beta version?
jrennstich
on 25 May 2021
Ah shit that should have been
/Applications/Zotero.app/Contents/MacOS/zotero -ZoteroDebugText 2>&1 > ~/BBT.log &
Grr, that still doesn't have the full startup log. No idea why this is so different on my system.
Other take. Type script on the command line. You will see
Script started, output file is typescript
and will be back at the prompt. There, type
/Applications/Zotero.app/Contents/MacOS/zotero -ZoteroDebugText
reproduce the error, and quit zotero. You should once again see the command prompt. Type exit, you will see
Script done, output file is typescript
and attach the file typescript it generated here.
retorquere
on 25 May 2021
Didn't seem to work. Here's the zip'd file
typescript.zip
jrennstich
on 25 May 2021
It did work, and I think this finally gives me the info I need.
retorquere
on 25 May 2021
Can you go into the hidden prefs, look up extensions.zotero.translators.better-bibtex.citekeySearch, disable it, and restart Zotero?
retorquere
on 25 May 2021
I think #1821 and #1811 are addressing the same problem -- would you be OK joining there? That way I only have one place to coordinate release builds. It's all a little hectic right now, no idea why I cannot reproduce this.
retorquere
on 25 May 2021
Can you go into the hidden prefs, look up extensions.zotero.translators.better-bibtex.citekeySearch, disable it, and restart Zotero?
Did as instructed. Problem consists.
jrennstich
on 25 May 2021
I have now updated MacOS to 11.4 (20F71)
jrennstich
on 25 May 2021
:robot: this is your friendly neighborhood build bot announcing test build 5.4.16.959 ("logging")
Install in Zotero by downloading test build 5.4.16.959, opening the Zotero "Tools" menu, selecting "Add-ons", open the gear menu in the top right, and select "Install Add-on From File...".
github-actions[bot]
on 25 May 2021
No change :-( Should I switch over to the other thread? Or try 960?
jrennstich
on 25 May 2021
960 just adds more logging. It'll help a lot if we could switch to a single thread -- I'm flooded with reports right now and I need to focus.
retorquere
on 25 May 2021
5.4.19 should fix the problem you have and should also start faster after the first time than it used to.
retorquere
on 26 May 2021
Not sure where to post it now, but given the other issue is closed, I'll try here. It's running quicker, yes! I also was able to submit a support log:
6UKNQA6A-euc
Alas:
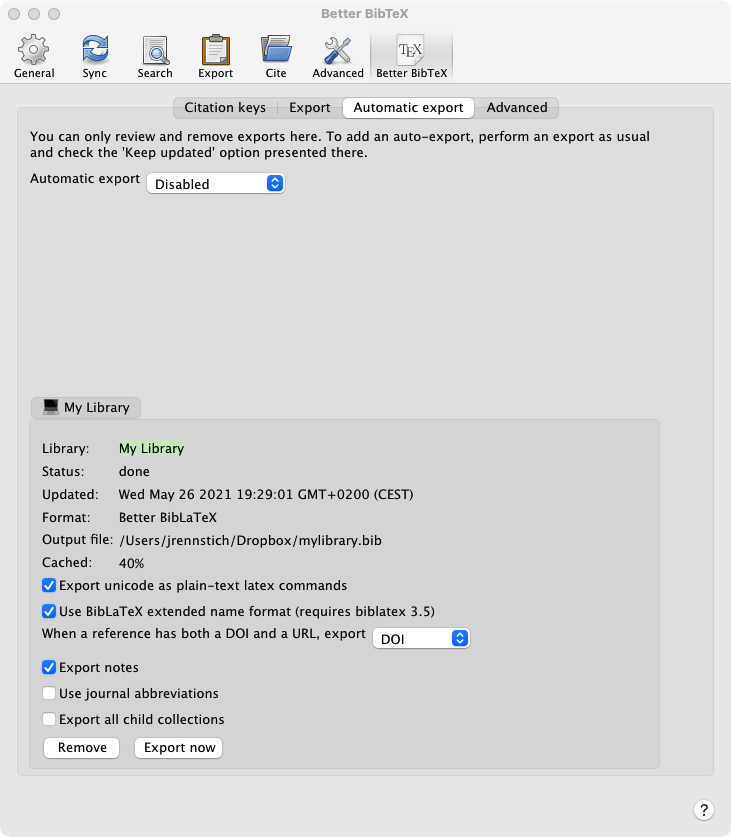
The exported BibTeX file seems complete tho, so that's the important thing to me.
Thanks for all your incredible support!
jrennstich
on 26 May 2021
Ran it again, no change in the cache. Very quick this time (given it's a hot export).
Support log ID: 4VESU7MZ-euc
jrennstich
on 26 May 2021
:robot: this is your friendly neighborhood build bot announcing test build 5.4.19.975 ("cache rate")
Install in Zotero by downloading test build 5.4.19.975, opening the Zotero "Tools" menu, selecting "Add-ons", open the gear menu in the top right, and select "Install Add-on From File...".
github-actions[bot]
on 26 May 2021
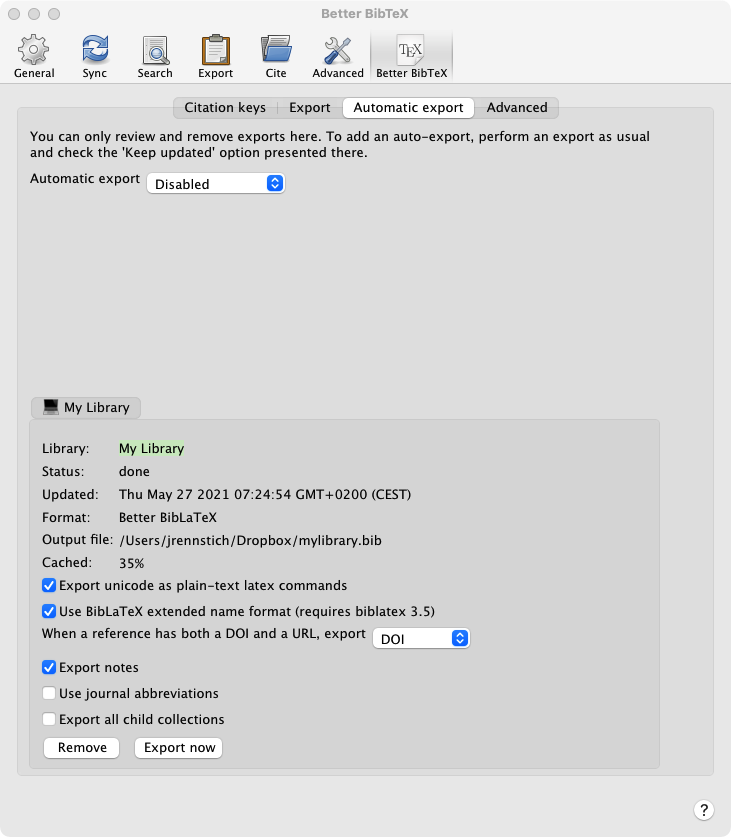
After clicking "Export now" it ran twice (on its own). Now it's showing 35 percent.
Support Log ID: XJDLE29Q-euc (w/o cache)
Support Log ID: TRGAPSBJ-euc (w cache)
jrennstich
on 27 May 2021
With latest beta () and reactived scite plug-in as it seems to make no difference. Back to 40 percent.
Support Log-ID: 67ZU7JC4-euc
jrennstich
on 28 May 2021
:robot: this is your friendly neighborhood build bot announcing test build 5.4.19.981 ("Merge branch 'gh-1829' into gh-1811")
Install in Zotero by downloading test build 5.4.19.981, opening the Zotero "Tools" menu, selecting "Add-ons", open the gear menu in the top right, and select "Install Add-on From File...".
github-actions[bot]
on 28 May 2021
I'm not seeing some things in your log that really should be there. Can you get me a new one? Sorry about all this man, I know Zotero restarts are not fun with a database as large as yours.
retorquere
on 28 May 2021
I admire your endurance with these issues, so what's a little rebooting in comparison? Here's the
Support Log ID: 4ECS8DCE-euc
BTW, do you need the cache when submitting? It posts faster w/o and if you do not need it, why bother?
jrennstich
on 28 May 2021
In a later release I'll start zipping the logs -- they should compress very heavily. But right now, I don't need the cache, and I only need one run from a non-full cache, as I should see cache-filling happening.
Something is making changes to your library:
(3)(+0000003): Notifier.trigger('add', 'item', [48440], {"skipSelect":true}) added to queue M4uWJhQL
(3)(+0000001): Notifier.trigger('add', 'item-tag', [48440-331], {"48440-331":{"libraryID":1,"tag":"digital","type":0}}) added to queue M4uWJhQL
(3)(+0000000): Notifier.trigger('add', 'item-tag', [48440-1626], {"48440-1626":{"libraryID":1,"tag":"emotion","type":0}}) added to queue M4uWJhQL
(3)(+0000001): Notifier.trigger('add', 'item-tag', [48440-383], {"48440-383":{"libraryID":1,"tag":"ethics","type":0}}) added to queue M4uWJhQL
(3)(+0000000): Notifier.trigger('add', 'item-tag', [48440-823], {"48440-823":{"libraryID":1,"tag":"robotics","type":0}}) added to queue M4uWJhQL
(3)(+0000001): Notifier.trigger('add', 'item-tag', [48440-923], {"48440-923":{"libraryID":1,"tag":"technology","type":0}}) added to queue M4uWJhQL
(3)(+0000001): Notifier.trigger('add', 'item', [48440], {"48440":{"skipSelect":true},"skipAutoSync":true}) called [observers: 22]
    Zotero.Notifier</this.trigger<@chrome://zotero/content/xpcom/notifier.js:140:38
(3)(+0000005): Notifier.trigger('add', 'item-tag', [48440-331,48440-1626,48440-383,48440-823,48440-923], {"skipAutoSync":true,"48440-331":{"libraryID":1,"tag":"digital","type":0},"48440-1626":{"libraryID":1,"tag":"emotion","type":0},"48440-383":{"libraryID":1,"tag":"ethics","type":0},"48440-823":{"libraryID":1,"tag":"robotics","type":0},"48440-923":{"libraryID":1,"tag":"technology","type":0}}) called [observers: 4]
(3)(+0000001): Notifier.trigger('add', 'item', [48441], {"skipSelect":true}) added to queue AHD5f2GW
(3)(+0000001): Notifier.trigger('add', 'item-tag', [48441-12264], {"48441-12264":{"libraryID":1,"tag":"categorizing","type":0}}) added to queue AHD5f2GW
(3)(+0000000): Notifier.trigger('add', 'item-tag', [48441-275], {"48441-275":{"libraryID":1,"tag":"comparative","type":0}}) added to queue AHD5f2GW
(3)(+0000000): Notifier.trigger('add', 'item-tag', [48441-8075], {"48441-8075":{"libraryID":1,"tag":"comparison","type":0}}) added to queue AHD5f2GW
(3)(+0000002): Notifier.trigger('add', 'item-tag', [48441-635], {"48441-635":{"libraryID":1,"tag":"methodology","type":0}}) added to queue AHD5f2GW
(3)(+0000000): Notifier.trigger('add', 'item-tag', [48441-7778], {"48441-7778":{"libraryID":1,"tag":"observation","type":0}}) added to queue AHD5f2GW
(3)(+0000001): Notifier.trigger('add', 'item-tag', [48441-701], {"48441-701":{"libraryID":1,"tag":"observational","type":0}}) added to queue AHD5f2GW
(3)(+0000000): Notifier.trigger('add', 'item-tag', [48441-794], {"48441-794":{"libraryID":1,"tag":"qualitative","type":0}}) added to queue AHD5f2GW
(3)(+0000000): Notifier.trigger('add', 'item-tag', [48441-795], {"48441-795":{"libraryID":1,"tag":"quantitative","type":0}}) added to queue AHD5f2GW
(3)(+0000000): Notifier.trigger('add', 'item', [48441], {"48441":{"skipSelect":true},"skipAutoSync":true}) called [observers: 22]
    Zotero.Notifier</this.trigger<@chrome://zotero/content/xpcom/notifier.js:140:38
(3)(+0000006): Notifier.trigger('add', 'item-tag', [48441-12264,48441-275,48441-8075,48441-635,48441-7778,48441-701,48441-794,48441-795], {"skipAutoSync":true,"48441-12264":{"libraryID":1,"tag":"categorizing","type":0},"48441-275":{"libraryID":1,"tag":"comparative","type":0},"48441-8075":{"libraryID":1,"tag":"comparison","type":0},"48441-635":{"libraryID":1,"tag":"methodology","type":0},"48441-7778":{"libraryID":1,"tag":"observation","type":0},"48441-701":{"libraryID":1,"tag":"observational","type":0},"48441-794":{"libraryID":1,"tag":"qualitative","type":0},"48441-795":{"libraryID":1,"tag":"quantitative","type":0}}) called [observers: 4]
(3)(+0000001): Notifier.trigger('add', 'item', [48442], {"skipSelect":true}) added to queue AKOYFWPr
(3)(+0000003): Notifier.trigger('modify', 'item', [48440], {}) added to queue AKOYFWPr
(3)(+0000001): Notifier.trigger('add', 'item', [48442], {"48442":{"skipSelect":true},"skipAutoSync":true}) called [observers: 22]
    Zotero.Notifier</this.trigger<@chrome://zotero/content/xpcom/notifier.js:140:38
(3)(+0000001): Notifier.trigger('modify', 'item', [48440], {"48440":{},"skipAutoSync":true}) called [observers: 22]
(3)(+0000001): Notifier.trigger('add', 'item', [48443], {"skipSelect":true}) added to queue aIVZBJRN
(3)(+0000001): Notifier.trigger('modify', 'item', [48441], {}) added to queue aIVZBJRN
(3)(+0000001): Notifier.trigger('add', 'item', [48443], {"48443":{"skipSelect":true},"skipAutoSync":true}) called [observers: 22]
    Zotero.Notifier</this.trigger<@chrome://zotero/content/xpcom/notifier.js:140:38
(3)(+0000001): Notifier.trigger('modify', 'item', [48441], {"48441":{},"skipAutoSync":true}) called [observers: 22]
and that's triggering repeated auto-exports of your main library. I don't yet know how that would affect cache filling though, but it is something that stands out.
retorquere
on 28 May 2021
Never mind, that's not export being kicked off. You have auto-export off, and what I thought were auto-exports was just the resetting of the progress to 0%.
retorquere
on 28 May 2021
So, actually the opposite is true. I so no export being started in 4ECS8DCE-euc, so I wouldn't expect to see cache activity.
retorquere
on 28 May 2021
:robot: this is your friendly neighborhood build bot announcing test build 5.4.20.998 ("Merge branch 'master' into gh-1811")
Install in Zotero by downloading test build 5.4.20.998, opening the Zotero "Tools" menu, selecting "Add-ons", open the gear menu in the top right, and select "Install Add-on From File...".
github-actions[bot]
on 31 May 2021
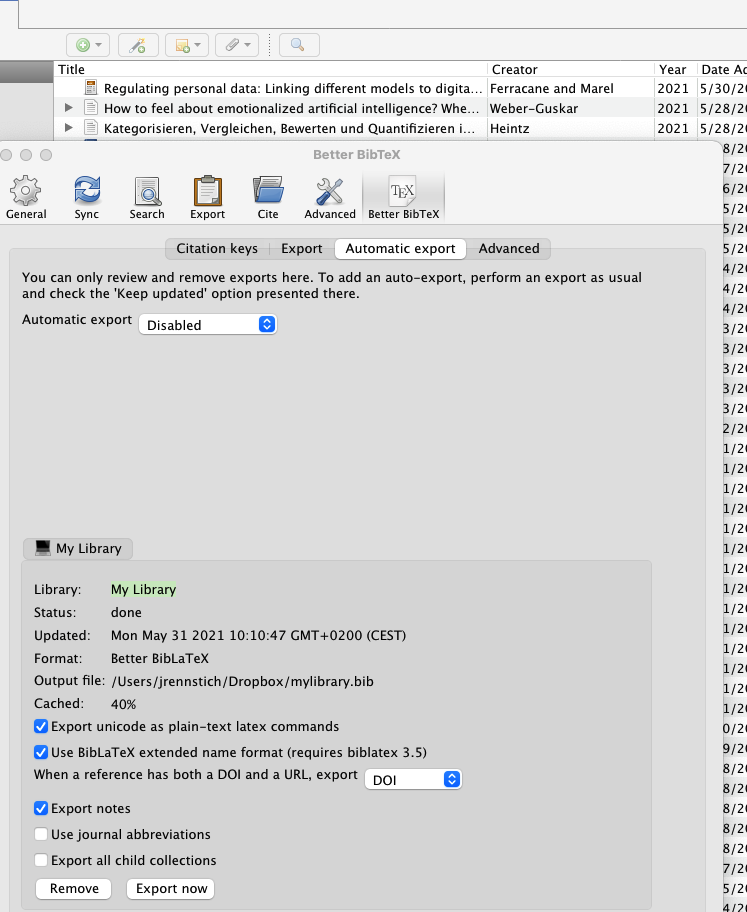
Is this new UI item related to the cache?

jrennstich
on 31 May 2021
Loosely -- it shows the progress of the running export, but it should disappear when the export is done. Apparently it doesn't for everyone, I'm addressing that in #1831, but it looks like this also affects you.
retorquere
on 31 May 2021
No change, except for the blue progress bar, that indicates "done" now, even with a cache of 40%.
Support log ID: YAKPUV8Q-euc
jrennstich
on 31 May 2021
:robot: this is your friendly neighborhood build bot announcing test build 5.4.20.1001 ("more logging")
Install in Zotero by downloading test build 5.4.20.1001, opening the Zotero "Tools" menu, selecting "Add-ons", open the gear menu in the top right, and select "Install Add-on From File...".
github-actions[bot]
on 31 May 2021
No change, it seems, but the progress bar works as it should.
Support log ID: EA32LJMC-euc
jrennstich
on 31 May 2021
:robot: this is your friendly neighborhood build bot announcing test build 5.4.20.1002 ("more logging")
Install in Zotero by downloading test build 5.4.20.1002, opening the Zotero "Tools" menu, selecting "Add-ons", open the gear menu in the top right, and select "Install Add-on From File...".
github-actions[bot]
on 31 May 2021
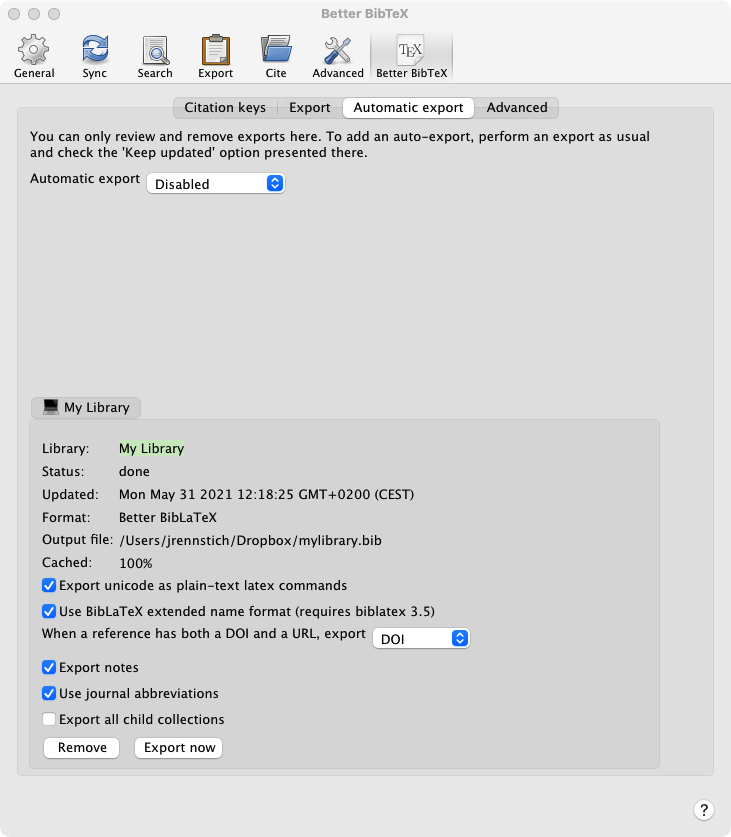
Shows 100 percent cache. In super duper mega speed time. Not sure what happened there.
Support Log ID: JSWIMRLM-euc
jrennstich
on 31 May 2021
Ran it again, same thing happened. It shows "105%" in the Status line for a short time, then it reverts back to 100%.
jrennstich
on 31 May 2021
:robot: this is your friendly neighborhood build bot announcing test build 5.4.20.1004 ("no overshoot [fast-test]")
Install in Zotero by downloading test build 5.4.20.1004, opening the Zotero "Tools" menu, selecting "Add-ons", open the gear menu in the top right, and select "Install Add-on From File...".
github-actions[bot]
on 31 May 2021
Can you install 1004, drop the cache, and try again twice (once to fill the cache, which should hit 100%, and one to test the cache)
retorquere
on 31 May 2021
how do I drop the cache?
jrennstich
on 31 May 2021
BBT prefs, advanced.
retorquere
on 31 May 2021
Some weird behavior. First it wouldn't go beyond preparing 100% (also in the progress bar). Then I clicked Export now again. Same. Then again. This brought up Status 100%, Cache 100%. Clicked again, that showed the 105%. Now it's showing "done". Here's the log
SE3W8ZMN-euc
jrennstich
on 31 May 2021
To debug the cache fill I need debug logging to be on from the start, so when installing a new version, you should not click "restart now" in the addons window, but "restart with logging enabled" from the help menu. You couldn't have know that, sorry.
retorquere
on 31 May 2021
the 105% is really strange. I cap output to 100.
retorquere
on 31 May 2021
ah, will try again, after this lecture
jrennstich
on 31 May 2021
i meant the lecture I am giving right now :-)
jrennstich
on 31 May 2021
Understood -- I had no plans to lecture you about your test participation :D.
retorquere
on 31 May 2021
To debug the cache fill I need debug logging to be on from the start, so when installing a new version, you should _not_ click "restart now" in the addons window, but "restart with logging enabled" from the help menu. You couldn't have know that, sorry.
That's what I tried with the first debug log. The problem is, it doesn't seem to have an effect when I click on
BBT > Advanced > Export > Reset cache
in the sense that it still shows 100 percent. When I do run the export again, its shows status "preparation 100%" for a rather long time (I assume that means it's creating the cache?), then goes on to export. That's at least what it seems to be doing:
Log ID (w cache): WW2S2KVQ-euc
jrennstich
on 31 May 2021
That's what I tried with the first debug log. The problem is, it doesn't seem to have an effect when I click on
BBT > Advanced > Export > Reset cache
That does actually drop the cache but didn't update the UI. A fix for that is rolling in.
When I do run the export again, its shows status "preparation 100%" for a rather long time (I assume that means it's creating the cache?),
Sort of, but even with 1004, the cache rate in the UI should have dropped to zero and climbed from there.
What's happening in the prep phase is that I'm asking Zotero for ready-to-be-exported items (aka serialized items) which I can then pass on to the background exporter. The results of this phase are cached too, so subsequent preps should be faster.
That's what I tried with the first debug log.
Are you sure you restarted through help => debug output => restart with logging enabled? I have a user on #1831 where the logs similarly indicate Zotero wasn't restarted this way before generating the log, but if this is what both of you have in the logs, maybe my logs are just wrong.
retorquere
on 31 May 2021
:robot: this is your friendly neighborhood build bot announcing test build 5.4.20.1011 ("reset cacherate to 0 when dropping the cache [fast-test]")
Install in Zotero by downloading test build 5.4.20.1011, opening the Zotero "Tools" menu, selecting "Add-ons", open the gear menu in the top right, and select "Install Add-on From File...".
github-actions[bot]
on 31 May 2021
Related issues
 floriandierickx
·
5Comments
floriandierickx
·
5Comments
 visini
·
4Comments
visini
·
4Comments
 SunHaozhe
·
3Comments
SunHaozhe
·
3Comments
 zoushucai
·
4Comments
zoushucai
·
4Comments
 aleimba
·
6Comments
aleimba
·
6Comments