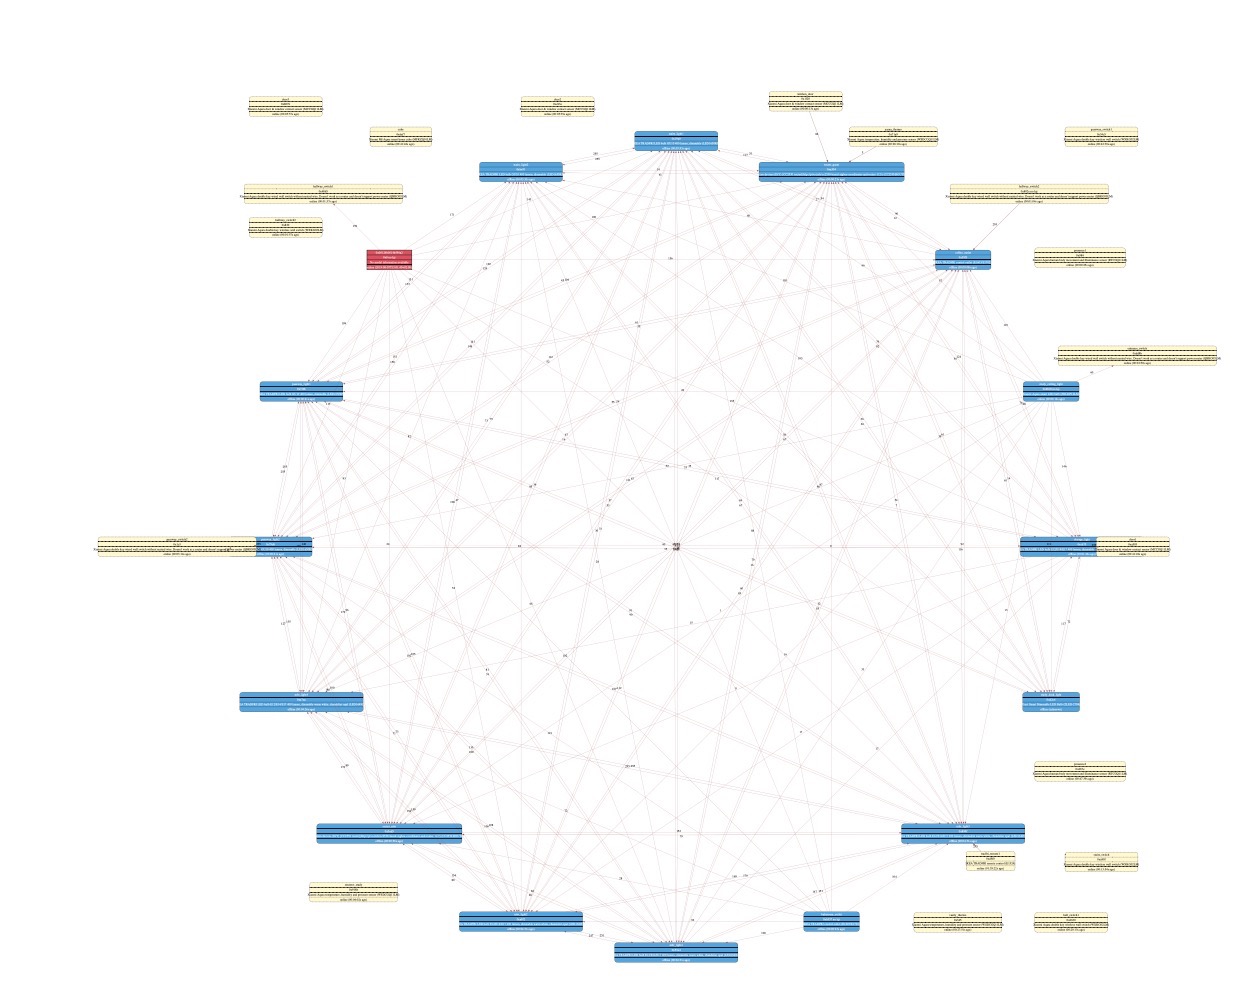
Hm. It all nice to have detailed map. But can we have also option to have simple map based on how routing is working actually? Like in IObroker.
Once you have more than 10 devices, current map becoming rather something of entomological interest, or visual attraction, rather something informative.
Unless you found that this is useful:
I'd rather prefer to see something like this:

At least this shows me clearly how devices are communicate.
Keep in mind, that number of devices are comparable on both maps. One from iobroker you can read and understand. And one from z2m.....
 antst
antst
All 13 comments
We could map the model with the devices images, also use all description is to long, like this:
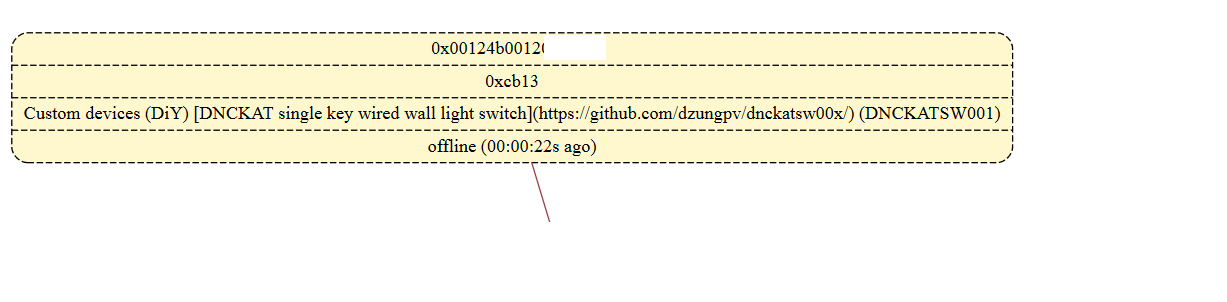
So i prefer short model only instead of long description
 dzungpv
on 10 Aug 2019
dzungpv
on 10 Aug 2019
It is not about images. It is about links ) It is just impossible to read picture from map above. Very non-informative. And because of number of links, and all those numbers, it is often impossible to detect which numbers corresponds to which link. And I can't imagine how this looks with 100 devices. And don't want to! )
antst
on 10 Aug 2019
In that IOBroker diagram is it just one view of routes from leaf nodes to the coordinator?
Otherwise that pink bulb is a pretty big single point of failure...
I would assume that the coordinator also has routes to the other routers, and hence end devices (or what is the point of a mesh network?)
 james-fry
on 24 Aug 2019
james-fry
on 24 Aug 2019
Yes, it does, but it doesn't plot all of them. Only most likely routes.
As with number of nodes, number of links goes as squared. So, with size of mesh it is less and less meaningful information, as you clearly can see on my plot. I might have all possible links, indeed. But value of this plot is negligibly different from zero. And can you imagine such map for 100 devices with 9900 lines?
antst
on 3 Sep 2019
Thanks for the explanation. Agree that every link to from every router to every other router is not always useful...
How does the plotting code determine what are
Only most likely routes.
?
Just from link quality?
What I was thinking about is for the diagram to be dynamically re-plotted in the context of a selected device - ie. as each device is clicked the diagram replots for that device.
In your image the pink bulk looks to be the selected device and shows all links from that device.
james-fry
on 3 Sep 2019
I don't know how it is plotted in IOB, to be honest. But I suspect by using link quality, indeed.
Dynamic plot can be an option also, for sure.
antst
on 3 Sep 2019
This is animated gif with how map looks like in IOB. To my taste, it is nearly perfect )
Pay attention that when you select device, it shows all links for this device, otherwise most probable one
antst
on 3 Sep 2019
I really like that it displys routes and lq in context when clicking on a device
james-fry
on 5 Sep 2019
instead of using Z2M to generate complex graphviz data, it would be easier to handle this with an external tool that generates the themed graphviz or png or svg or whatever (html+css+js)
 lolorc
on 5 Sep 2019
lolorc
on 5 Sep 2019
@carldebilly Is this a potential roadmap item for zigbee2mqtt assistant?
james-fry
on 5 Sep 2019
It is already on the roadmap! 😁
 carldebilly
on 5 Sep 2019
carldebilly
on 5 Sep 2019
This issue has been automatically marked as stale because it has not had recent activity. It will be closed if no further activity occurs. Thank you for your contributions.
![stale[bot] picture](https://avatars3.githubusercontent.com/in/1724?v=4&s=40) stale[bot]
on 4 Nov 2019
stale[bot]
on 4 Nov 2019
I started playing around with the map view, I didn't come up with anything much better ...
Current map view (This is with routes included)...

Routes only view, though I messed up EndDevices :)
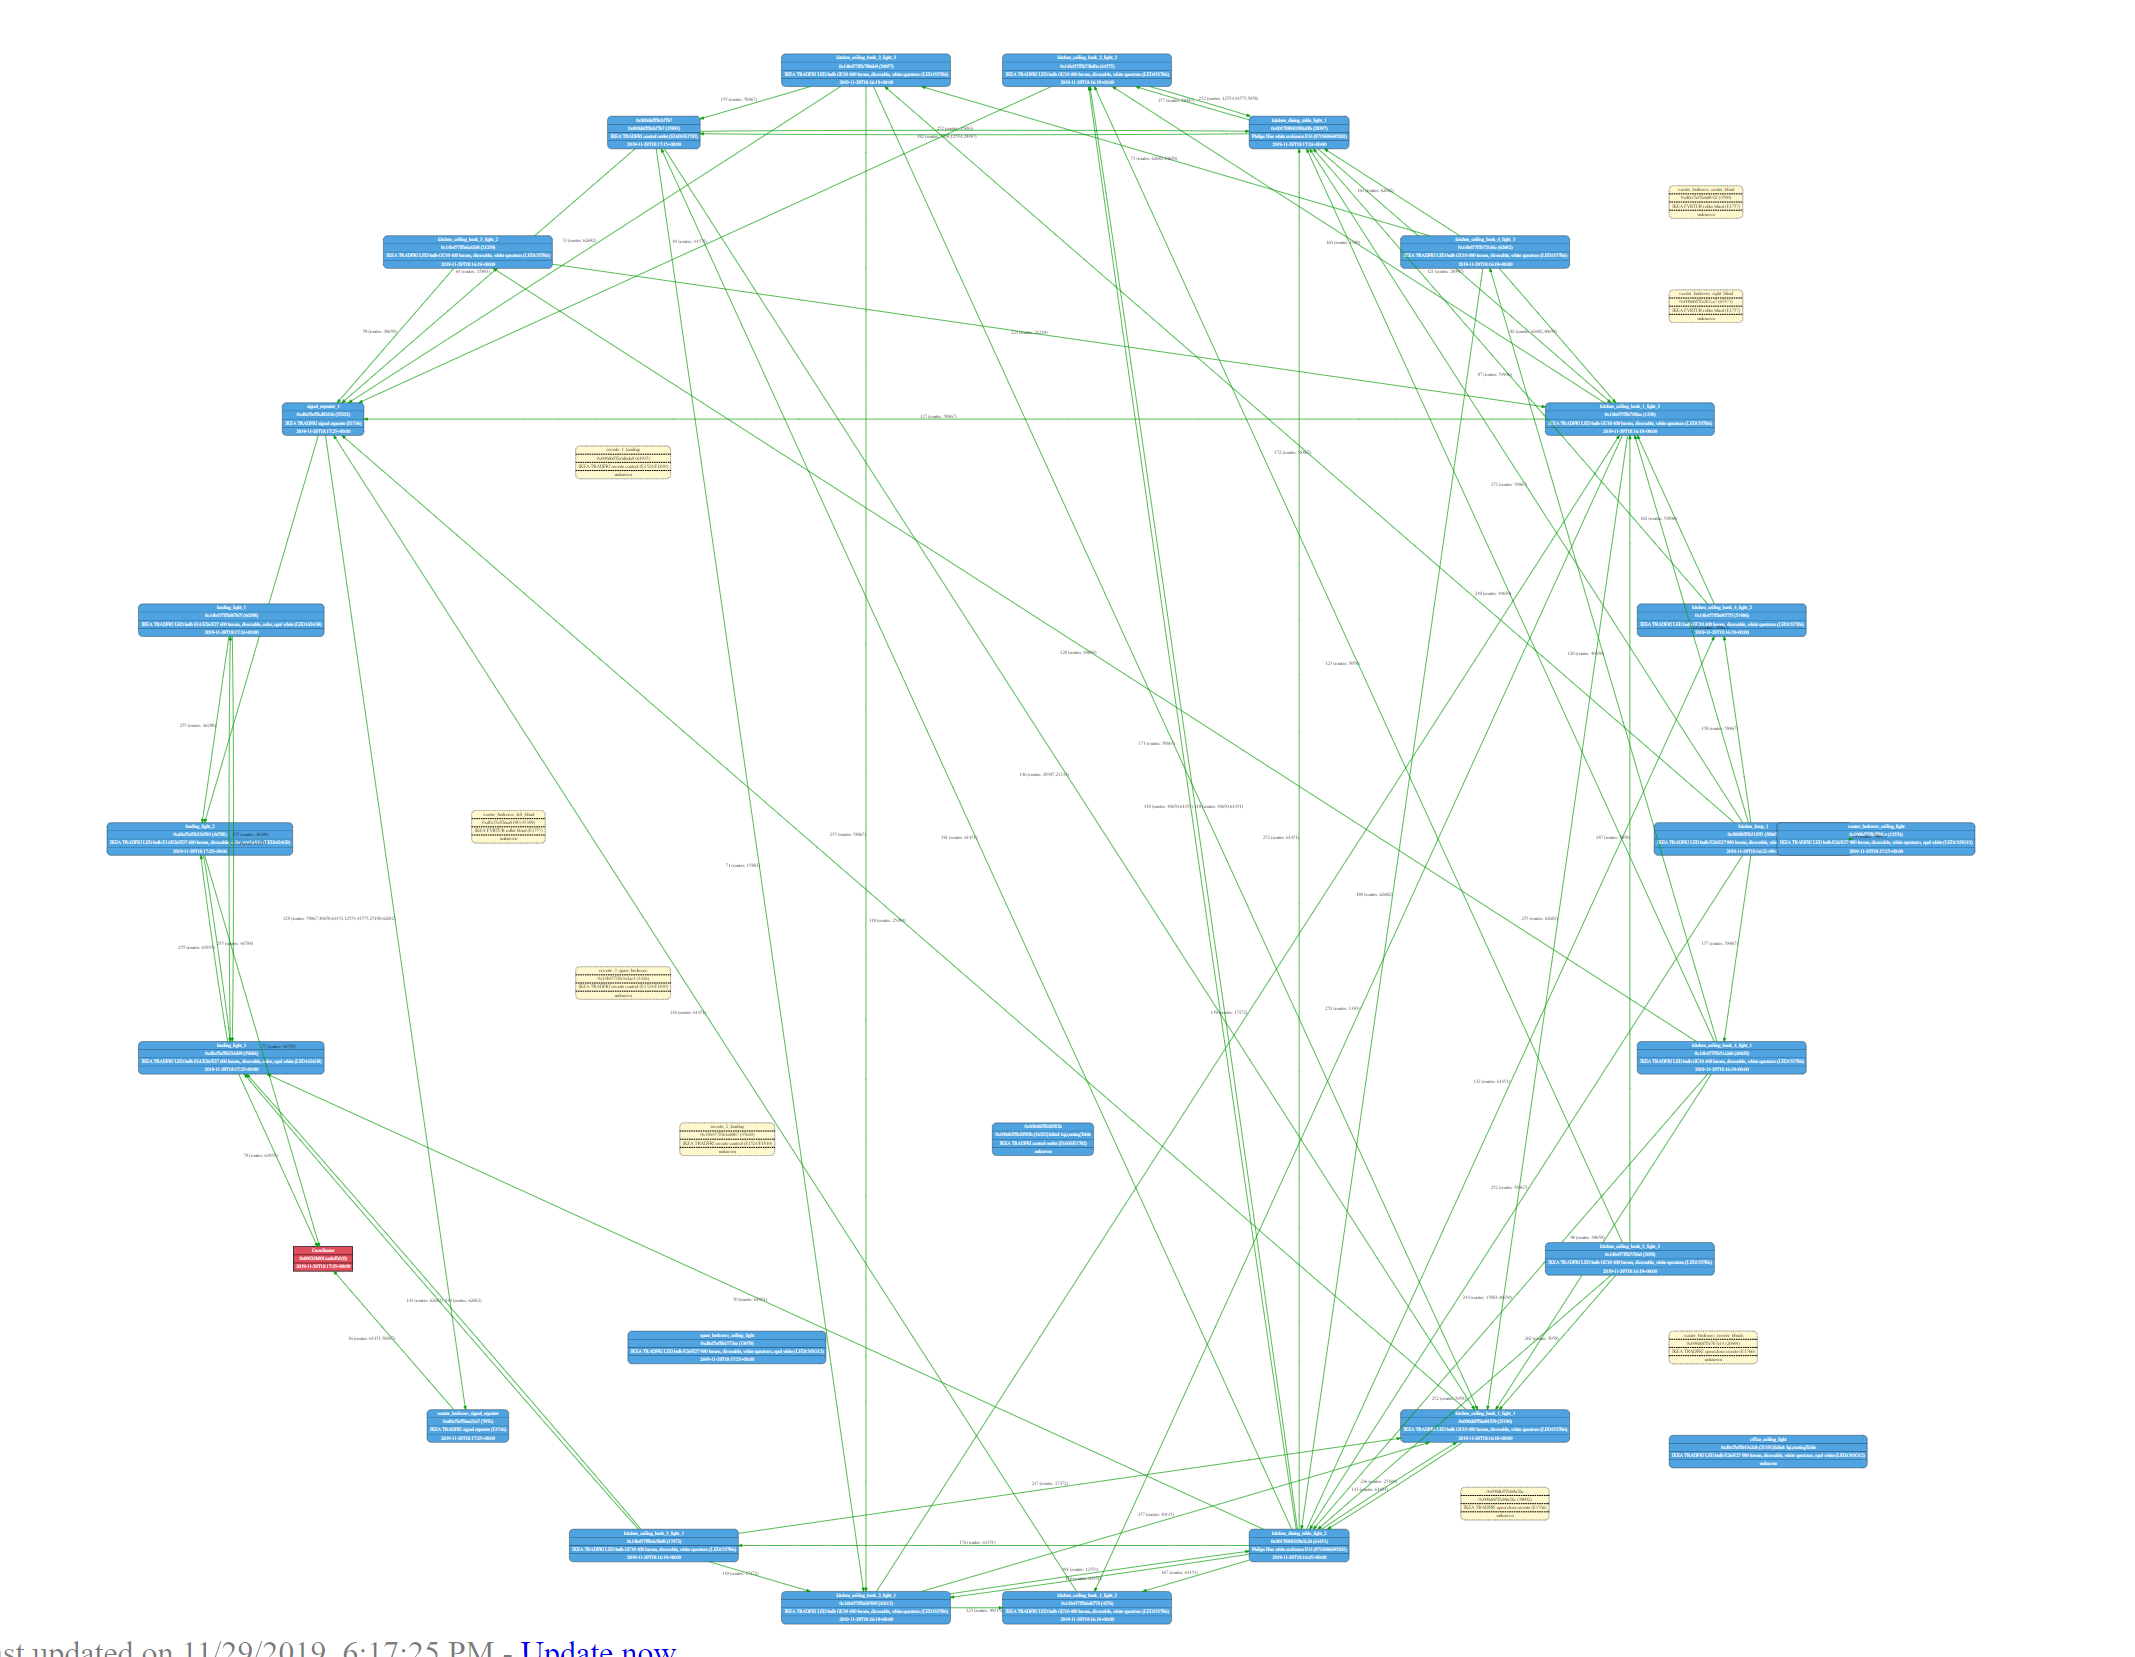
Routes only view, fixed EndDevices and used the dot "engine" instead of circo.
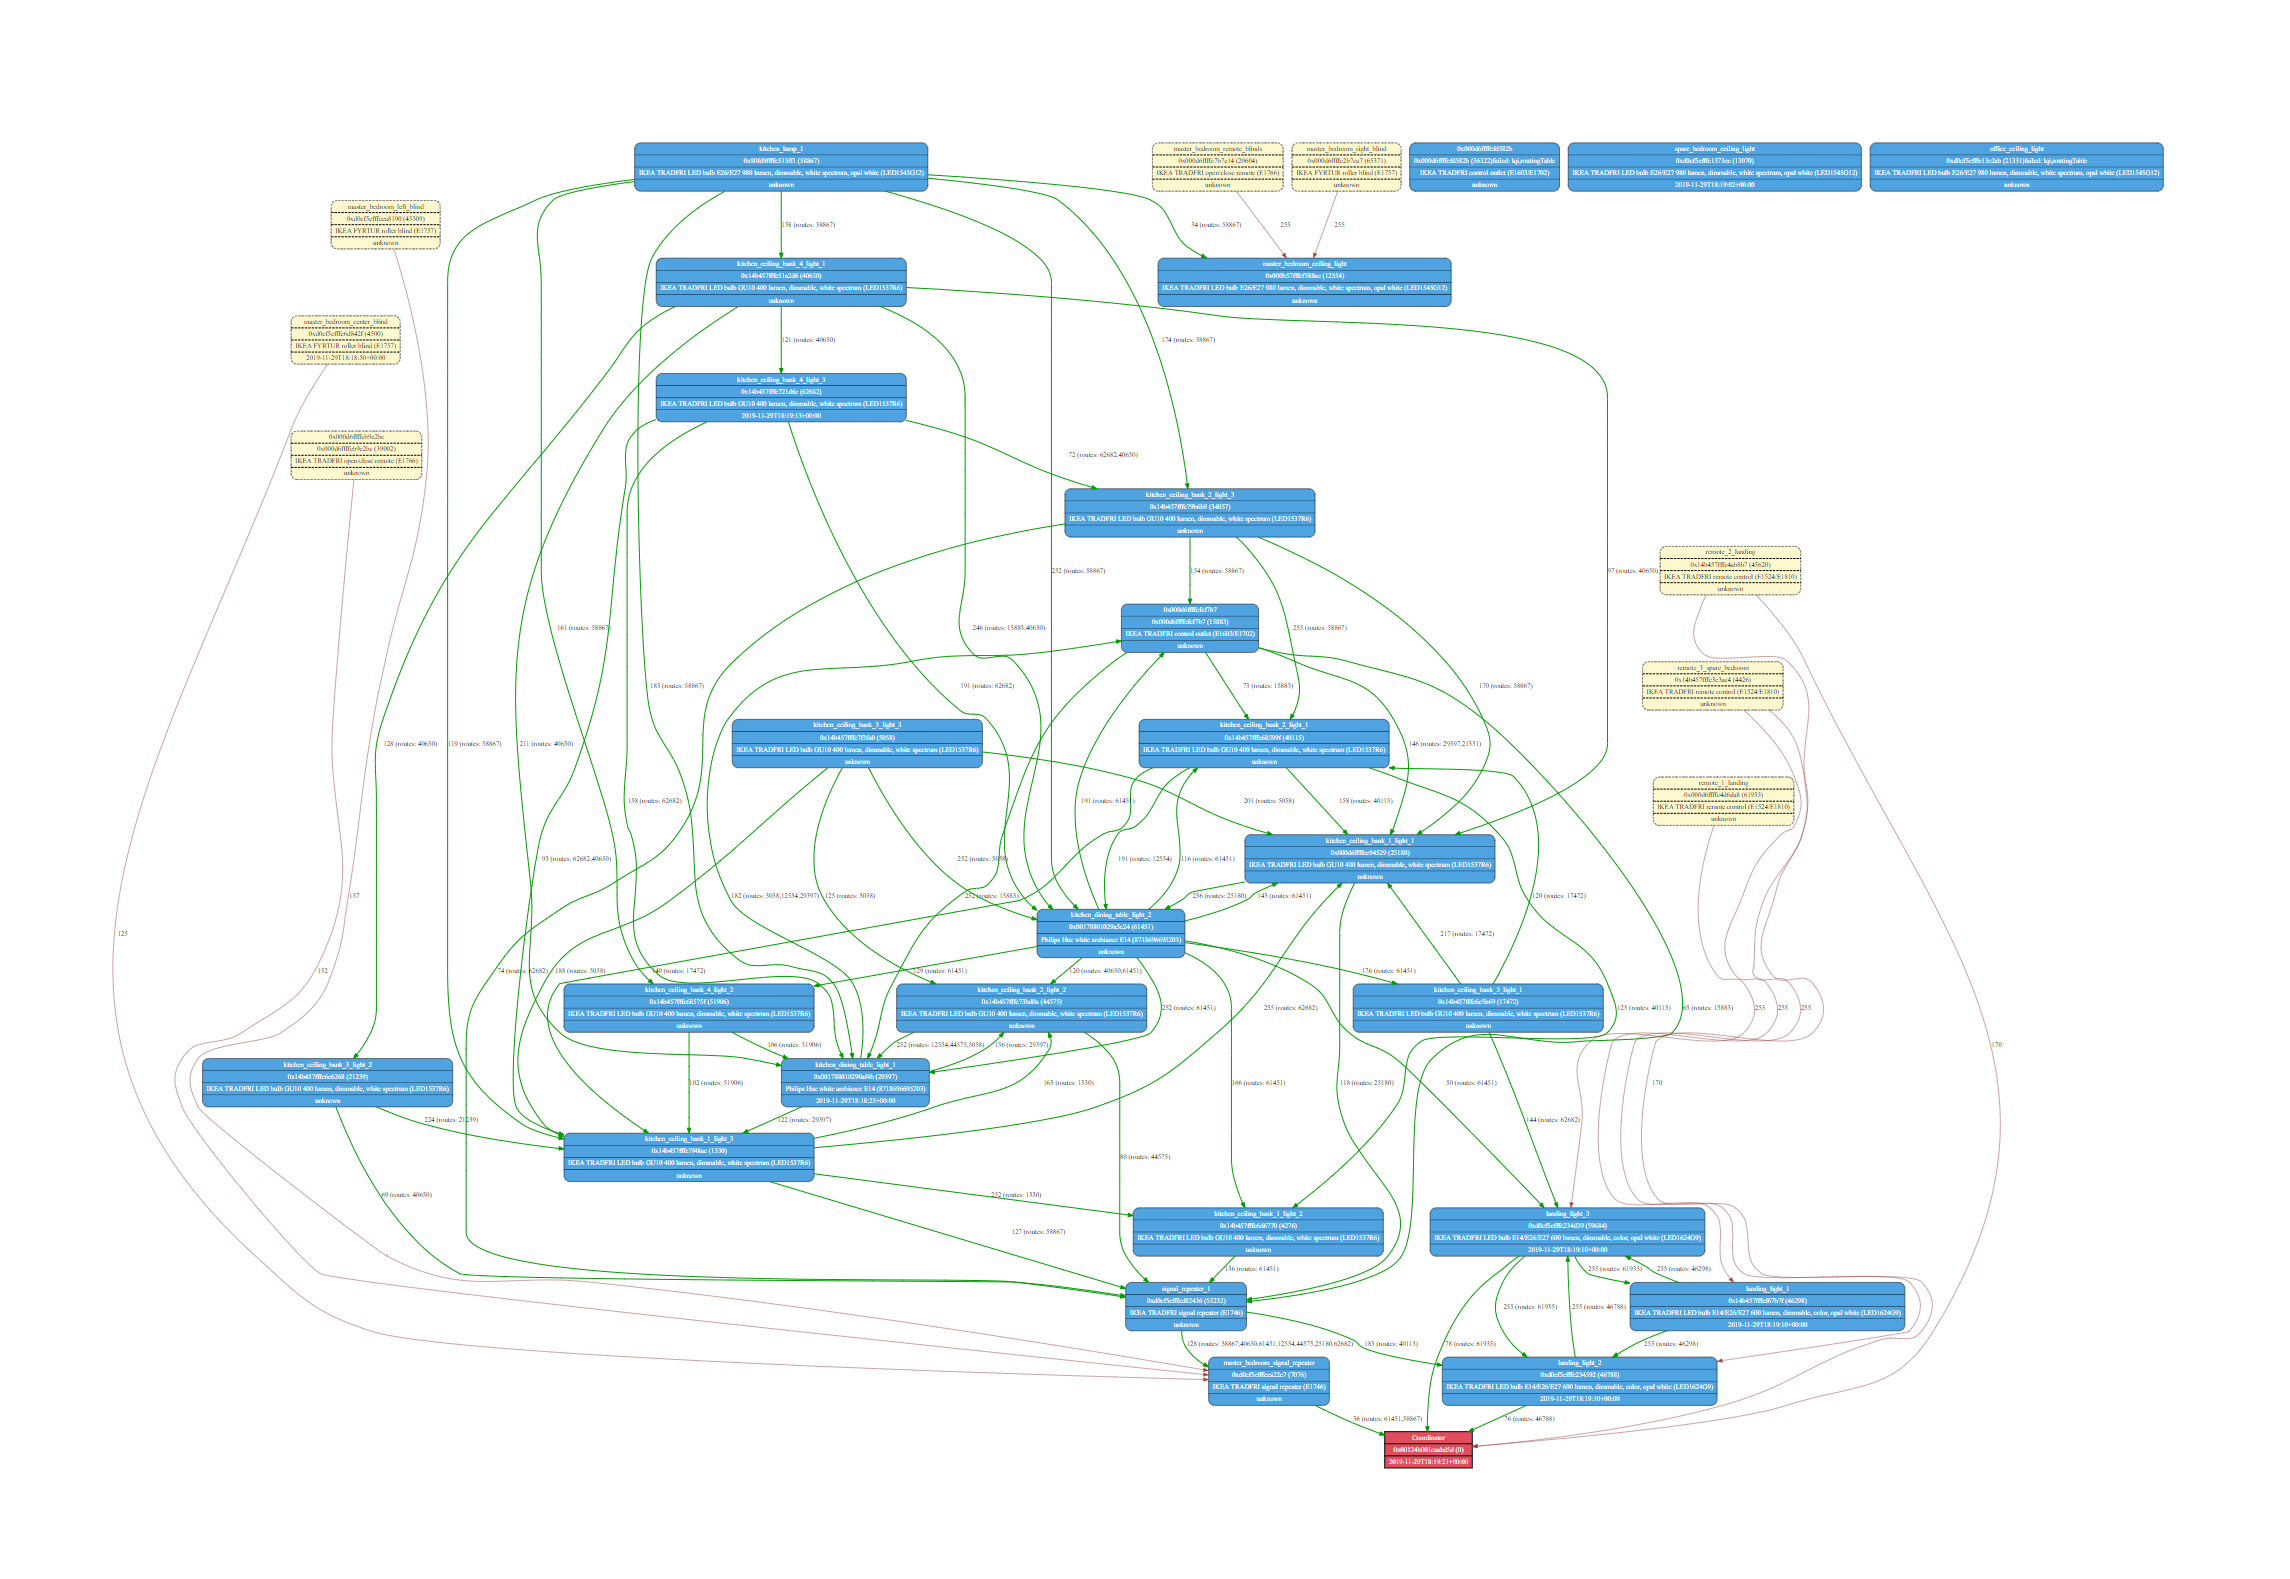
 kiall
on 29 Nov 2019
kiall
on 29 Nov 2019
Related issues
 tb-killa
·
3Comments
tb-killa
·
3Comments
 ophilips
·
4Comments
ophilips
·
4Comments
 Underknowledge
·
4Comments
Underknowledge
·
4Comments
 Courty40
·
4Comments
Courty40
·
4Comments
 mpuff
·
4Comments
mpuff
·
4Comments