Yuzu: Memory leakage in Pokémon Let's Go Eevee
Game: Pokémon Let's Go Eevee
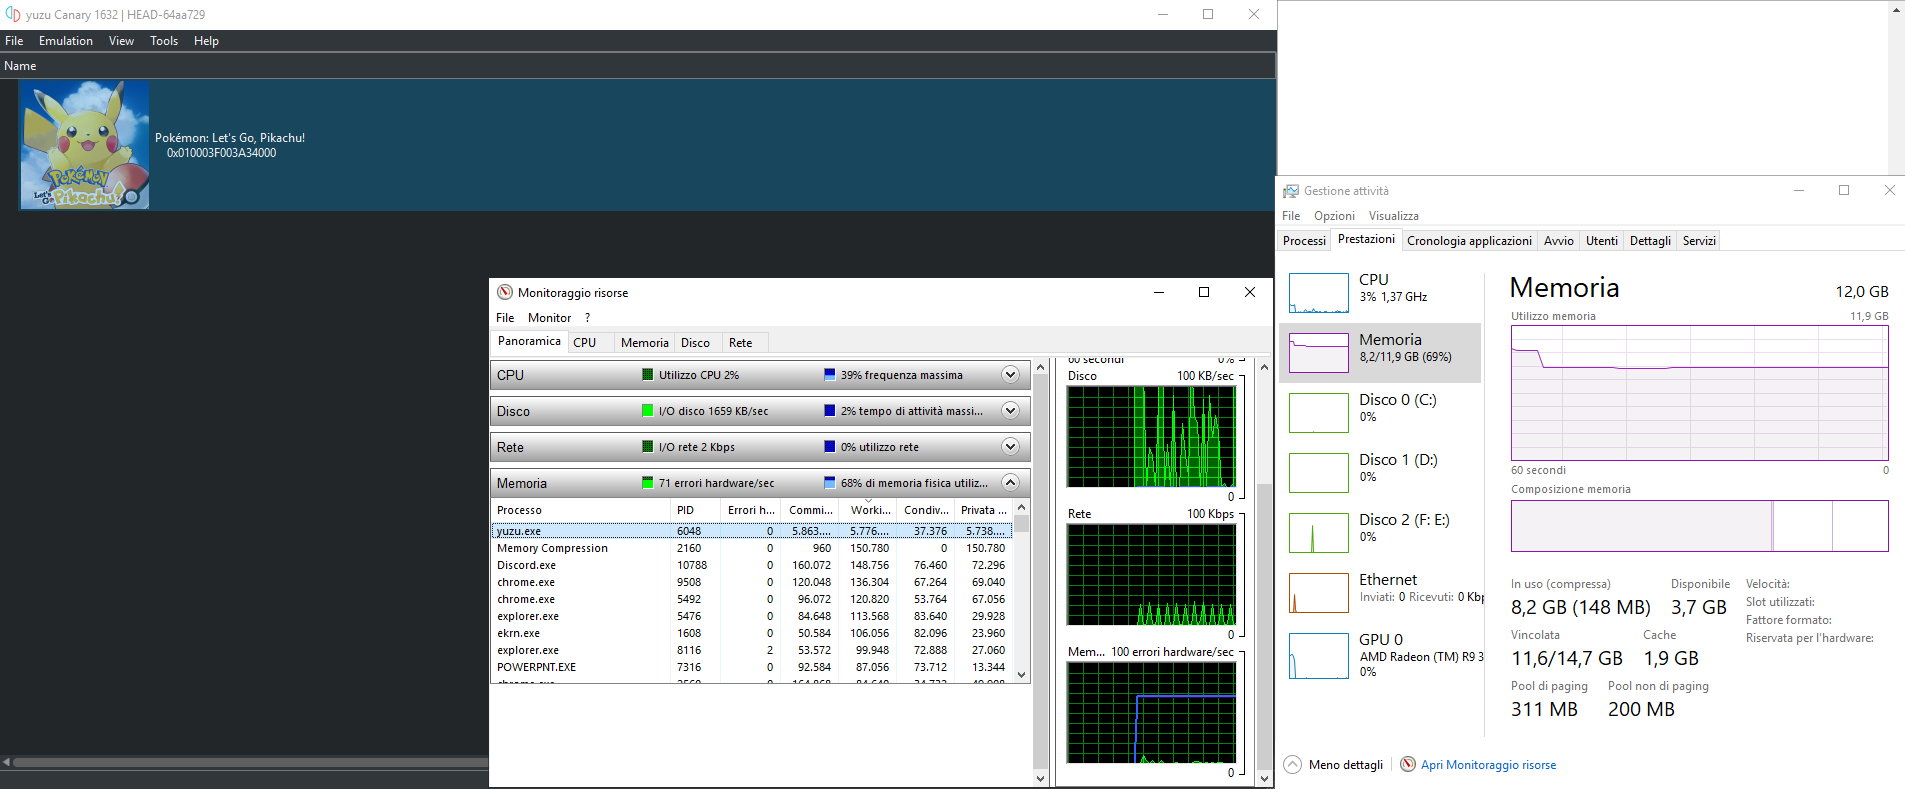
Yuzu consumes 9 GB of RAM when the game is started.
It jumps to 11 GB shortly after the save has been loaded.
From there, it slowly rises the amount of used RAM until it completely fills the available space.
The probably to have a soft lock in the game increases drastically at that time; especially if you _switch_ to another program and come back to Yuzu.
Soft locks don't free RAM.
You can see all the steps in the graphics. Max is 15242 MB.

System specifications
- Intel Core i3 6100 @ 3.7 GHz
- Gigabyte Aorus RX 570 4 GB
- 16 GB DDR4
- BioStar TB250-BTC motherboard
Yuzu version
- Yuzu Canary 1572 (54fe4df)
 DarthJahus
All 16 comments
Renamed the issue to reflect more on the issue's description.
 GDhex12
on 22 Nov 2018
GDhex12
on 22 Nov 2018
@Hexagon12 memory consumption isn't necessarily memory leak
 wwylele
on 22 Nov 2018
wwylele
on 22 Nov 2018
@wwylele In this case, we already know that this issue is specifically a memory leak and not just some random "consumption".
GDhex12
on 22 Nov 2018
@Hexagon12 could you give some more explanation? Because I don't see how I can already know it is leak
wwylele
on 22 Nov 2018
" This is a actual issue. Yuzu might have actual memory leaks and no one reported this issue on GitHub before."
@Hexagon12 is reported since July this problem!
 Luffykun007
on 22 Nov 2018
Luffykun007
on 22 Nov 2018
Still happening on Canary 1613 with both Pokemon: Let's Go, Eevee and Pokemon: Let's Go, Pikachu though my report might also contain a separate issue.
yuzu eats more and more ram until the game eventually hangs:

^ The memory leak.
After running the game twice yuzu looks like this:

Note that emulation has stopped but yuzu is still using 10 Gigs of RAM.
Closing the game before a hang still results in yuzu not releasing any memory.
Other games release memory properly after stopping emulation.
The only changes I've made to the default settings are disabling single window mode and enabling docked joycons.
 kevinvanrijn
on 25 Nov 2018
kevinvanrijn
on 25 Nov 2018
Same issue, and also 1 single core to 100% and the other near 0%
CPU: i7-6700 @ 3.9Ghz
RAM: 12GB 2666Mhz
GPU: AMD r9 390 OC

 FlashMau5
on 27 Nov 2018
FlashMau5
on 27 Nov 2018
I was also able to repro this with Canary 1632 | HEAD-64aa729.
OS: Windows 10
CPU: i7-7700HQ @ 2.80 GHz (base clock)
RAM: 16 GB
GPU: Nvidia GeForce GTX 1050
Compiler Version: MSVC
Curiously, this does not happen on the precompiled MinGW version. So that would lead me to believe it's an MSVC specific issue. I'd attach Valgrind but sadly there's no Windows version.
What's perplexing is that this particular ROM causes the issue, so it's most likely not related to memory management per se. However, C++ memory management in general tends to be pretty 🤢. I'll dig a bit deeper into the source and report back if I've found anything.
 Yarou
on 28 Nov 2018
Yarou
on 28 Nov 2018
I was also able to repro this with
Canary 1632 | HEAD-64aa729.
OS: Windows 10
CPU: i7-7700HQ @ 2.80 GHz (base clock)
RAM: 16 GB
GPU: Nvidia GeForce GTX 1050
Compiler Version: MSVCCuriously, this does not happen on the precompiled MinGW version. So that would lead me to believe it's an MSVC specific issue. I'd attach Valgrind but sadly there's no Windows version.
What's perplexing is that this particular ROM causes the issue, so it's _most likely_ not related to memory management per se. However, C++ memory management in general tends to be pretty 🤢. I'll dig a bit deeper into the source and report back if I've found anything.
Hi there i have tried several roms and have even ripped the rom my self and still have this issue
 burakbir
on 9 Dec 2018
burakbir
on 9 Dec 2018
It really doesn't matter where you get the ROM.
The issue is in the emulator itself.
 EtK2000
on 10 Dec 2018
EtK2000
on 10 Dec 2018
Is this issue fixed in the latest Canary builds?
GDhex12
on 16 Dec 2018
Testing on Canary 1711. No overwhelming RAM usage and the curve is pretty consistent after around 20 into the game.
Thank you for your work!
DarthJahus
on 16 Dec 2018
Fixed by #1890 + #1901.
GDhex12
on 16 Dec 2018
My tests with Canary 1725 show that the continous memory increase during runtime is caused by caching the OpenGL surface buffers in RasterizerCacheOpenGL::surface_reserve map. The cache entries are never freed, so this can easily grow by gigabytes in a few minutes, depending on how much new content is displayed.
Not sure if this unbounded cache is by design or if there is some underlying bug.
 jschmer
on 16 Dec 2018
jschmer
on 16 Dec 2018
Currently using Canary build 5cadd46 for windows and can confirm that the use of memory steadily rises until the game stops working.
Seems that every time you change screen (enter a building or a new route) the ram usage kicks up a notch (100 to 300MB)
running on Windows 7
CPU: i5-6500 3.20GHz
ram 16GB
GPU: Nvidia GeForce GTX 950
 Atraxian
on 16 Mar 2019
Atraxian
on 16 Mar 2019
Looks like the OpenGL surface buffer caching issue was fixed between Canary 2205 and 2235. I no longer see unbounded memory usage.
jschmer
on 4 May 2019
Related issues
 igorquintaes
·
6Comments
igorquintaes
·
6Comments
 spotanjo3
·
3Comments
spotanjo3
·
3Comments
 JoseGuzmanHN
·
3Comments
JoseGuzmanHN
·
3Comments
 CptFoda-se
·
3Comments
CptFoda-se
·
3Comments
 FranciscoReMo
·
4Comments
FranciscoReMo
·
4Comments
Most helpful comment
I was also able to repro this with
Canary 1632 | HEAD-64aa729.OS: Windows 10
CPU: i7-7700HQ @ 2.80 GHz (base clock)
RAM: 16 GB
GPU: Nvidia GeForce GTX 1050
Compiler Version: MSVC
Curiously, this does not happen on the precompiled MinGW version. So that would lead me to believe it's an MSVC specific issue. I'd attach Valgrind but sadly there's no Windows version.
What's perplexing is that this particular ROM causes the issue, so it's most likely not related to memory management per se. However, C++ memory management in general tends to be pretty 🤢. I'll dig a bit deeper into the source and report back if I've found anything.