Yolov5: Training and validation accuracy and loss from result and graph
❔Question
Sir,
- I wanted to know which are the training accuracy and validation accuracy
and also training loss and validation loss in the results.txt?
- How can I plot the training and validation accuracy in a single graph
and training and validation loss in another graph?
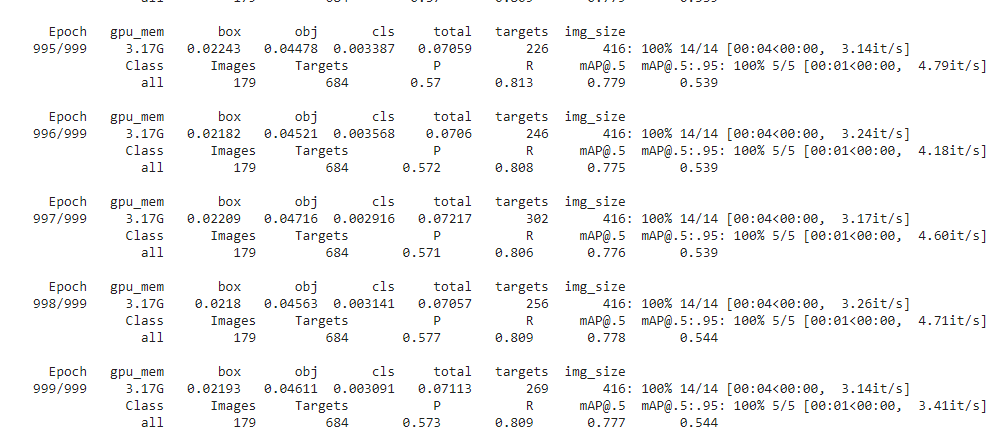
Here is the result
Please it would be really helpful.
Thank You
Additional context
 John12Reaper
All 11 comments
@John12Reaper accuracy is a classification metric. YOLOv5 does object detection. The metrics available are displayed to screen, saved to results.txt, plotted to results.png after training completion and logged to Tensorboard.
Suggest you start with the custom training tutorial, where all of this is explained.
https://github.com/ultralytics/yolov5/wiki/Train-Custom-Data
 glenn-jocher
on 30 Oct 2020
glenn-jocher
on 30 Oct 2020
@John12Reaper this explains the difference:
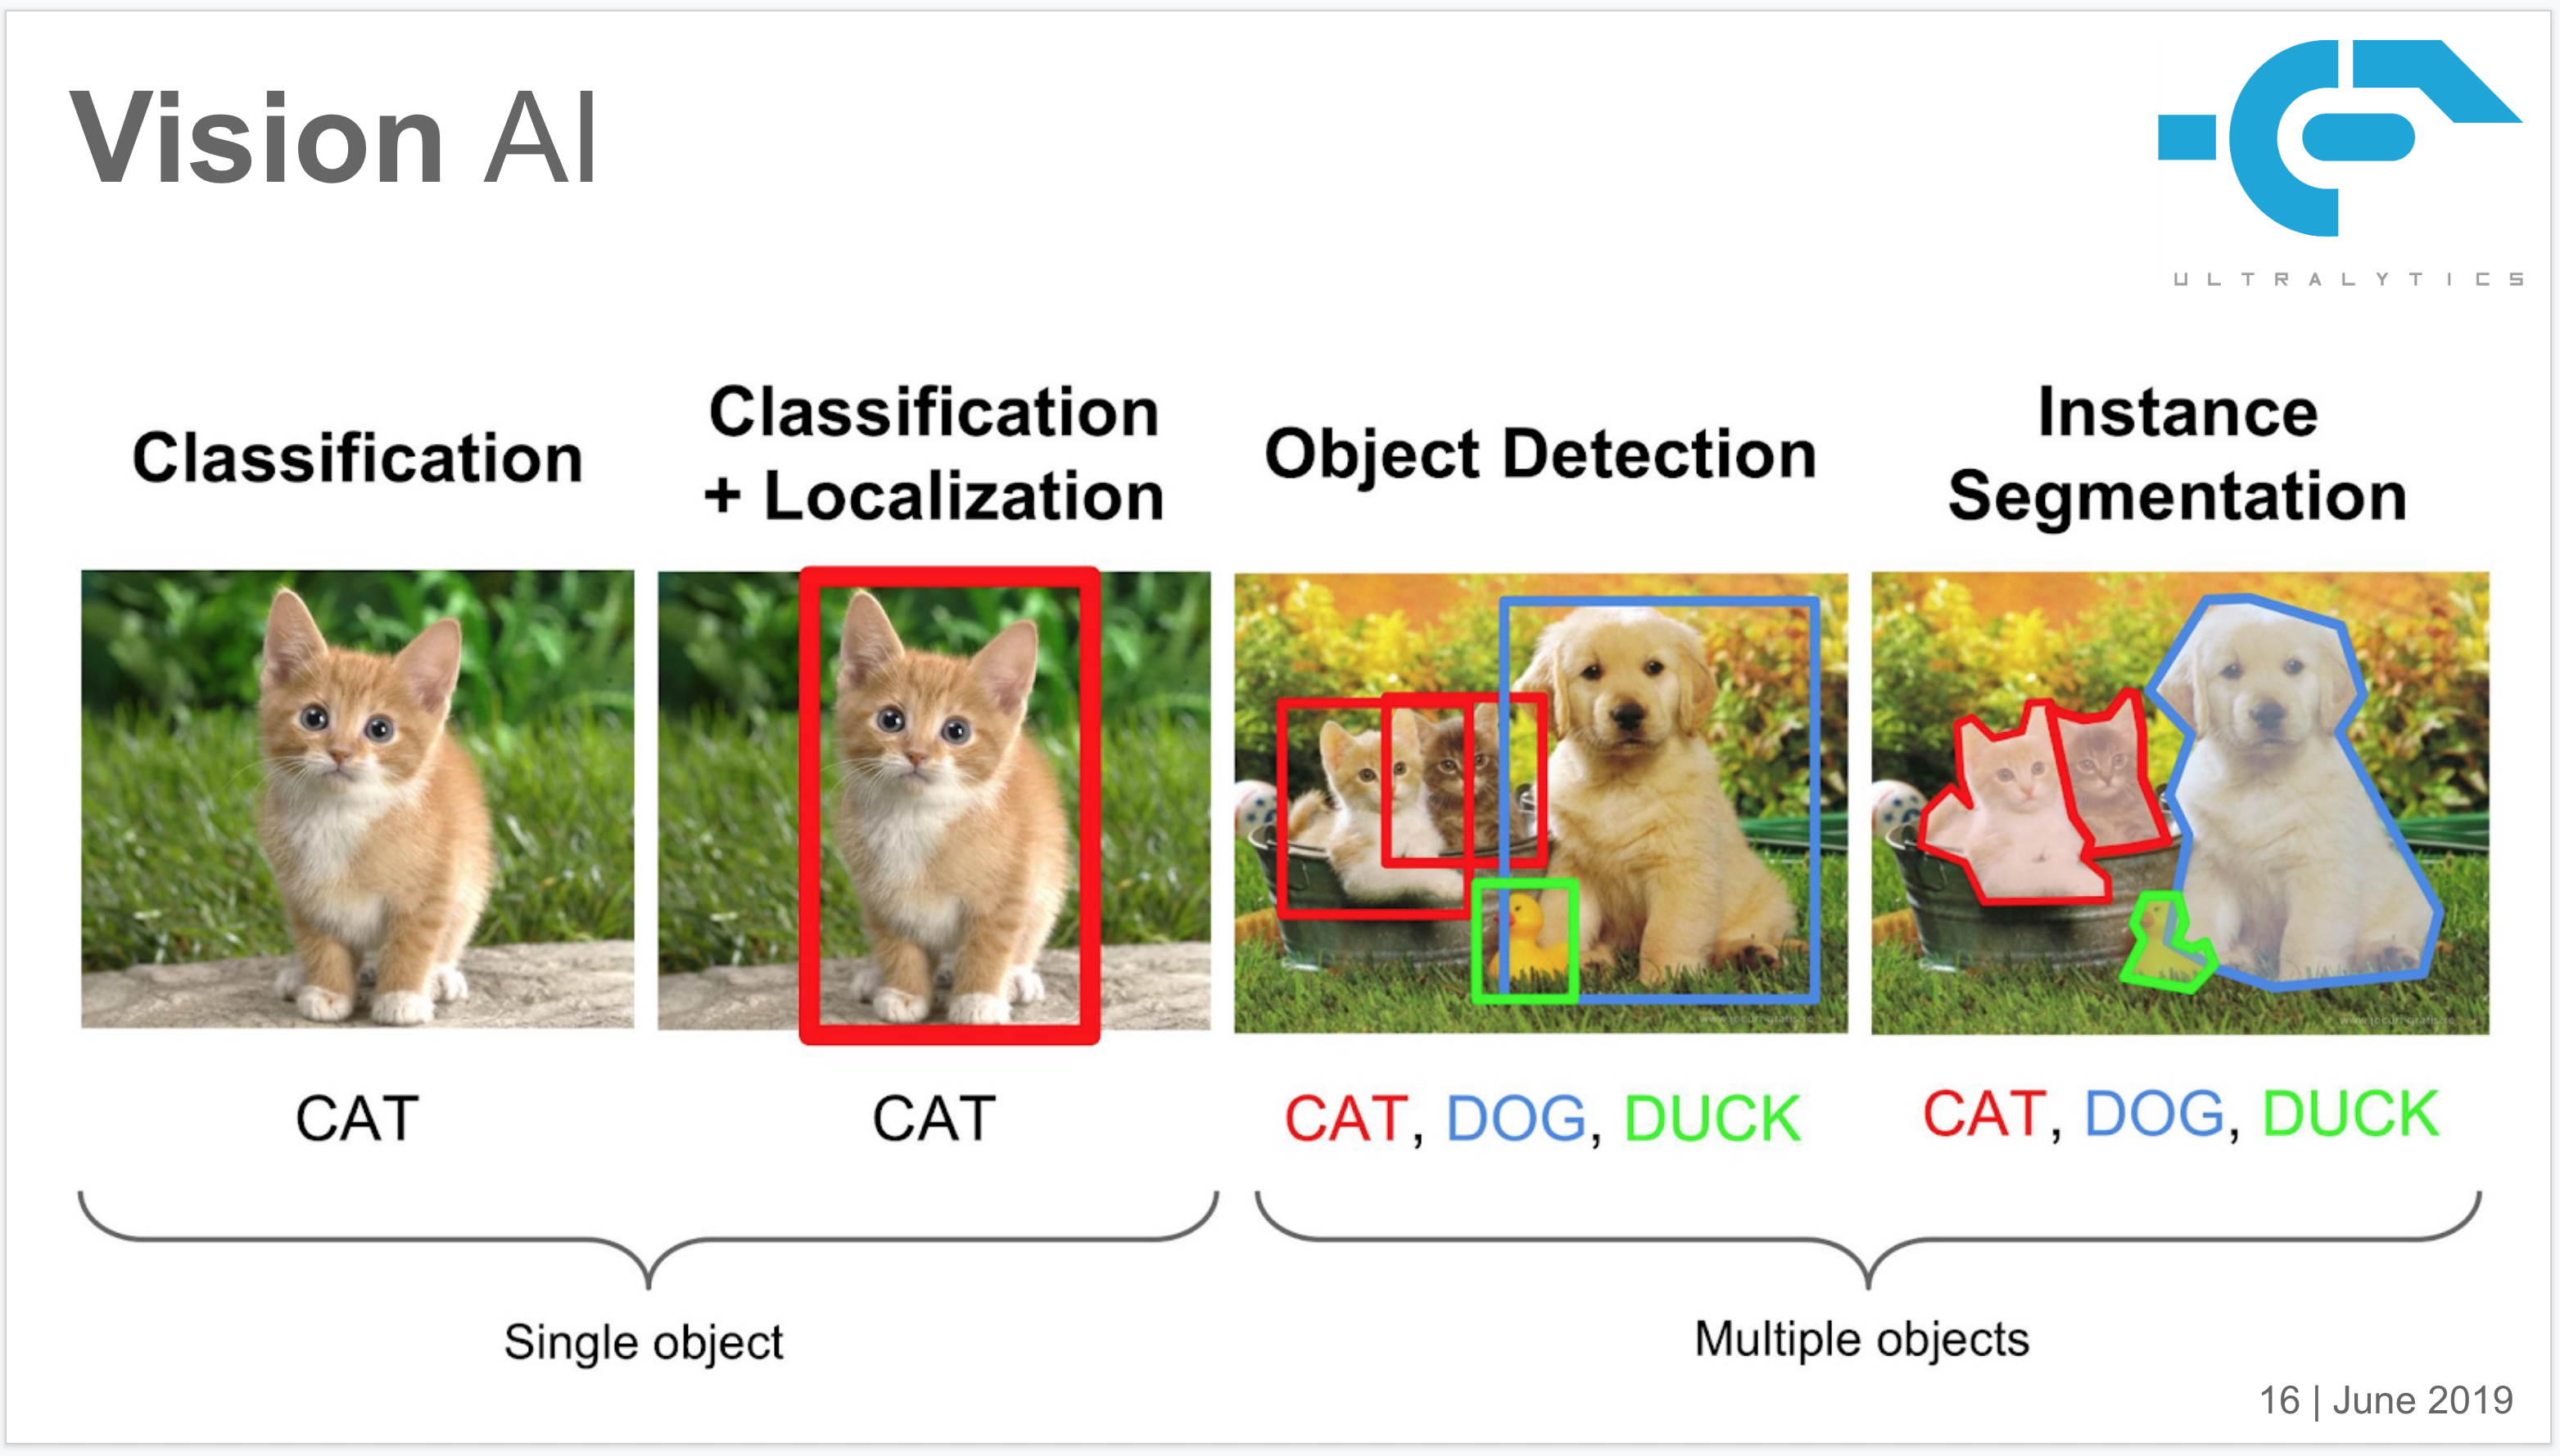
glenn-jocher
on 30 Oct 2020
@glenn-jocher Thank You Sir
So this means there is no training accuracy or validation accuracy in results.txt
Then what is the mAP@ : .5 and mAP@ .5 : .95 ?
And Sir What does all the matrix mean in the results.txt kindly if you tell or suggest any?
Sorry Sir I am new to object detection.
John12Reaper
on 30 Oct 2020
Yes, you are right.
There is no training accuracy or validation accuracy metric, but an mAP metric on your validation dataset.
And I think you need some detailed information about mAP,
https://jonathan-hui.medium.com/map-mean-average-precision-for-object-detection-45c121a31173
 dongjuns
on 30 Oct 2020
dongjuns
on 30 Oct 2020
@dongjuns Thank You, Sir
I really appreciate your kind help.
Sir, please could you tell me how to print of val AP and train AP in a single graph
or val Loss and train Loss in a single graph?
It will be quite helpful.
John12Reaper
on 31 Oct 2020
@John12Reaper You're welcome, look into these functions.
https://github.com/ultralytics/yolov5/blob/c8c5ef36c9a19c7843993ee8d51aebb685467eca/utils/general.py#L1263
https://github.com/ultralytics/yolov5/blob/c8c5ef36c9a19c7843993ee8d51aebb685467eca/utils/general.py#L1240
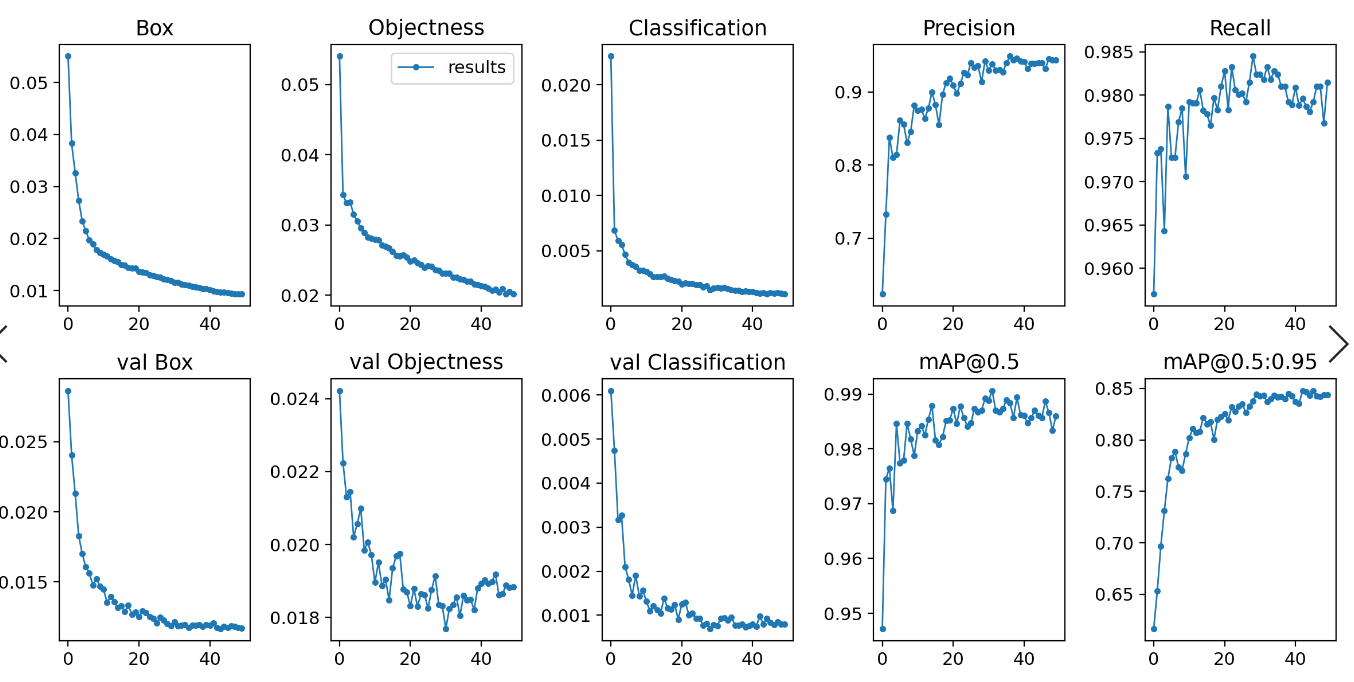
And you can draw training loss and validation loss in a single graph like this.

Move your results.txt file into your YOLOv5 directory, I'm using docker and in my case, YOLOv5 directory path is /usr/src/app.
Then you can get your results.png with this script.
root@21e424cd396c:/usr/src/app# ls
Dockerfile   detect.py   requirements.txt  road_detect.py  train.py
LICENSE      hubconf.py    runs     yolov5x.pt
README.md    inference     sotabench.py     tutorial.ipynb
__pycache__  merge.py     test.py       utils
data         models      results.txt    weights

root@21e424cd396c:/usr/src/app# python
Python 3.6.10 |Anaconda, Inc.| (default, May  8 2020, 02:54:21)
[GCC 7.3.0] on linux
Type "help", "copyright", "credits" or "license" for more information.
>>> from utils.general import *
>>> plot_results_overlay()

root@21e424cd396c:/usr/src/app# ls
Dockerfile   detect.py    requirements.txt    results.txt    weights
LICENSE      hubconf.py    road_detect.py    train.py
README.md    inference     runs    yolov5x.pt
__pycache__  merge.py      sotabench.py    tutorial.ipynb
data         models      results.png       test.py        utils
@dongjuns Sir, You are Great.
I have got the results.png as given below:

Sir, Thank You again.
I have also seen the functions and made some changes to get other relational graphs.
but Sir, One last favor, could you please help?
Is there any way to make these graphs in Tensorboard? just the above graphs.
Cause in TensorBoard it is quite smooth for the evaluation of the performance.
John12Reaper
on 31 Oct 2020
@John12Reaper Don't say 'Sir' please!!! :sob:
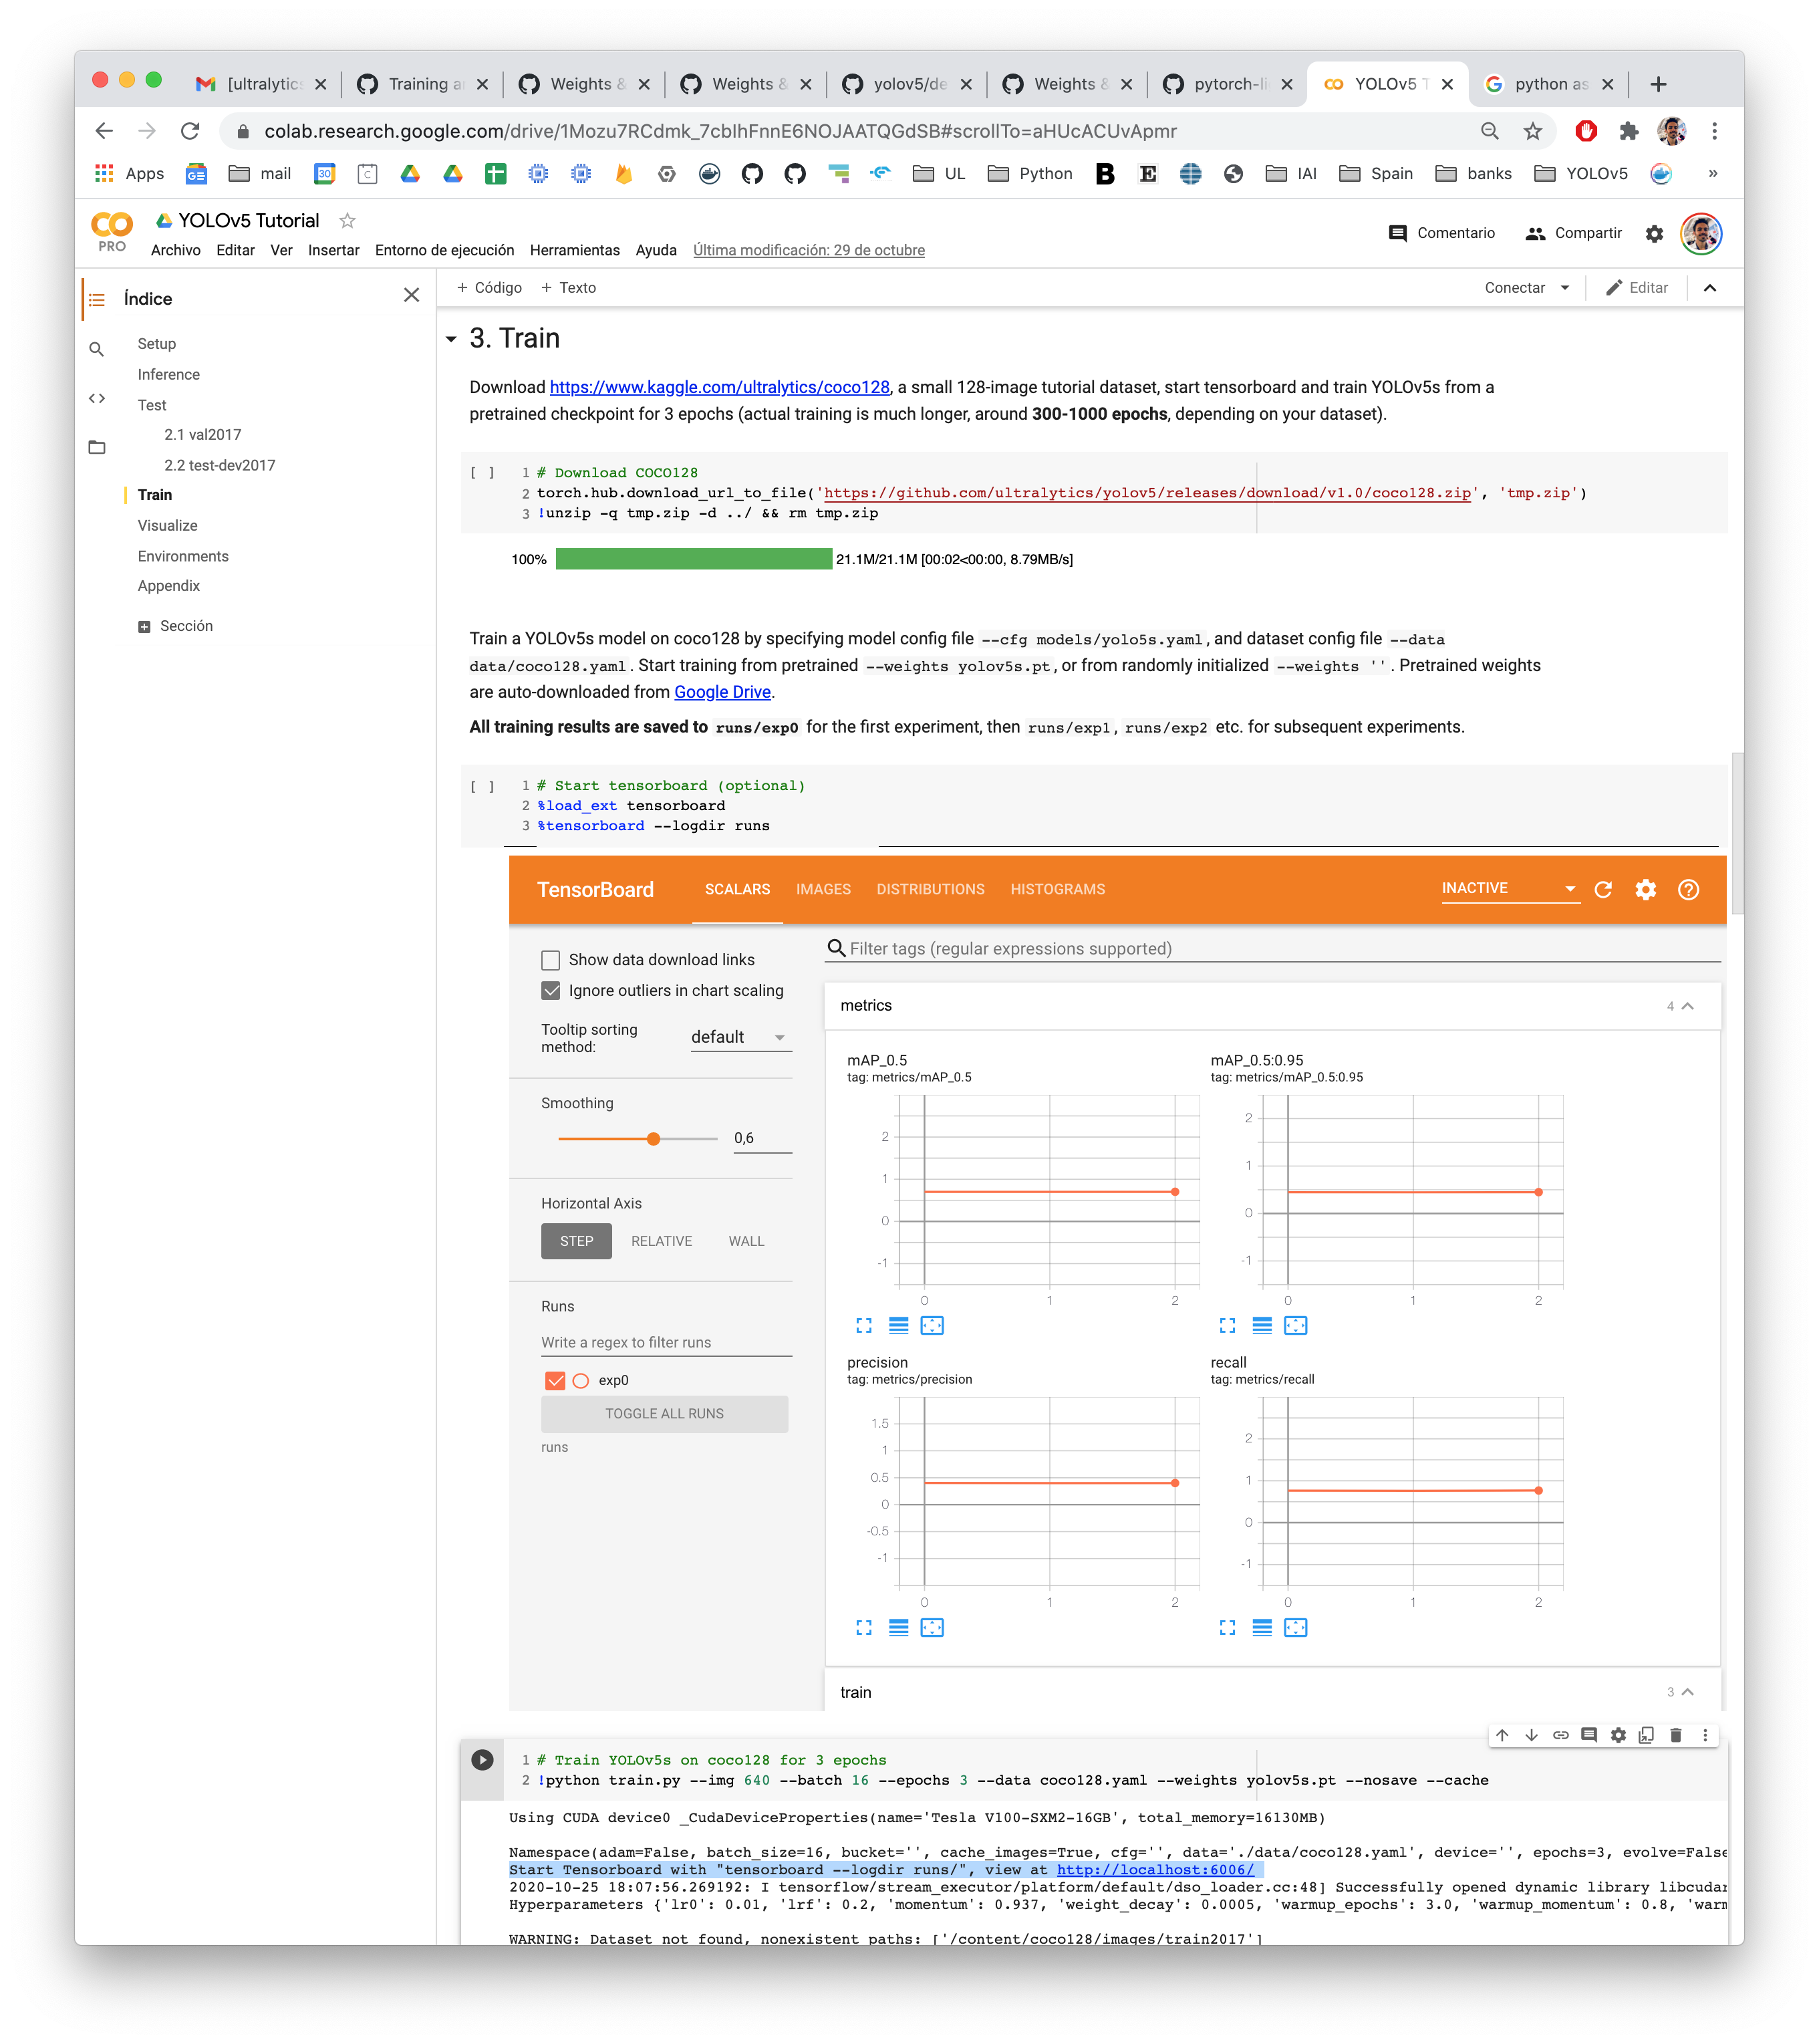
Anyway, I don't use tensorboard but maybe you could get an idea from this link and train.py file.
https://github.com/ultralytics/yolov5/blob/master/tutorial.ipynb
Good luck-!
dongjuns
on 31 Oct 2020
@John12Reaper tensorboard automatically logs all trainings. Tensorboard Instructions are displayed at the beginning of every training run:
Start Tensorboard with "tensorboard --logdir runs/", view at http://localhost:6006/
glenn-jocher
on 31 Oct 2020
@dongjuns I watched the conversation between you and@John12Reaper, but I don’t think I understand what you said, what should I do to get the images of val and train. Or how to modify the code to get orange lines and blue lines? Mine only has blue lines, and no validation set lines.
 ZwNSW
on 3 Nov 2020
ZwNSW
on 3 Nov 2020
This issue has been automatically marked as stale because it has not had recent activity. It will be closed if no further activity occurs. Thank you for your contributions.
![github-actions[bot] picture](https://avatars2.githubusercontent.com/in/15368?v=4&s=40) github-actions[bot]
on 4 Dec 2020
github-actions[bot]
on 4 Dec 2020
Related issues
glenn-jocher
·
124Comments
 NanoCode012
·
56Comments
NanoCode012
·
56Comments
 AlexWang1900
·
32Comments
AlexWang1900
·
32Comments
 SamiurRahman1
·
23Comments
SamiurRahman1
·
23Comments
 amusi
·
25Comments
amusi
·
25Comments
Most helpful comment
@John12Reaper You're welcome, look into these functions.
https://github.com/ultralytics/yolov5/blob/c8c5ef36c9a19c7843993ee8d51aebb685467eca/utils/general.py#L1263
https://github.com/ultralytics/yolov5/blob/c8c5ef36c9a19c7843993ee8d51aebb685467eca/utils/general.py#L1240
And you can draw training loss and validation loss in a single graph like this.

Move your results.txt file into your YOLOv5 directory, I'm using docker and in my case, YOLOv5 directory path is /usr/src/app.
Then you can get your results.png with this script.