Xstate: Visualizer: `always` transitions don't get rendered
Description
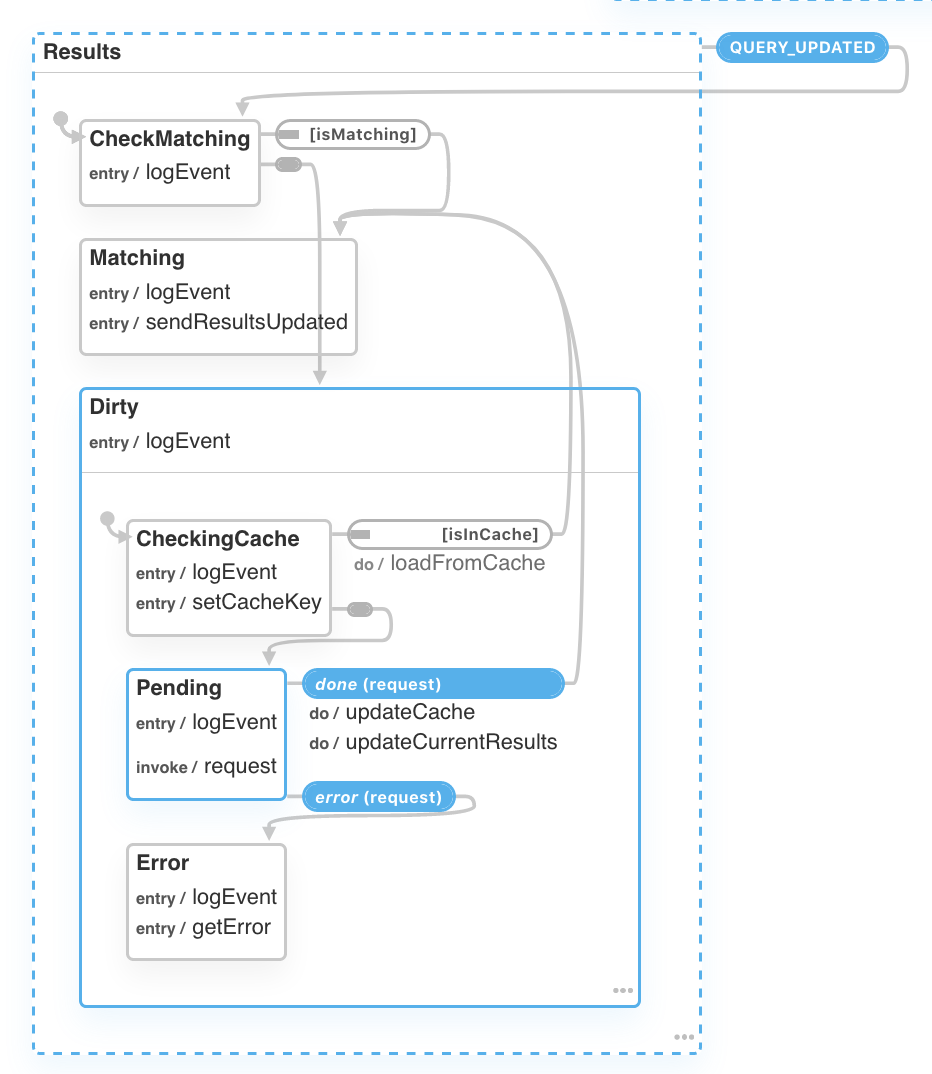
always transitions don't get rendered in the visualizer
Expected Result
Be able to inspect guards in always transitions, like here: https://xstate.js.org/viz/?gist=7a144a4b8be8b3b9cf77ac3531f0f01a
Actual Result
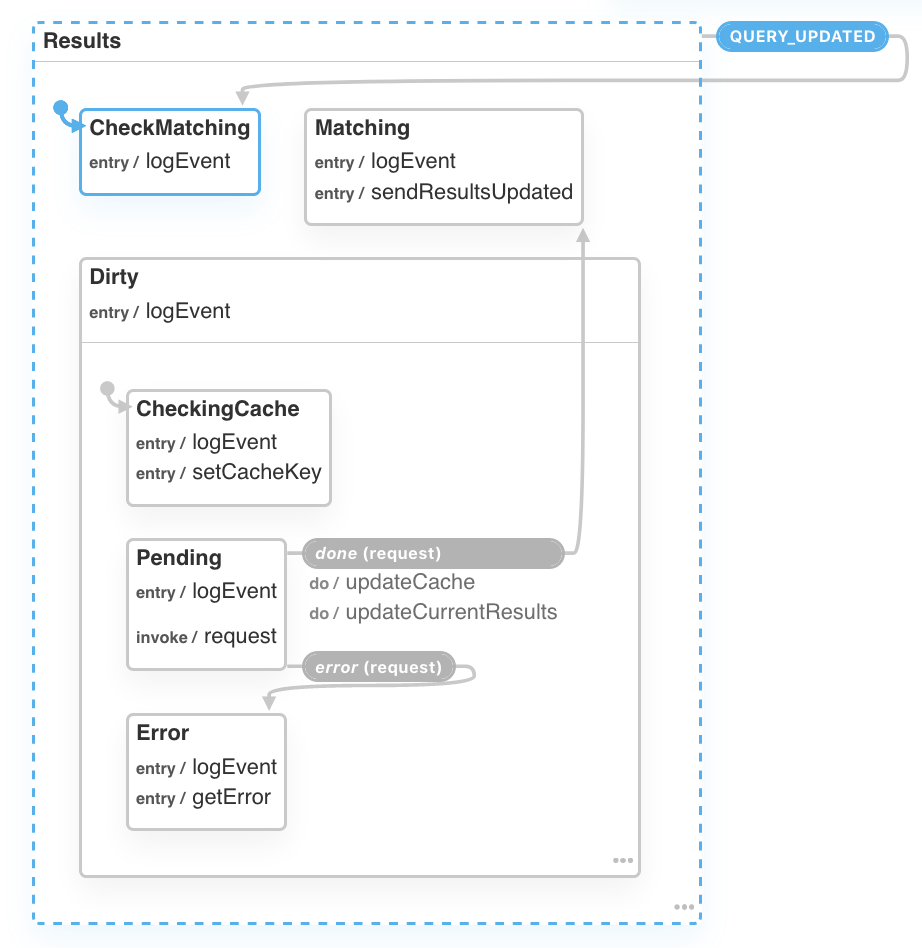
No guards get rendered if within always transitions.
Reproduction
https://xstate.js.org/viz/?gist=419c7ab6587378e52c94a44f78b44805
Additional context
Not sure where to read the Xstate version in the visualizer, we're using "xstate": "^4.13.0".
 mindrones
All 11 comments
Please use the XState inspector (CodeSandbox template) instead.
More info: https://statecharts.io
 davidkpiano
on 19 Nov 2020
davidkpiano
on 19 Nov 2020
Hi @davidkpiano, how can I get a static link to a machine using the inspector?
Machines are first and foremost communication tools, so we need something like the visualizer to document things along the way without the need to run an app to see the machine: is this possible with statecharts.io?
Thanks!
mindrones
on 19 Nov 2020
is this possible with statecharts.io?
In the future, it will be - there will be a way to share and collaborate on machines and actor systems.
But for now, you can copy your machine to a CodeSandbox (no need to run an entire app) with the inspector set up: https://codesandbox.io/s/xstate-viz-template-f3dtr
davidkpiano
on 19 Nov 2020
Thanks, am I right in guessing the visualiser won't be maintained anymore?
mindrones
on 19 Nov 2020
The visualizer will eventually be updated and become part of statecharts.io - the current visualizer is unmaintained.
davidkpiano
on 19 Nov 2020
That's very useful info, thanks! 👍
mindrones
on 19 Nov 2020
Shouldn't be there a hint on the visualizer? I mean it's linked from the home page so this is the first place to look at. At least a banner telling me that this version is based on X.x would be nice to prevent confusion.
 vuhrmeister
on 20 Nov 2020
vuhrmeister
on 20 Nov 2020
I agree.
Visualising a machine and inspecting it at run time are two very different use cases and inspection should never be prioritized over communication IMHO: before implementing a machine we discuss (sometimes at length) about the logic of the machines we are designing and we do this by sharing snapshots in the visualiser.
In the team there's also some disagreement about having a functionality that requires an external service to work and that takes a lot of screen estate: running the inspector on a laptop without an external screen is being quite problematic, if not impossible (you need to keep your app and the inspector open at the same times, which makes life quite difficult and using the inspector pointless). There are worries that statecharts.io would become a paid service in the future, causing vendor lock-in.
All in all the preferred solution would be a code editor addon so that the machine would be visualised locally, where you edit the code (EDIT: and sharable via visualizer).
The visualiser code might be a separate, generic function that reads a machine object and generates a layout, so that you'd be able to render it where you want, with the technique you prefer.
If this is desirable we'd be glad to help :)
mindrones
on 20 Nov 2020
@mindrones The inspector will always be free, and I am working on a solution to make it so that you can run it locally as well. That should solve the same use-case as the current visualizer.
Right now, the (outdated) visualizer already puts the machine into a "runtime" environment so that it can visualize it. The same thing can be accomplished with the inspector and code such as this:
import { inspect } from '@xstate/inspect';
import { interpret, createMachine } from 'xstate';

inspect();

const machine = createMachine(/* ... */);
interpret(machine, { devTools: true });
Once I have the run-anywhere visualizer ready (currently it's baked into a Next.JS app), I'll update xstate.js.org/viz to essentially be the same as the above code.
davidkpiano
on 20 Nov 2020
Ah that's great to hear, thanks for posting.
Also we have data visualisation skills in the team, can we help to improve the layout somehow?
Is it going to change or stay more or less the same?
mindrones
on 20 Nov 2020
Also we have data visualisation skills in the team, can we help to improve the layout somehow?
Absolutely. By the way, in @xstate/graph, there is a toDirectedGraph(machine) function that returns a friendly directed graph format (e.g., { children: ..., edges: ... }) that allows you to more easily draw statecharts in any graph drawing library, like GraphViz, PlantUML, or ElkJS: https://xstate.js.org/docs/packages/xstate-graph/#todirectedgraph-machine
davidkpiano
on 20 Nov 2020
Related issues
 drmikecrowe
·
3Comments
drmikecrowe
·
3Comments
 doup
·
3Comments
doup
·
3Comments
 suku-h
·
3Comments
suku-h
·
3Comments
 jfun
·
3Comments
jfun
·
3Comments
 ifokeev
·
3Comments
ifokeev
·
3Comments
Most helpful comment
Shouldn't be there a hint on the visualizer? I mean it's linked from the home page so this is the first place to look at. At least a banner telling me that this version is based on X.x would be nice to prevent confusion.