Xla: Cloud TPU Profiler doesn't produce `*tfevents*` file that will be used by TensorBoard
❓ Questions and Help
Hello,
I was trying to use Cloud TPU Profiler on GCP to capture the detailed profiling data of my model. My model was written with pytorch/xla but the link above was based on a TF example.
When I followed the steps to
- run the training loop
- run
capture_tpu_profile - run
tensorboard
However, the capture_tpu_profile script didn't produce *tfevents* file that will be consumed by the TensorBoard. I did a search online but couldn't find any information about using TensorBoard without tfevents file or what should be produced normally by capture_tpu_profile.
Could you help to let me know:
- If Cloud TPU Profiler can be used on pytorch/xla models?
- Should
capture_tpu_profileproduce*tfevents*file for the use of TensorBoard? - How generally you set up the TPU profiler internally to profile the xla models? Is it possible to enhance the profiler documentation to add the information related to pytorch/xla?
Here are the outputs from my run:
########### Terminal 1: run the training loop


########### Terminal 2: capture the data
capture_tpu_profile --tpu=$TPU_NAME --logdir=${MODEL_DIR}
2020-09-13 15:11:52.077030: W    2137 tensorflow/stream_executor/platform/default/dso_loader.cc:59] Could not load dynamic library 'libcudart.so.10.1'; dlerror: libcudart.so.10.1: cannot open shared object file: No such file or directory; LD_LIBRARY_PATH: /anaconda3/envs/torch-xla-nightly/lib/
2020-09-13 15:11:52.077078: I    2137 tensorflow/stream_executor/cuda/cudart_stub.cc:29] Ignore above cudart dlerror if you do not have a GPU set up on your machine.

TensorFlow version 2.3.0 detected
Welcome to the Cloud TPU Profiler v2.3.0
I0913 15:12:05.063286 139696475645312 discovery.py:280] URL being requested: GET https://www.googleapis.com/discovery/v1/apis/tpu/v1/rest
I0913 15:12:05.189064 139696475645312 discovery.py:911] URL being requested: GET https://tpu.googleapis.com/v1/projects/tpu-project-261022/locations/europe-west4-a/nodes/wangsh46-pyt-nightly?alt=json
I0913 15:12:05.189270 139696475645312 transport.py:157] Attempting refresh to obtain initial access_token
I0913 15:12:05.308283 139696475645312 discovery.py:280] URL being requested: GET https://www.googleapis.com/discovery/v1/apis/tpu/v1/rest
I0913 15:12:05.356080 139696475645312 discovery.py:911] URL being requested: GET https://tpu.googleapis.com/v1/projects/tpu-project-261022/locations/europe-west4-a/nodes/wangsh46-pyt-nightly?alt=json
I0913 15:12:05.356287 139696475645312 transport.py:157] Attempting refresh to obtain initial access_token
Starting to trace for 1000 ms. Remaining attempt(s): 2
Profile session succeed for host(s):10.171.63.122
# capture_tpu_profile command exited here


########### Terminal 3: try to start TensorBoard after the training in terminal 1 stops
tensorboard --logdir=${MODEL_DIR} --inspect
2020-09-13 15:17:13.928846: W    2254 tensorflow/stream_executor/platform/default/dso_loader.cc:59] Could not load dynamic library 'libcudart.so.10.1'; dlerror: libcudart.so.10.1: cannot open shared object file: No such file or directory; LD_LIBRARY_PATH: /anaconda3/envs/torch-xla-nightly/lib/
2020-09-13 15:17:13.928905: I    2254 tensorflow/stream_executor/cuda/cudart_stub.cc:29] Ignore above cudart dlerror if you do not have a GPU set up on your machine.

======================================================================
Processing event files... (this can take a few minutes)
======================================================================

No event files found within logdir gs://fusion-profiling/efficientnet-2x
The content in the storage bucket is:
# Note that there is no tfevents file in the storage bucket.
gsutil ls ${MODEL_DIR}
gs://fusion-profiling/efficientnet-2x/
gs://fusion-profiling/efficientnet-2x/2020_09_13_15_12_06/

gsutil ls ${MODEL_DIR}/2020_09_13_15_12_06
gs://fusion-profiling/efficientnet-2x/2020_09_13_15_12_06/
gs://fusion-profiling/efficientnet-2x/2020_09_13_15_12_06/10.171.63.122.SyncTensorsGraph.720(13382040931725084739).memory_viewer.json
gs://fusion-profiling/efficientnet-2x/2020_09_13_15_12_06/10.171.63.122.SyncTensorsGraph.720(15887669286856484439).memory_viewer.json
gs://fusion-profiling/efficientnet-2x/2020_09_13_15_12_06/10.171.63.122.SyncTensorsGraph.728(16616722211761160222).memory_viewer.json
gs://fusion-profiling/efficientnet-2x/2020_09_13_15_12_06/10.171.63.122.input_pipeline.json
gs://fusion-profiling/efficientnet-2x/2020_09_13_15_12_06/10.171.63.122.op_profile.json
gs://fusion-profiling/efficientnet-2x/2020_09_13_15_12_06/10.171.63.122.overview_page.json
gs://fusion-profiling/efficientnet-2x/2020_09_13_15_12_06/10.171.63.122.pod_viewer.json
gs://fusion-profiling/efficientnet-2x/2020_09_13_15_12_06/10.171.63.122.tensorflow_stats.pb
gs://fusion-profiling/efficientnet-2x/2020_09_13_15_12_06/10.171.63.122.trace
gs://fusion-profiling/efficientnet-2x/2020_09_13_15_12_06/10.171.63.122.tracetable

gsutil du -sh ${MODEL_DIR}/2020_09_13_15_12_06
17.71 MiB    gs://fusion-profiling/efficientnet-2x/2020_09_13_15_12_06
# The installed package version
>>> tensorflow.__version__
'2.3.0'
>>> tensorboard.__version__
'2.3.0'
>>> torch.__version__
'1.7.0a0+ab76067'
>>> torch_xla.__version__
'1.6+8b9f5c2'
Thanks a lot!
(Also cc @wangshangsam and @suvinay-csail for this post)
 eric-zheng
All 35 comments
FYI, I have tried to follow the current Cloud TPU Profiler documentation to try the profiler with TF 2.3.0, instead of pytorch-xla.
However, this document was targeting at TF 1 and I couldn't run the model with TF 2.3.0. Then, I also updated the model to the latest version (pull from this github repo) but still it couldn't be trained without error. It could produce a tfevents file, but I couldn't view the meaningful data yet because the training stopped with error. For now, I still couldn't find a working example that can run successfully on TPU with the profiler.
(cc @wangshangsam for his information)
eric-zheng
on 14 Sep 2020
Yes you should be able to use TPU profiler with pytorch/xla.
It looks like you do have the .tracetable file in the LOGDIR. Is that file empty or does it have things written to it? And what do you see when you open Tensorboard?
I'm not sure whether or not there should be any "events" if the goal is TPU profiling.
 zcain117
on 14 Sep 2020
zcain117
on 14 Sep 2020
Thanks for your help!
Yes, I do have .tracetable file which is not empty. However, if I start the TensorBoard server and go to the weblink, it will complain that it cannot find data/eventfile. If I run tensorboard --inspect, it will complain that no event file is found:
tensorboard --logdir=${MODEL_DIR} --inspect
2020-09-13 15:17:13.928846: W 2254 tensorflow/stream_executor/platform/default/dso_loader.cc:59] Could not load dynamic library 'libcudart.so.10.1'; dlerror: libcudart.so.10.1: cannot open shared object file: No such file or directory; LD_LIBRARY_PATH: /anaconda3/envs/torch-xla-nightly/lib/
2020-09-13 15:17:13.928905: I 2254 tensorflow/stream_executor/cuda/cudart_stub.cc:29] Ignore above cudart dlerror if you do not have a GPU set up on your machine.
======================================================================
Processing event files... (this can take a few minutes)
======================================================================
No event files found within logdir gs://fusion-profiling/efficientnet-2x
From the command line help of TensorBoard, I thought it must require a tfevents file to load the data.
It's good know that we can use TPU Profiler with pytorch/xla. Could you help to point out an example that can be profiled with pytorch/xla (maybe some xla unit test) ?
I can try to run the example and mimic its flow. I'm not sure if the code being profiled should include any logic related to tensorboard. I know there is a tensorboard module of pytorch, but I wasn't sure how it coordinates with the capture_tpu_profile script to generate the profile.
Thanks
eric-zheng
on 15 Sep 2020
Is the No event files found message a hard error? Or just a warning? If the process doesn't exit I would ignore the message and navigate to the port where tensorboard is running in the browser.
It's weird that the training loop didn't produce any events. Did you run training with --logdir=$MODEL_DIR? You could also try our example mnist model, which will definitely write event files, e.g. python3 pytorch/xla/test/test_train_mp_mnist.py --logdir=$(MODEL_DIR)
zcain117
on 15 Sep 2020
For the No event files found message, if I don't run Tensorboard with `--inspect, I can start the server and access the port, but the web GUI will say it cannot find event file (as what I said before).
I will try the example mnist model. I think perhaps this line of code makes difference:
test_utils.write_to_summary(
writer,
epoch,
dict_to_write={'Accuracy/test': accuracy},
write_xla_metrics=True)
Thanks
eric-zheng
on 15 Sep 2020
If there are no events, it makes sense that the scalars tab in Tensorboard would be empty and it might mention the lack of events. I was wondering if some of the other Tensorboard tabs might have data, for example the "Graphs" tab or the "Profile" tab
zcain117
on 15 Sep 2020
I also tried to view other tabs before, but there was no data either. Let me try the mnist example and get back to you. Thanks
eric-zheng
on 15 Sep 2020
I have tried the mnist example. I was able to see a tfevents file in the storage bucket together with a set of .trace and .tracetable files.
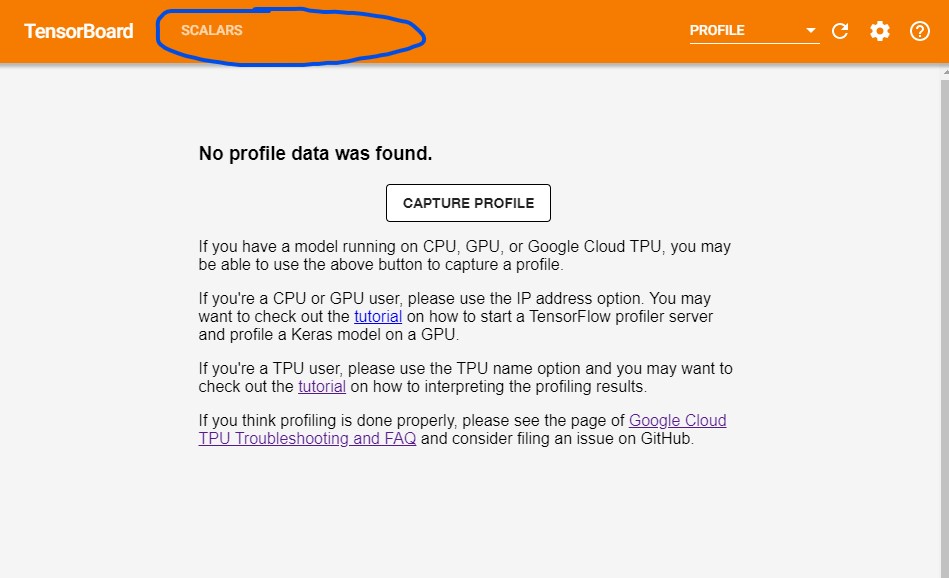
However, there is still no "Profile" tab on the TensorBoard instance I started, although I can see the SCALARS tab. From the guide, I think there should be a "PROFILE" tab on the top left of the web interface which will be used to access all set of profile data, including accessing the .trace file.
Do you know how to let TensorBoard properly find the .trace file and display the PROFILE tab? Below are the files in MODEL_DIR which include the trace files.
gsutil ls $MODEL_DIR
gs://fusion-profiling/mnist/
gs://fusion-profiling/mnist/events.out.tfevents.1600212340.wangsh46-pyt16
gs://fusion-profiling/mnist/events.out.tfevents.1600213221.wangsh46-pyt16
gs://fusion-profiling/mnist/2020_09_15_23_25_56/
gs://fusion-profiling/mnist/2020_09_15_23_40_05/
gs://fusion-profiling/mnist/2020_09_15_23_40_32/
gsutil ls $MODEL_DIR/2020_09_15_23_25_56
gs://fusion-profiling/mnist/2020_09_15_23_25_56/
gs://fusion-profiling/mnist/2020_09_15_23_25_56/10.171.63.122.SyncTensorsGraph.102(10391326339541927909).memory_viewer.json
gs://fusion-profiling/mnist/2020_09_15_23_25_56/10.171.63.122.SyncTensorsGraph.184(15907800210111003685).memory_viewer.json
gs://fusion-profiling/mnist/2020_09_15_23_25_56/10.171.63.122.SyncTensorsGraph.184(3734576419895338764).memory_viewer.json
gs://fusion-profiling/mnist/2020_09_15_23_25_56/10.171.63.122.SyncTensorsGraph.184(4859889243373469091).memory_viewer.json
gs://fusion-profiling/mnist/2020_09_15_23_25_56/10.171.63.122.SyncTensorsGraph.540(6190583952457113945).memory_viewer.json
gs://fusion-profiling/mnist/2020_09_15_23_25_56/10.171.63.122.SyncTensorsGraph.797(11172889771847448354).memory_viewer.json
gs://fusion-profiling/mnist/2020_09_15_23_25_56/10.171.63.122.SyncTensorsGraph.797(13018745804264917848).memory_viewer.json
gs://fusion-profiling/mnist/2020_09_15_23_25_56/10.171.63.122.input_pipeline.json
gs://fusion-profiling/mnist/2020_09_15_23_25_56/10.171.63.122.op_profile.json
gs://fusion-profiling/mnist/2020_09_15_23_25_56/10.171.63.122.overview_page.json
gs://fusion-profiling/mnist/2020_09_15_23_25_56/10.171.63.122.pod_viewer.json
gs://fusion-profiling/mnist/2020_09_15_23_25_56/10.171.63.122.tensorflow_stats.pb
gs://fusion-profiling/mnist/2020_09_15_23_25_56/10.171.63.122.trace
gs://fusion-profiling/mnist/2020_09_15_23_25_56/10.171.63.122.tracetable
gsutil du -sh $MODEL_DIR
40.28 MiB gs://fusion-profiling/mnist
eric-zheng
on 16 Sep 2020
Summary of Current Status
Following this guide about Cloud TPU Profiler couldn't bring up a TensorBoard web showing the PROFILE tab. The most recent example model used was pytorch-xla mnist example. Previously, some other examples were also tried, including TF 2 EfficientNet, but they had errors during the training (efficientnet and tf mnist), possibly due to TF 2 API mismatches.
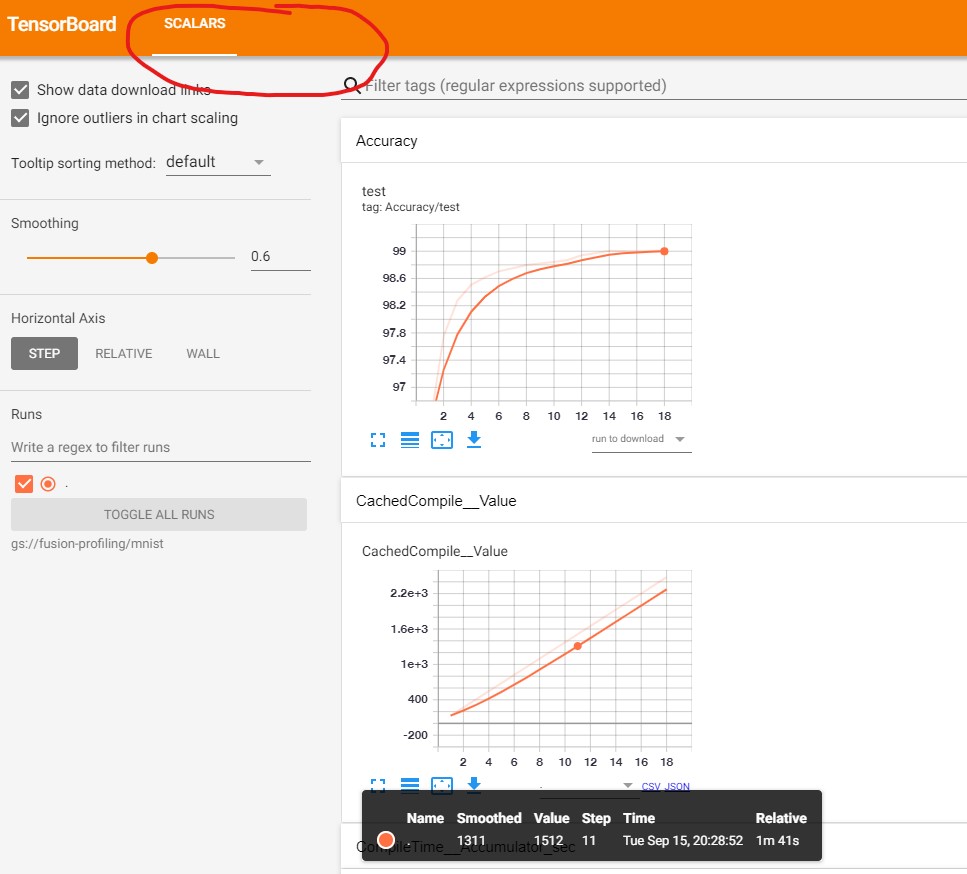
In short, the problem is that capture_tpu_profile alone doesn't generate tfevents file that is required when bringing up TensorBoard. With the pytorch-xla mnist example, a tfevents file was written, but seems not related to the TPU profile, because the TensorBoard only displayed trivial Scalar data instead of the Profile data. Although .trace and .tracetable files were generated, TensorBoard was not able to read and display them. See the screenshot at the bottom.
The steps to capture the profile from xla mnist example:
# Set up environment on all terminals
export STORAGE_BUCKET=gs://fusion-profiling
export MODEL_DIR=${STORAGE_BUCKET}/mnist
export TPU_NAME=my-tpu-name
# Terminal 1 on GCP, run the training loop
python test_train_mp_mnist.py --logdir=${MODEL_DIR}
# Then, on Terminal 2
capture_tpu_profile --tpu=${TPU_NAME} --logdir=${MODEL_DIR}
# Terminal 3, after the training was done
tensorboard --logdir=${MODEL_DIR}
The output of
tensorboard --logdir=${MODEL_DIR} --inspect
======================================================================
Processing event files... (this can take a few minutes)
======================================================================
Found event files in:
gs://fusion-profiling/mnist
These tags are in gs://fusion-profiling/mnist:
audio -
histograms -
images -
scalars
Accuracy/test
CachedCompile__Value
CompileTime__Accumulator_sec
CompileTime__Percentile_10_sec
CompileTime__Percentile_1_sec
CompileTime__Percentile_20_sec
CompileTime__Percentile_50_sec
CompileTime__Percentile_5_sec
CompileTime__Percentile_80_sec
CompileTime__Percentile_90_sec
CompileTime__Percentile_95_sec
CompileTime__Percentile_99_sec
CompileTime__TotalSamples
CreateCompileHandles__Value
CreateDataHandles__Value
CreateXlaTensor__Value
DestroyDataHandles__Value
DestroyXlaTensor__Value
DeviceDataCacheMiss__Value
DeviceLockWait__Accumulator_sec
DeviceLockWait__Percentile_10_sec
DeviceLockWait__Percentile_1_sec
DeviceLockWait__Percentile_20_sec
DeviceLockWait__Percentile_50_sec
DeviceLockWait__Percentile_5_sec
DeviceLockWait__Percentile_80_sec
DeviceLockWait__Percentile_90_sec
DeviceLockWait__Percentile_95_sec
DeviceLockWait__Percentile_99_sec
DeviceLockWait__TotalSamples
ExecuteTime__Accumulator_sec
ExecuteTime__Percentile_10_sec
ExecuteTime__Percentile_1_sec
ExecuteTime__Percentile_20_sec
ExecuteTime__Percentile_50_sec
ExecuteTime__Percentile_5_sec
ExecuteTime__Percentile_80_sec
ExecuteTime__Percentile_90_sec
ExecuteTime__Percentile_95_sec
ExecuteTime__Percentile_99_sec
ExecuteTime__TotalSamples
InboundData__Accumulator_mb
InboundData__Percentile_10_mb
InboundData__Percentile_1_mb
InboundData__Percentile_20_mb
InboundData__Percentile_50_mb
InboundData__Percentile_5_mb
InboundData__Percentile_80_mb
InboundData__Percentile_90_mb
InboundData__Percentile_95_mb
InboundData__Percentile_99_mb
InboundData__TotalSamples
InputOutputAliasCount__Accumulator
InputOutputAliasCount__Percentile_1
InputOutputAliasCount__Percentile_10
InputOutputAliasCount__Percentile_20
InputOutputAliasCount__Percentile_5
InputOutputAliasCount__Percentile_50
InputOutputAliasCount__Percentile_80
InputOutputAliasCount__Percentile_90
InputOutputAliasCount__Percentile_95
InputOutputAliasCount__Percentile_99
InputOutputAliasCount__TotalSamples
IrValueTensorToXlaData__Accumulator_sec
IrValueTensorToXlaData__Percentile_10_sec
IrValueTensorToXlaData__Percentile_1_sec
IrValueTensorToXlaData__Percentile_20_sec
IrValueTensorToXlaData__Percentile_50_sec
IrValueTensorToXlaData__Percentile_5_sec
IrValueTensorToXlaData__Percentile_80_sec
IrValueTensorToXlaData__Percentile_90_sec
IrValueTensorToXlaData__Percentile_95_sec
IrValueTensorToXlaData__Percentile_99_sec
IrValueTensorToXlaData__TotalSamples
MarkStep__Value
OutboundData__Accumulator_mb
OutboundData__Percentile_10_mb
OutboundData__Percentile_1_mb
OutboundData__Percentile_20_mb
OutboundData__Percentile_50_mb
OutboundData__Percentile_5_mb
OutboundData__Percentile_80_mb
OutboundData__Percentile_90_mb
OutboundData__Percentile_95_mb
OutboundData__Percentile_99_mb
OutboundData__TotalSamples
ReleaseDataHandlesTime__Accumulator_sec
ReleaseDataHandlesTime__Percentile_10_sec
ReleaseDataHandlesTime__Percentile_1_sec
ReleaseDataHandlesTime__Percentile_20_sec
ReleaseDataHandlesTime__Percentile_50_sec
ReleaseDataHandlesTime__Percentile_5_sec
ReleaseDataHandlesTime__Percentile_80_sec
ReleaseDataHandlesTime__Percentile_90_sec
ReleaseDataHandlesTime__Percentile_95_sec
ReleaseDataHandlesTime__Percentile_99_sec
ReleaseDataHandlesTime__TotalSamples
ReleaseDataHandles__Value
TensorboardStartTimestamp
TensorsGraphSize__Accumulator
TensorsGraphSize__Percentile_1
TensorsGraphSize__Percentile_10
TensorsGraphSize__Percentile_20
TensorsGraphSize__Percentile_5
TensorsGraphSize__Percentile_50
TensorsGraphSize__Percentile_80
TensorsGraphSize__Percentile_90
TensorsGraphSize__Percentile_95
TensorsGraphSize__Percentile_99
TensorsGraphSize__TotalSamples
TransferFromServerTime__Accumulator_sec
TransferFromServerTime__Percentile_10_sec
TransferFromServerTime__Percentile_1_sec
TransferFromServerTime__Percentile_20_sec
TransferFromServerTime__Percentile_50_sec
TransferFromServerTime__Percentile_5_sec
TransferFromServerTime__Percentile_80_sec
TransferFromServerTime__Percentile_90_sec
TransferFromServerTime__Percentile_95_sec
TransferFromServerTime__Percentile_99_sec
TransferFromServerTime__TotalSamples
TransferToServerTime__Accumulator_sec
TransferToServerTime__Percentile_10_sec
TransferToServerTime__Percentile_1_sec
TransferToServerTime__Percentile_20_sec
TransferToServerTime__Percentile_50_sec
TransferToServerTime__Percentile_5_sec
TransferToServerTime__Percentile_80_sec
TransferToServerTime__Percentile_90_sec
TransferToServerTime__Percentile_95_sec
TransferToServerTime__Percentile_99_sec
TransferToServerTime__TotalSamples
TransferToServerTransformTime__Accumulator_sec
TransferToServerTransformTime__Percentile_10_sec
TransferToServerTransformTime__Percentile_1_sec
TransferToServerTransformTime__Percentile_20_sec
TransferToServerTransformTime__Percentile_50_sec
TransferToServerTransformTime__Percentile_5_sec
TransferToServerTransformTime__Percentile_80_sec
TransferToServerTransformTime__Percentile_90_sec
TransferToServerTransformTime__Percentile_95_sec
TransferToServerTransformTime__Percentile_99_sec
TransferToServerTransformTime__TotalSamples
UncachedCompile__Value
XRTAllocateFromTensor_Empty__Value
XrtAllocateFromTensor__Accumulator_sec
XrtAllocateFromTensor__Percentile_20_sec
XrtAllocateFromTensor__Percentile_50_sec
XrtAllocateFromTensor__Percentile_80_sec
XrtAllocateFromTensor__Percentile_90_sec
XrtAllocateFromTensor__Percentile_95_sec
XrtAllocateFromTensor__Percentile_99_sec
XrtAllocateFromTensor__TotalSamples
XrtCompile_Empty__Value
XrtCompile__Accumulator_sec
XrtCompile__Percentile_20_sec
XrtCompile__Percentile_50_sec
XrtCompile__Percentile_80_sec
XrtCompile__Percentile_90_sec
XrtCompile__Percentile_95_sec
XrtCompile__Percentile_99_sec
XrtCompile__TotalSamples
XrtExecuteChained_Empty__Value
XrtExecute_Empty__Value
XrtExecute__Accumulator_sec
XrtExecute__Percentile_20_sec
XrtExecute__Percentile_50_sec
XrtExecute__Percentile_80_sec
XrtExecute__Percentile_90_sec
XrtExecute__Percentile_95_sec
XrtExecute__Percentile_99_sec
XrtExecute__TotalSamples
XrtMemoryInfo_Empty__Value
XrtReadLiteral__Accumulator_sec
XrtReadLiteral__Percentile_20_sec
XrtReadLiteral__Percentile_50_sec
XrtReadLiteral__Percentile_80_sec
XrtReadLiteral__Percentile_90_sec
XrtReadLiteral__Percentile_95_sec
XrtReadLiteral__Percentile_99_sec
XrtReadLiteral__TotalSamples
XrtRead_Empty__Value
XrtReleaseAllocationHandle_Empty__Value
XrtReleaseAllocation__Accumulator_sec
XrtReleaseAllocation__Percentile_20_sec
XrtReleaseAllocation__Percentile_50_sec
XrtReleaseAllocation__Percentile_80_sec
XrtReleaseAllocation__Percentile_90_sec
XrtReleaseAllocation__Percentile_95_sec
XrtReleaseAllocation__Percentile_99_sec
XrtReleaseAllocation__TotalSamples
XrtReleaseCompileHandle_Empty__Value
XrtSessionCount__Value
XrtSubTuple_Empty__Value
aten___local_scalar_dense__Value
aten_ops_sum
average_examples/sec
examples/sec
xla___copy_from__Value
xla___log_softmax__Value
xla___log_softmax_backward_data__Value
xla__add__Value
xla__add___Value
xla__addmm__Value
xla__as_strided__Value
xla__clone__Value
xla__convolution_backward_overrideable__Value
xla__convolution_overrideable__Value
xla__empty__Value
xla__empty_strided__Value
xla__eq__Value
xla__fill___Value
xla__max__Value
xla__max_pool2d__Value
xla__mm__Value
xla__mul___Value
xla__native_batch_norm__Value
xla__native_batch_norm_backward__Value
xla__nll_loss_backward__Value
xla__nll_loss_forward__Value
xla__relu__Value
xla__sum__Value
xla__t__Value
xla__threshold_backward__Value
xla__view__Value
xla__zero___Value
tensor -
======================================================================
Event statistics for gs://fusion-profiling/mnist:
audio -
graph -
histograms -
images -
scalars
first_step 0
last_step 18
max_step 18
min_step 0
num_steps 19
outoforder_steps [(1, 0), (2, 0), (3, 0), (4, 0), (5, 0), (6, 0), (7, 0), (8, 0), (9, 0), (10, 0), (11, 0), (12, 0), (13, 0), (14, 0), (15, 0), (16, 0), (17, 0)]
sessionlog:checkpoint -
sessionlog:start -
sessionlog:stop -
tensor -
======================================================================
The content inside the storage bucket after the training:
gsutil ls $MODEL_DIR
gs://fusion-profiling/mnist/
gs://fusion-profiling/mnist/events.out.tfevents.1600216018.my-vm-name
gs://fusion-profiling/mnist/2020_09_16_00_27_26/
gsutil ls $MODEL_DIR/2020_09_16_00_27_26
gs://fusion-profiling/mnist/2020_09_16_00_27_26/
gs://fusion-profiling/mnist/2020_09_16_00_27_26/10.171.63.122.SyncTensorsGraph.102(10391326339541927909).memory_viewer.json
gs://fusion-profiling/mnist/2020_09_16_00_27_26/10.171.63.122.SyncTensorsGraph.184(15907800210111003685).memory_viewer.json
gs://fusion-profiling/mnist/2020_09_16_00_27_26/10.171.63.122.SyncTensorsGraph.184(3734576419895338764).memory_viewer.json
gs://fusion-profiling/mnist/2020_09_16_00_27_26/10.171.63.122.SyncTensorsGraph.184(4859889243373469091).memory_viewer.json
gs://fusion-profiling/mnist/2020_09_16_00_27_26/10.171.63.122.SyncTensorsGraph.540(6190583952457113945).memory_viewer.json
gs://fusion-profiling/mnist/2020_09_16_00_27_26/10.171.63.122.SyncTensorsGraph.797(11172889771847448354).memory_viewer.json
gs://fusion-profiling/mnist/2020_09_16_00_27_26/10.171.63.122.SyncTensorsGraph.797(13018745804264917848).memory_viewer.json
gs://fusion-profiling/mnist/2020_09_16_00_27_26/10.171.63.122.input_pipeline.json
gs://fusion-profiling/mnist/2020_09_16_00_27_26/10.171.63.122.op_profile.json
gs://fusion-profiling/mnist/2020_09_16_00_27_26/10.171.63.122.overview_page.json
gs://fusion-profiling/mnist/2020_09_16_00_27_26/10.171.63.122.pod_viewer.json
gs://fusion-profiling/mnist/2020_09_16_00_27_26/10.171.63.122.tensorflow_stats.pb
gs://fusion-profiling/mnist/2020_09_16_00_27_26/10.171.63.122.trace
gs://fusion-profiling/mnist/2020_09_16_00_27_26/10.171.63.122.tracetable
gsutil du -sh $MODEL_DIR/2020_09_16_00_27_26
17.02 MiB gs://fusion-profiling/mnist/2020_09_16_00_27_26
The environment is:
>>> tf.__version__
'2.3.0'
>>> tensorboard.__version__
'2.3.0'
>>> torch.__version__
'1.7.0a0+ab76067'
>>> torch_xla.__version__
'1.6+8b9f5c2'
tensorboard --version
2.3.0
Finally, the TensorBoard looks like below. Note that there is no PROFILE tab at the top panel.
eric-zheng
on 16 Sep 2020
Sorry that this is still not working. I'm going to try to repro the issue later today, but while you wait, could you try copying your latest status as an issue here: https://github.com/tensorflow/tensorboard/issues
Someone on the Tensorboard team might know better why these files you have are not being rendered. I'll try running mnist like you did and see if I get the same result
zcain117
on 16 Sep 2020
Thanks a lot for your help! @zcain117 I'll reach out to the tensorboard team.
eric-zheng
on 16 Sep 2020
I tried the process and I'm seeing the same issue. I ran all 3 processes (capture, training, and Tensorboard) all from the same VM using a Docker image for the profile capture portion.
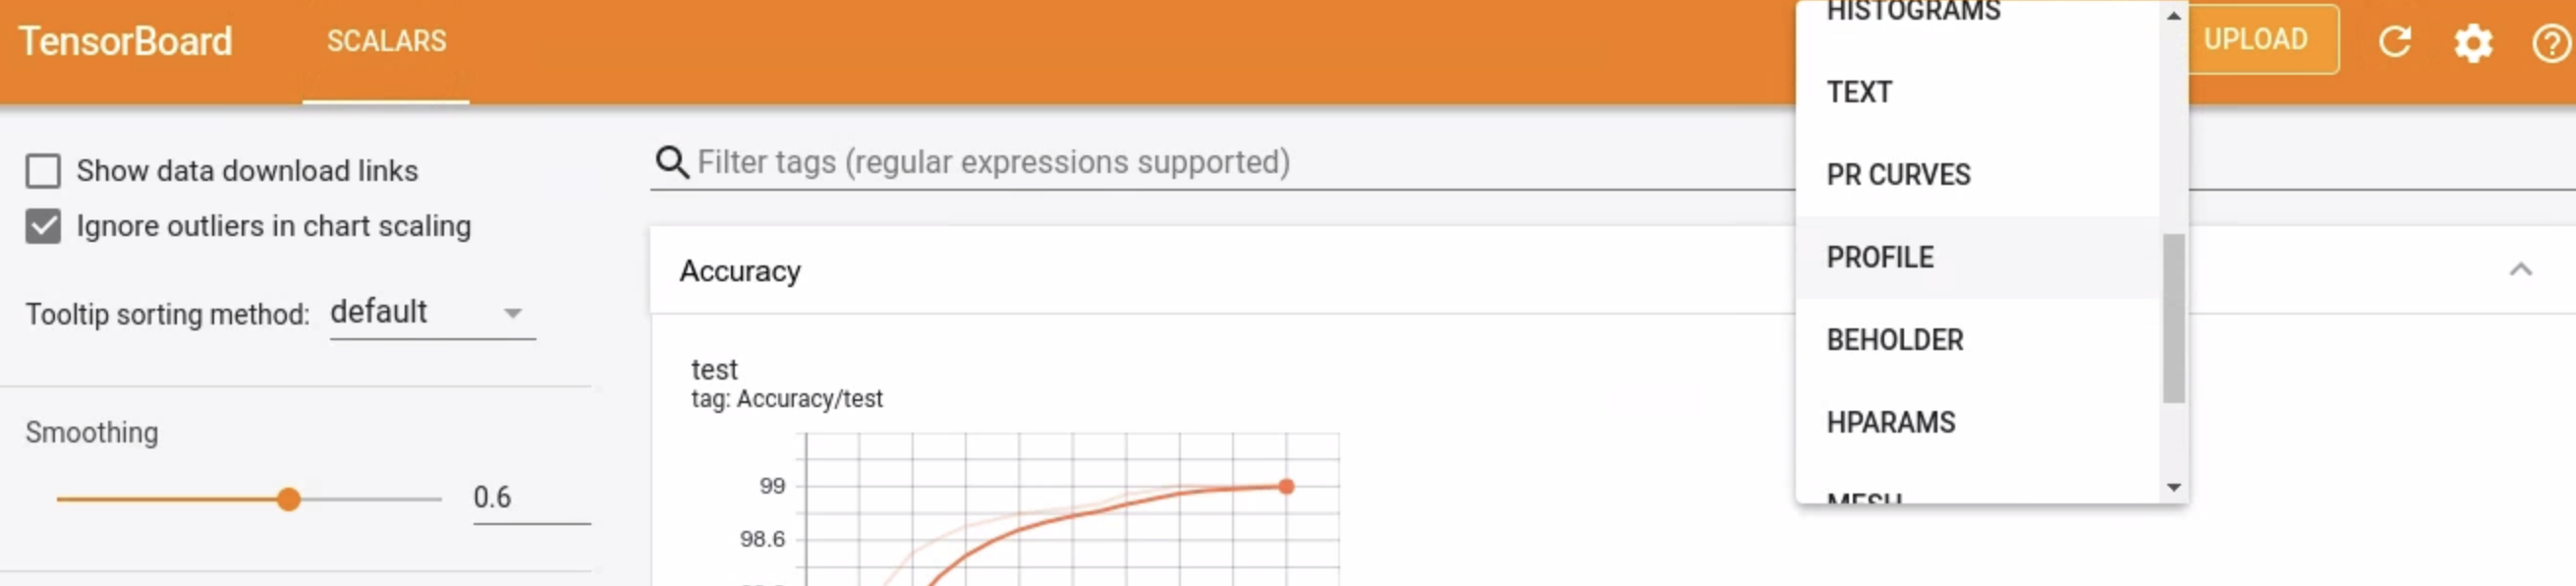
I see .tracetable files and events files, but when I run Tensorboard I only see the scalars. On the right side, I see a dropdown where I can choose "GRAPHS" or "PROFILE" but both of those options are empty. "PROFILE" has an option to capture TPU profile through the UI, so maybe I'll try that if the Tensorboard team doesn't have any advice for why your files are not leading to anything in the Tensorboard UI.
zcain117
on 17 Sep 2020
Couple of things to try (I'll also try these when I get a chance):
- (Assuming you are using
nightlyorr1.6VM software) Try usingnightlyTensorboard: https://pypi.org/project/tb-nightly/ - Try to capture TPU profile from Tensorboard UI. I think if you are running Tensorboard and go to the "PROFILE" or maybe "GRAPHS" dropdown, there should a button to capture TPU profile
zcain117
on 17 Sep 2020
I didn't try nightly Tensoboard before. I'll try it when I get chance.
But for the "capture tpu profile" button from GUI, I tried it before and it didn't work when I tried it.
eric-zheng
on 17 Sep 2020
This issue has been automatically marked as stale because it has not had recent activity. It will be closed if no further activity occurs. Thank you for your contributions.
![stale[bot] picture](https://avatars3.githubusercontent.com/in/1724?v=4&s=40) stale[bot]
on 17 Oct 2020
stale[bot]
on 17 Oct 2020
@eric-zheng
Is there any update on this? Could the profile be read by TensorBoard?
 phtephanx
on 21 Oct 2020
phtephanx
on 21 Oct 2020
Hi @phtephanx , I was still not able to view the profile results when I tried last time. I'll try again soon to confirm again.
Should the TensorBoard github repo be a better place to hold this issue? This is an issue mixing TensorBoard & pytorch/xla factors.
Thanks
eric-zheng
on 22 Oct 2020
Really interested in this feature, is it reported in tensorboard already? I don't see any links.
 denfromufa
on 12 Nov 2020
denfromufa
on 12 Nov 2020
Hi @denfromufa and @phtephanx , I still had this issue when I tried it last time (2 weeks ago). I don't think there is a corresponding issue in TensorBoard (i.e. tensorflow) github repo now.
@denfromufa Would you like to create an issue at TensorBoard repo and link back to this issue? Or I can create one later (but probably in a few days).
Thanks
eric-zheng
on 15 Nov 2020
I took a look at it and it actually doesn't look like an issue on tensorboard, but instead on the profiler tool.
As of last week though, @taylanbil was able to capture a profile. Could you give it another run?
 jysohn23
on 16 Nov 2020
jysohn23
on 16 Nov 2020
@eric-zheng I'm also able to capture the profile with pytorch==v1.6 and pytorch_xla==v1.6.
phtephanx
on 16 Nov 2020
does updating cloud_tpu_profiler resolve your issue?
 taylanbil
on 16 Nov 2020
taylanbil
on 16 Nov 2020
@taylanbil @jysohn23
I tried it again with the most up-to-date capture_tpu_profile and verified that my local file has this change: https://github.com/tensorflow/tensorflow/commit/7540f9ff5ac877ca9bd750d21a8607d4f3008952#diff-a341a4a3032ca925f0622cf3b1dca411d40735e13f5c6e3d7f3fb895f59e263a
However, I still cannot generate meaningful profile data. Only scalar data was shown, same as before. The steps I performed:
# Use this example: https://github.com/pytorch/xla/blob/master/test/test_train_mp_mnist.py
# Environment
>>> tensorflow.__version__
'2.3.1'
>>> tensorboard.__version__
'2.4.0'
>>> torch.__version__
'1.7.0a0+626e410'
>>> torch_xla.__version__
'1.6+8af57fb'
export STORAGE_BUCKET=gs://fusion-profiling
export MODEL_DIR=${STORAGE_BUCKET}/mnist
export TPU_NAME=my_tpu_name
# Terminal 1 on GCP, run the training loop
python test_train_mp_mnist.py --logdir=${MODEL_DIR}
# Then at the same time, on Terminal 2
capture_tpu_profile --tpu=${TPU_NAME} --logdir=${MODEL_DIR}
# Terminal 3, after the training was done
tensorboard --logdir=${MODEL_DIR}
@phtephanx Could you let me know what steps you followed to capture the profile? Are you following any documentation? I can give it a try.
Thanks
eric-zheng
on 20 Nov 2020
torch and torch_xla should have the same version number, try e.g. 1.7 for both. See Release Notes. The software version of the TPU should then also be 1.7. Apart from that, I don't see that I'm performing any different steps. I followed the official instructions.
phtephanx
on 20 Nov 2020
make sure to capture the profile when you know the tpu is going through the steps fast. If you capture during a compilation, you may not get a ton of meaningful stuff. in your terminal 2, did you capture mid-epoch or at the start?
taylanbil
on 20 Nov 2020
@taylanbil I started to capture when I saw the training in terminal 1 started (i.e. mid-epoch).
@phtephanx I'll give a try with version 1.7 and official instructions later.
Thanks for the help
eric-zheng
on 21 Nov 2020
Any update on this? I am also facing the same issue.
 fostiropoulos
on 15 Dec 2020
fostiropoulos
on 15 Dec 2020
Can you try using the latest profiler release, whether you're using the tensorboard profiler plugin for capture_tpu_profile CLI?
jysohn23
on 15 Dec 2020
Hello, I was able to capture the profile by a customized wrapper around profiler_client. However, until the last time I tried, I couldn't get the profile from capture_tpu_profile. I will give it another try today and post my workaround if it still doesn't work for me.
eric-zheng
on 15 Dec 2020
Thanks so much for the update, @eric-zheng. I have also been trying and running into the same errors as you. Would it be possible to open source this wrapper?
fostiropoulos
on 15 Dec 2020
Also, I want to update that I'm currently working on PyTorch/XLA APIs to directly, programmatically profile the TPU.
jysohn23
on 15 Dec 2020
@jysohn23 would be glad to contribute. What branch / repo is it on?
fostiropoulos
on 15 Dec 2020
@jysohn23 @fostiropoulos
Hi, I tried the capture_tpu_profile script again and it didn't work for me. But I tried to debug a bit and now I have a stable workaround to generate the profile. When you capture the profile, please pass --workers_list='' into the script. For example:
# Terminal 1: run your training job

# Terminal 2: it will capture 10000 ms profile
capture_tpu_profile --tpu=${TPU_NAME} --logdir=${MODEL_DIR} --num_tracing_attempts=10 --duration_ms=10000 --workers_list=''

# Terminal 3:
tensorboard --logdir=${MODEL_DIR}
I think the issue (at least for me) is that https://github.com/tensorflow/tensorflow/blob/master/tensorflow/python/tpu/profiler/capture_tpu_profile.py#L202 calls profiler_client.trace with workers_list=<same as service_addr>. I'm not sure why this would be a problem, but passing an empty string to .trace resolved the issue.
Could you help to take a look on this issue Daniel? I'm also not sure whether this is for both tf & xla or xla specific.
Thanks!
eric-zheng
on 16 Dec 2020
@eric-zheng
The work-around suggested to set --workers_list='' is working. However to see the profile you need to select the profile drop-down from the top right corner manually. There will not be a tab that appears on the top, next to the scalars tab (similar to the Tensorflow tutorial)

fostiropoulos
on 17 Dec 2020
@fostiropoulos
For me, I need to click on the "reload" button at the top right corner. And the PROFILE tab will show up afterwards.
eric-zheng
on 17 Dec 2020
Related issues
 dalmia
·
6Comments
dalmia
·
6Comments
 myleott
·
7Comments
myleott
·
7Comments
 nosound2
·
6Comments
nosound2
·
6Comments
 david-alexander-white
·
6Comments
david-alexander-white
·
6Comments
 ailzhang
·
6Comments
ailzhang
·
6Comments
Most helpful comment
@jysohn23 @fostiropoulos
Hi, I tried the
capture_tpu_profilescript again and it didn't work for me. But I tried to debug a bit and now I have a stable workaround to generate the profile. When you capture the profile, please pass--workers_list=''into the script. For example:I think the issue (at least for me) is that https://github.com/tensorflow/tensorflow/blob/master/tensorflow/python/tpu/profiler/capture_tpu_profile.py#L202 calls
profiler_client.tracewithworkers_list=<same as service_addr>. I'm not sure why this would be a problem, but passing an empty string to.traceresolved the issue.Could you help to take a look on this issue Daniel? I'm also not sure whether this is for both tf & xla or xla specific.
Thanks!