I observe, high variability in performance between batches in the same epoch, do you have an idea how to explain (and fix!) these phenomena? I afraid I under-utilize my resources.
My setup is
- GCP VM, 16 vCPUs, 73.5 GB memory
- TPU v3-8, similar behavior both for nightly and 1.14 soft ver, using all 8 shards
- num_workers=16
- conda nightly VM env
- resnet50 with some calculation on the loss moved to cpu (non-gradient), in order to avoid using dynamic masks on TPU. This doesn't seem to change much.
- 512x512x6 images
- I tried to remove everything else that might interfere, like calculating and printing validation results on the run
A regular run seconds per batch look like this, this is for batch size 16:
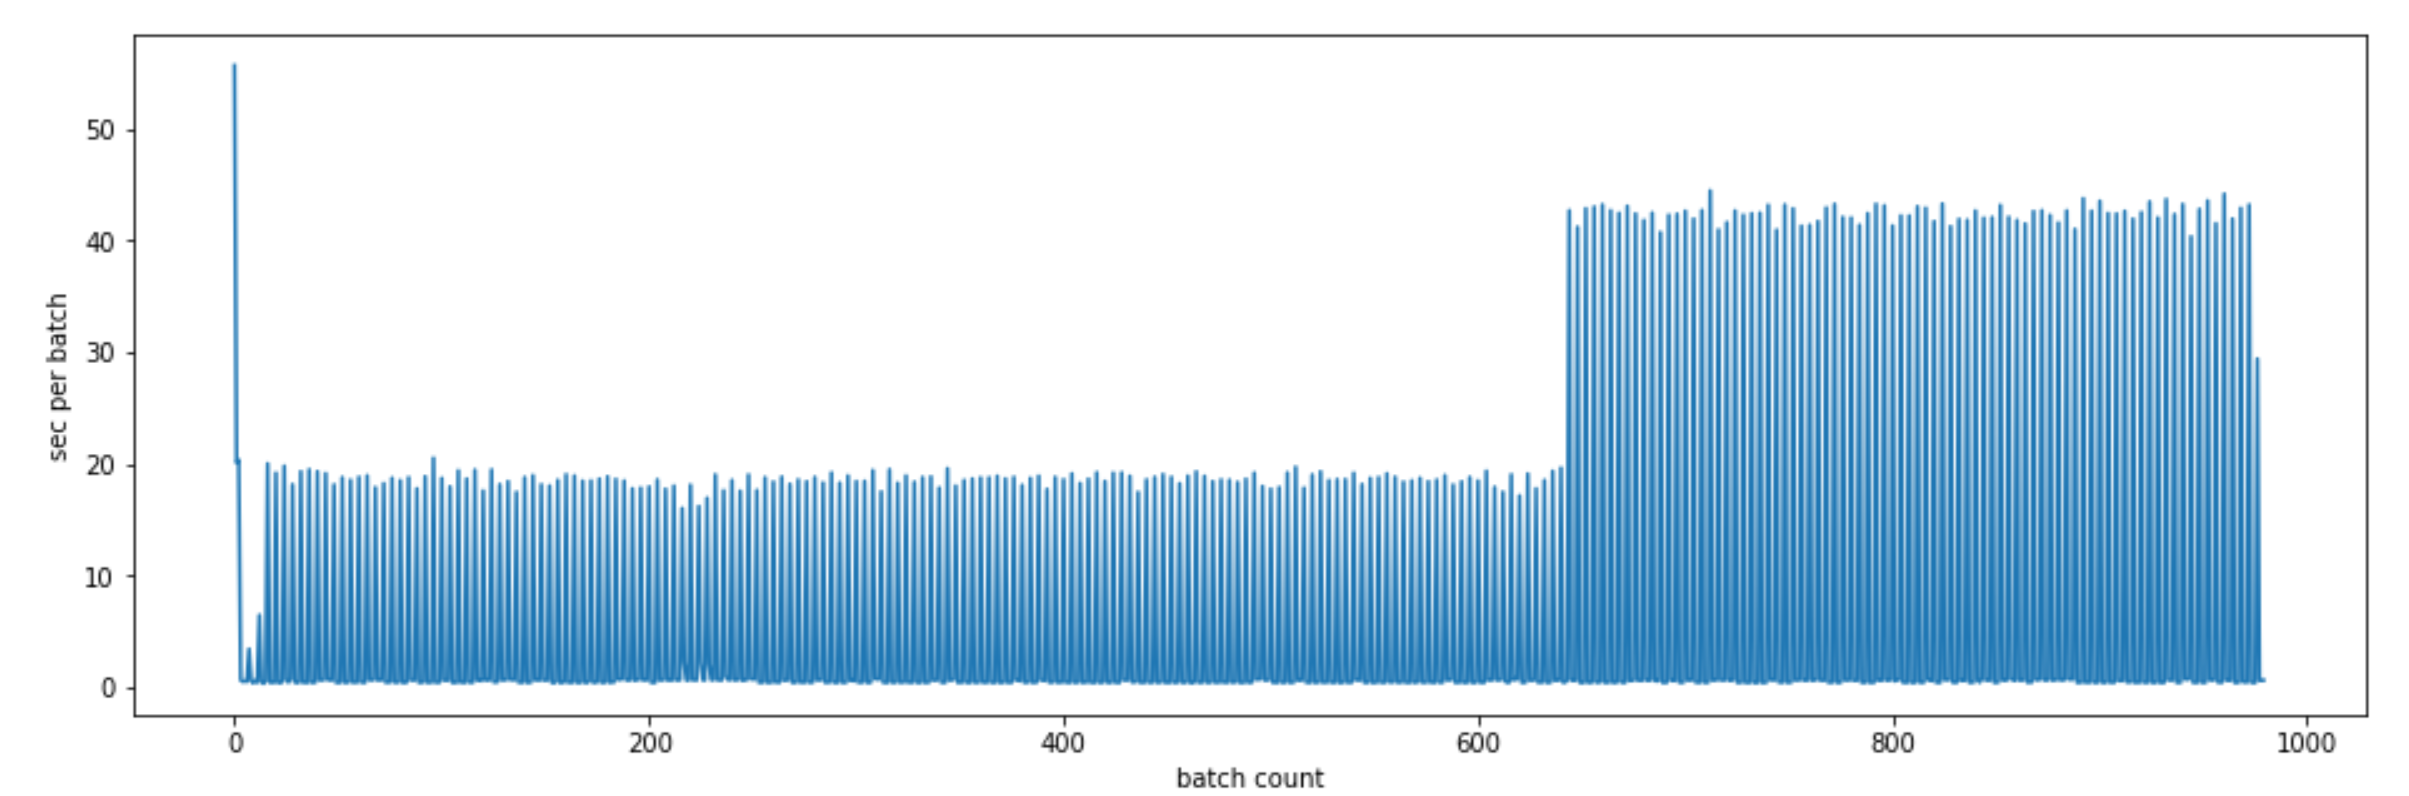
The following three issues are observed:
- Approximately every 4th batch the running time is much higher. Does not depend on batch size.
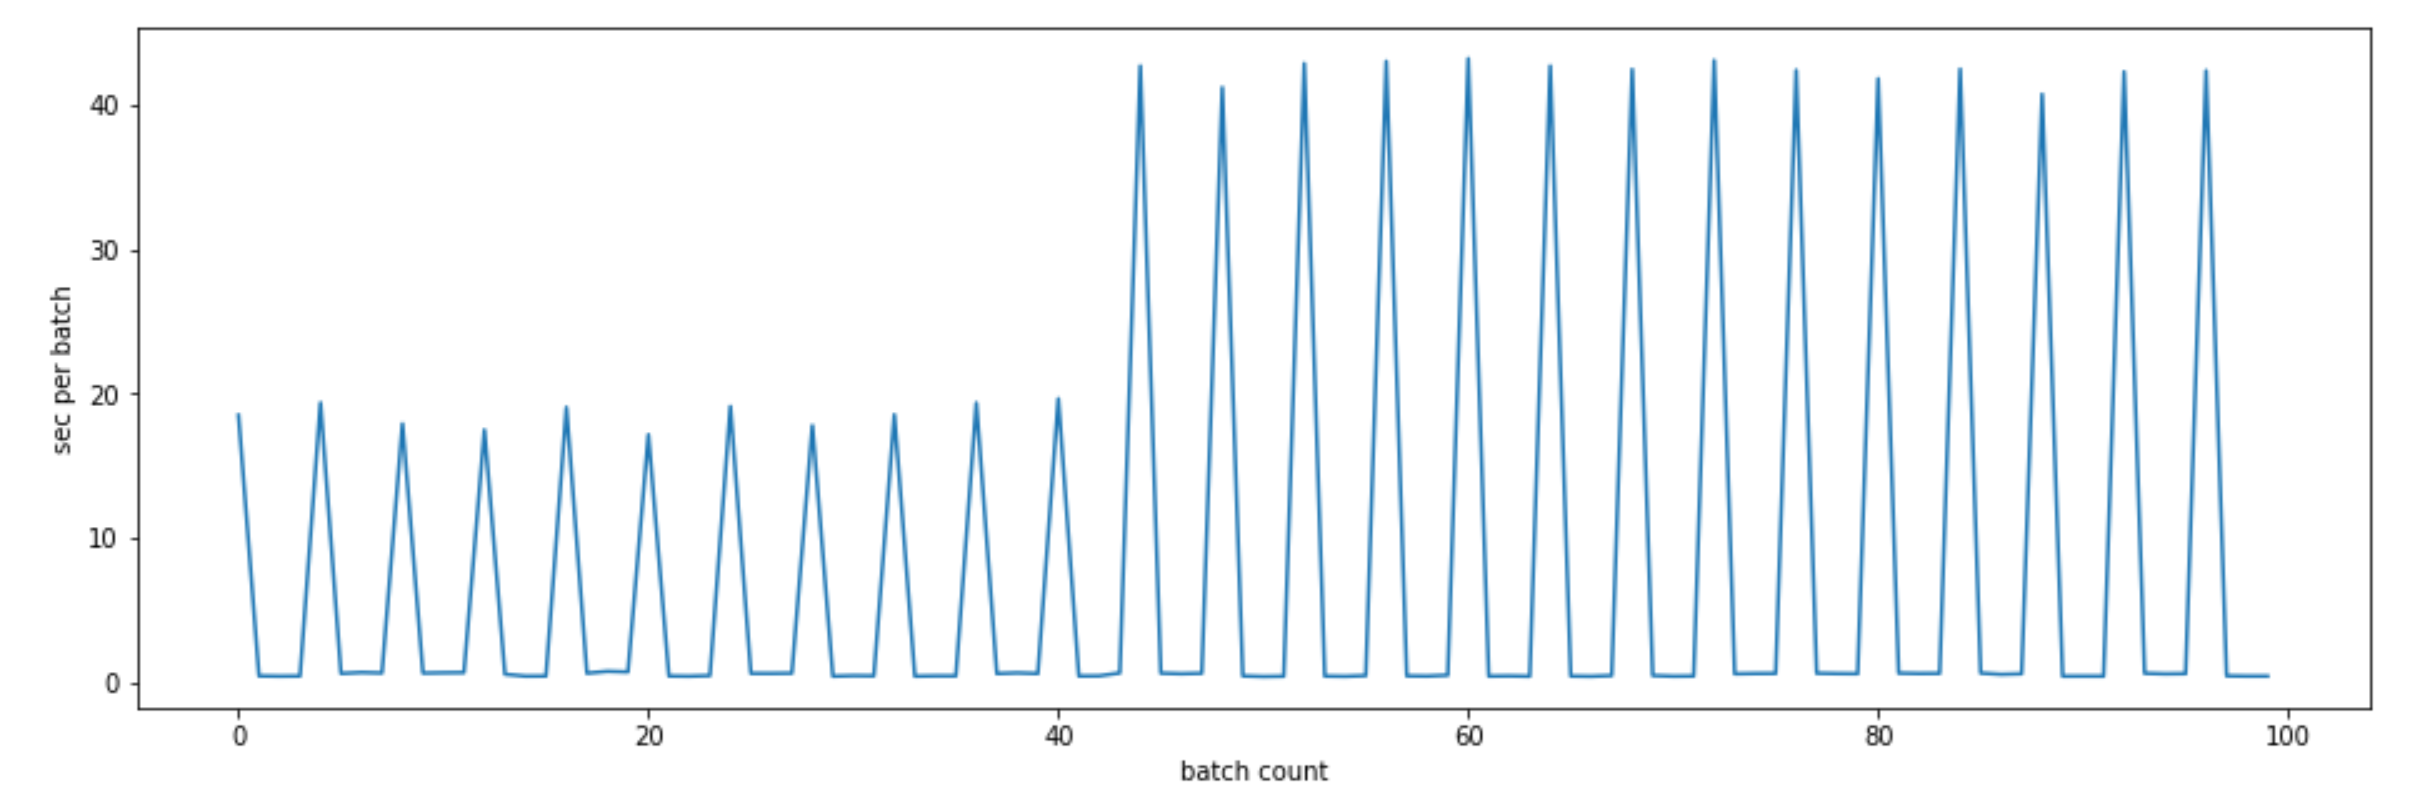
- After a few hundred batches the time per batch of that 4th batch grows again several times. This always happens for bs=16, sometimes happen for bs=8 and I think starts that way from the beginning for bs=32
- High variability between total running times per epoch. Running during the same hour seems to have some consistency, but then running the next day can be 2-3 times slower or faster.
This is the zoom-in into the regime change, batches 600-700 from the image above:
Thank you
 nosound2
All 13 comments
Hi @nosound2 ,
thank you for you nice report!
So the issue about the 4-cycle effects is likely the fact that we have our DataParallel component, which pre-fetches up to 4 batches into the device:
That value is currently not exposed via the DataParallel constructor.
The issue in pre-loading more is that you can run into OOM onto the device.
Just curious, what do you mean for "Regular run" in your first graph?
Seems like, even though there are the spikes at every 4th batch, to wall time (integral of you graphs) of a TPU run should still be lower than the regular run, no?
 dlibenzi
on 12 Aug 2019
dlibenzi
on 12 Aug 2019
One more thing. We just merged a PR which should improve the bandwidth between the User and TPU VMs.
It should show up in nightly tomorrow, and would be nice to see if that helps smoothing the spikes.
In general, besides the spikes, total wall time after N batches is also an interesting measure.
dlibenzi
on 12 Aug 2019
By "regular run" I mean a usual run in this setup. I did many runs trying to change parameters and setup, and usually it looks like this. All my runs are on TPU, and yes even with these issues it is much faster than my local GPU.
Total running time is the best for bs=8, but sometimes it is slow for no apparent reason. It is about 2-3 times faster than bs=16 and bs=32.
Thank you for your response, what recommendations can you give? From your post I conclude that my bottleneck is not TPU, but rather CPU/number of threads or memory size. Should I try to increase some of that? And what does this sudden speed degradation around batch 700 mean? Hitting some memory limits?
I will try the PR tomorrow!
nosound2
on 12 Aug 2019
I tried now to increase num_workers to 24 and it worked much slower. Then decreasing it to 8 actually improved performance. Not sure how to make sense of it.
I have another question, slightly related to the topic.
from API_GUIDE.md:
- "Tensor shapes should be the same between iterations" does it refer to tensors with gradients or any tensor?
- "Loops with a different number of iterations between steps", - what if there are no tensors in the loop? What if there are no tensors with gradients?
Thanks a lot!
nosound2
on 12 Aug 2019
So for "regular run" you mean just another run on TPU?
I am not sure your measure of fast, but a twice as fast bs=8 WRT bs=32 is still twice as slow when accounting the samples/sec throughput (batch for us is per TPU core, not global).
Your best num_workers=8 might be explained by the fact you have 16 vCPUs and running on 8 cores, 8 of them might be better left for tensor data conversions when sending to TPU.
WRT tensor shapes.
Any tensor which is linked to the model computation (forward+backward+gradient_apply).
If within a loop there are no tensors, that is fine.
It might be fine even if there are tensors, as long as the different graph we get is a limited set.
Otherwise we'd spend more time compiling than training.
dlibenzi
on 12 Aug 2019
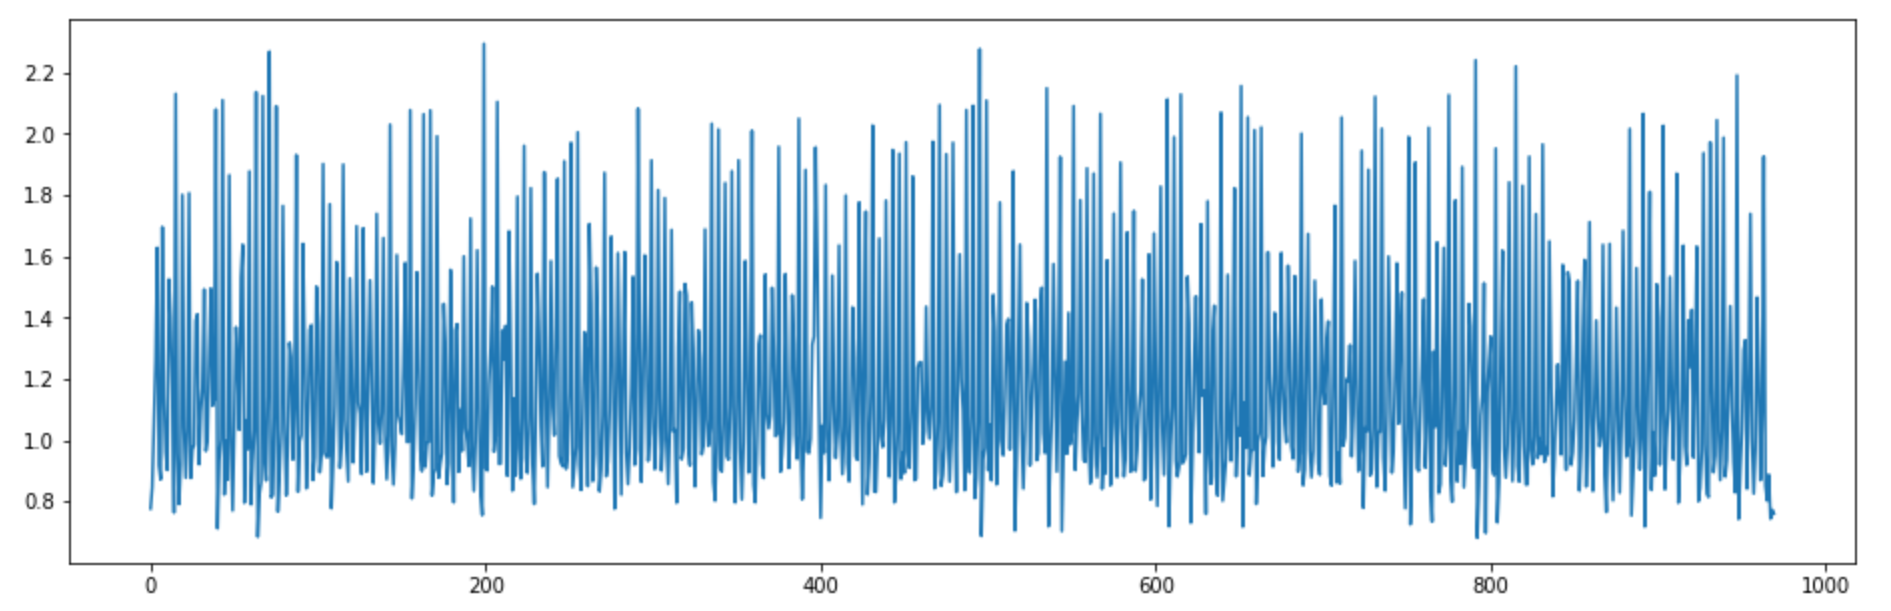
After updating the wheels torch and torch_xla to the latest nightly distribution today, the performance improved for me, about 30-40% improvement in speed. The graph of seconds per batch is much more uniform now, thank you for your work.
nosound2
on 19 Aug 2019
The issue still exists, but I think I was able to isolate it better. With 24 vCPUs, 100 GB memory
TPU v3-8, pytorch-nightly for both TPU and conda, I get the following graph of seconds per batch in case num_workers for the loader is 16:

and a good graph as in the previous message for num_workers = 12. As you mentioned
Your best num_workers=8 might be explained by the fact you have 16 vCPUs and running on 8 cores, 8 of them might be better left for tensor data conversions when sending to TPU.
The total epoch running time is 3662s (num_workers = 16) vs 1140s (num_workers = 12)
nosound2
on 22 Aug 2019
This is not an "issue" per se.
Tuning num_workers depends on CPU cores count.
Today, for a TPU v3-8, we have 8 Python threads (will be changing to processes at some point) driving the models network, and other 8 threads used to upload data to TPU In background.
The former 8 threads, depending on the model, and given the GIL issues, might only achieve partial parallelism (say 50%, so 4 cores usage).
The latter 8 threads do most of the work (converting tensors) with the GIL off, so these might be close to 90% parallelism (so, say 7 cores).
If input pipeline processing (num_workers) eats off the above budget, for certain models (where the workers do some non trivial processing), we might see slowdowns.
dlibenzi
on 22 Aug 2019
This is interesting details, but how does it explain non-continuous nature of the observed behavior? The setup is working in one regime for 400 batches, and then abruptly slows down by a factor of 4.
nosound2
on 22 Aug 2019
Oh, sorry. I thought you meant the discontinuity being the spiked nature of your graph.
In that case, unless the shapes of the data changes, it is a bit weird.
Running free and top within the two sections of your graph might help in looking if there is a sudden memory/CPU pressure.
Printing the metrics and looking at the ones a couple of hundred batches within each section can help as well:
print(torch_xla._XLAC._xla_metrics_report())
Memory is always used on 20-30%. CPU processes are running on 40-70%, and falling to 10% on the slow regime (well, they work less). And it is not related to num_workers, as I claimed before, my mistake. I had both fast and slow runs for both num_workers 8, 12 and 16. Now I have no idea where it comes from, it just comes and go by itself, the slow regime also starts at different times, sometimes from the beginning. One thing I noticed, it is worse in the beginning of the session and then slowly improves. At some point it just starts running fast for all configurations.
nosound2
on 22 Aug 2019
Can you share a link to your model's main loop code?
dlibenzi
on 23 Aug 2019
Closing due to age pending reproduction so we can make progress. @nosound2, please update us if you're still encountering this issue.
 mruberry
on 30 Oct 2019
mruberry
on 30 Oct 2019
Related issues
 CalebEverett
·
4Comments
CalebEverett
·
4Comments
 myleott
·
7Comments
myleott
·
7Comments
 ibeltagy
·
8Comments
mruberry
·
4Comments
nosound2
·
6Comments
ibeltagy
·
8Comments
mruberry
·
4Comments
nosound2
·
6Comments