Wp-calypso: My Home: Stats Card v2
Not ready for implementation. We're still waiting on feedback
1. Stats!
If there are stats to show for the period of time that's visible, we show them. This uses the same logic as the current graph on /stats which seems to change time period depending on how much can comfortably fit in the viewport.
- Page views in the bar graph with x and y axes.
- Most popular day and time for the same time period shown in the graph (or fallback to the last week if necessary).
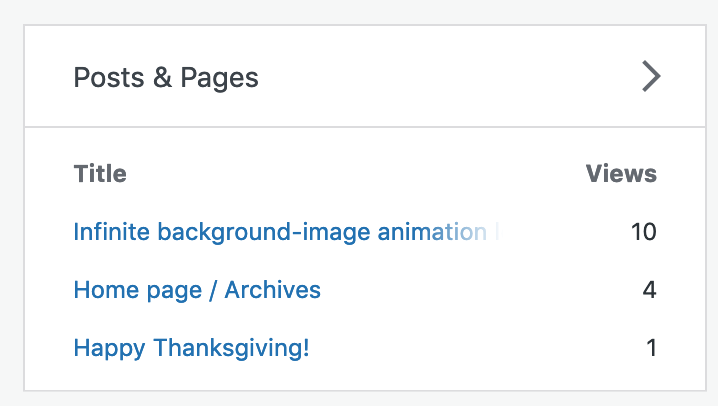
- Top post and page.
- If no blog posts got any hits, we replace top post with total views.
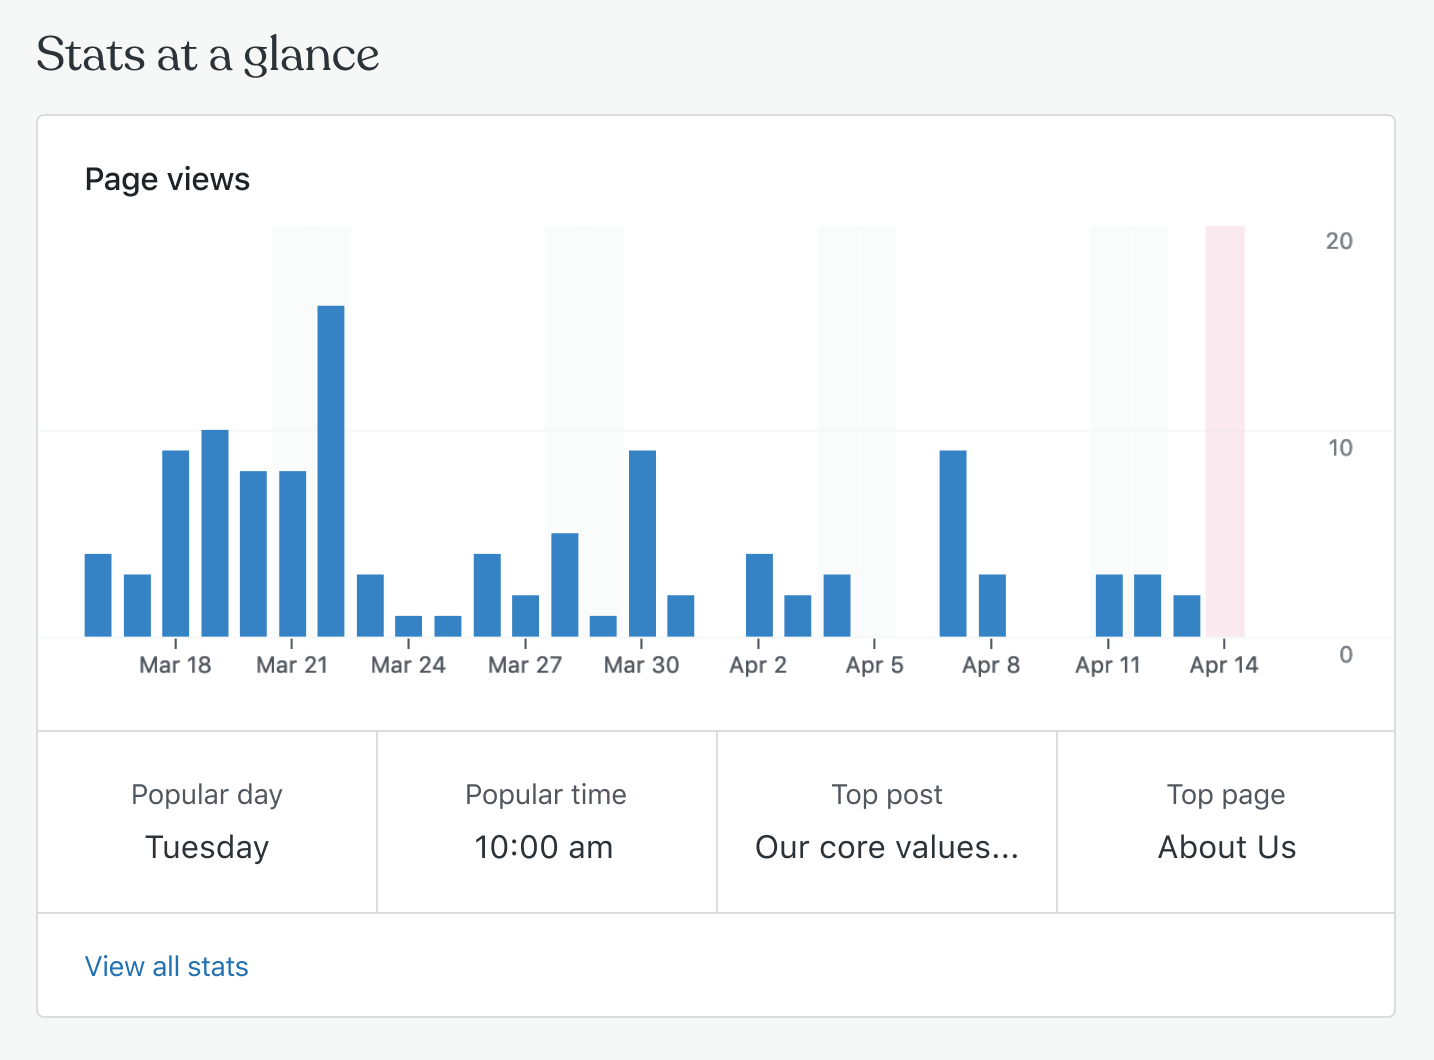
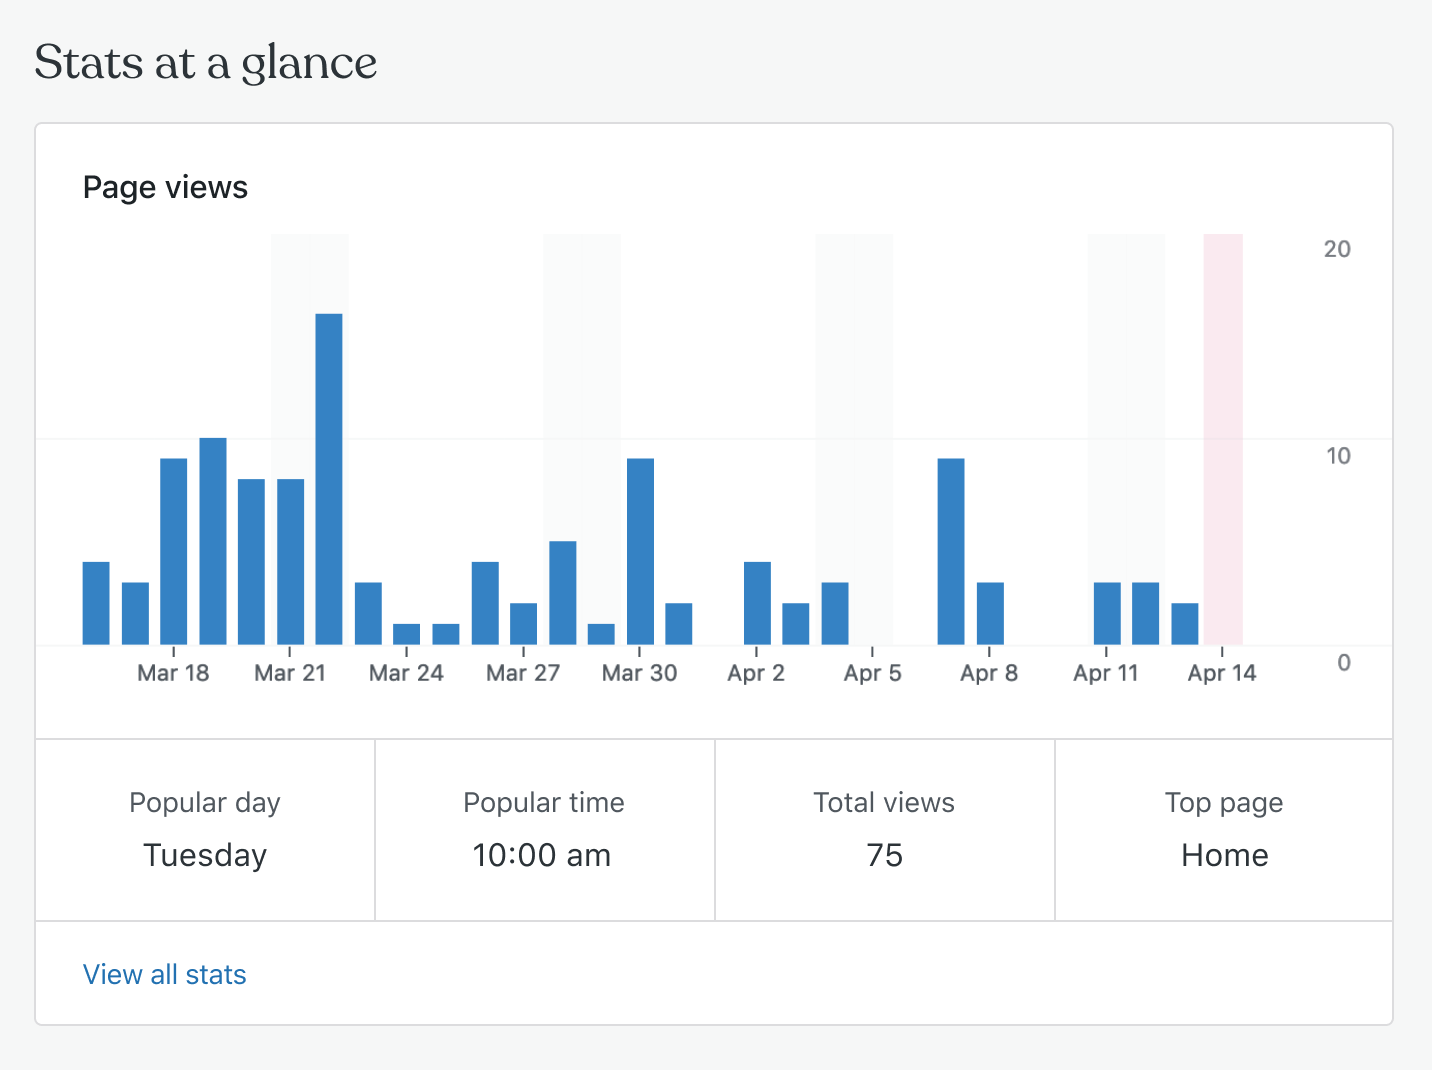
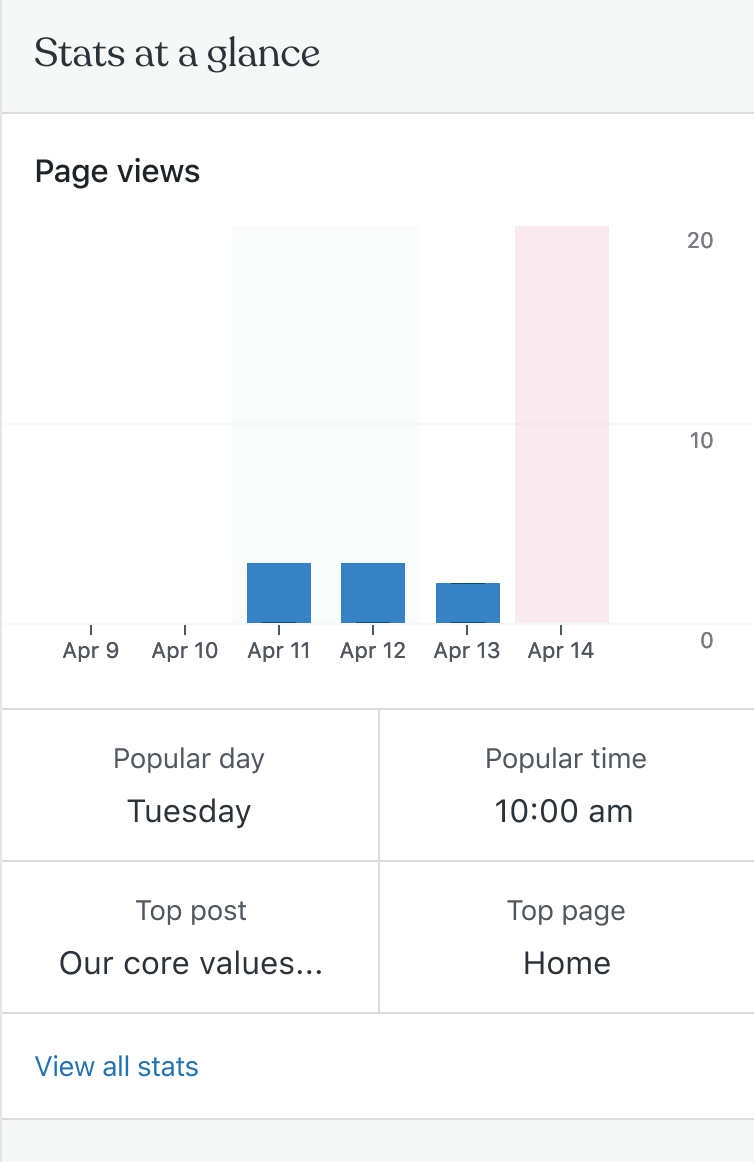
_Feedback: Thoughts on the subtitle "Page views" here? I'd like to make it less jargon-y. I tried removing it but the graph lacks context without something._
2. Pre-launch
Before launching, we set expectations for this section and provide a way to learn more about stats. We keep it lightweight so we don't distract from the primary task at hand (the site setup checklist).
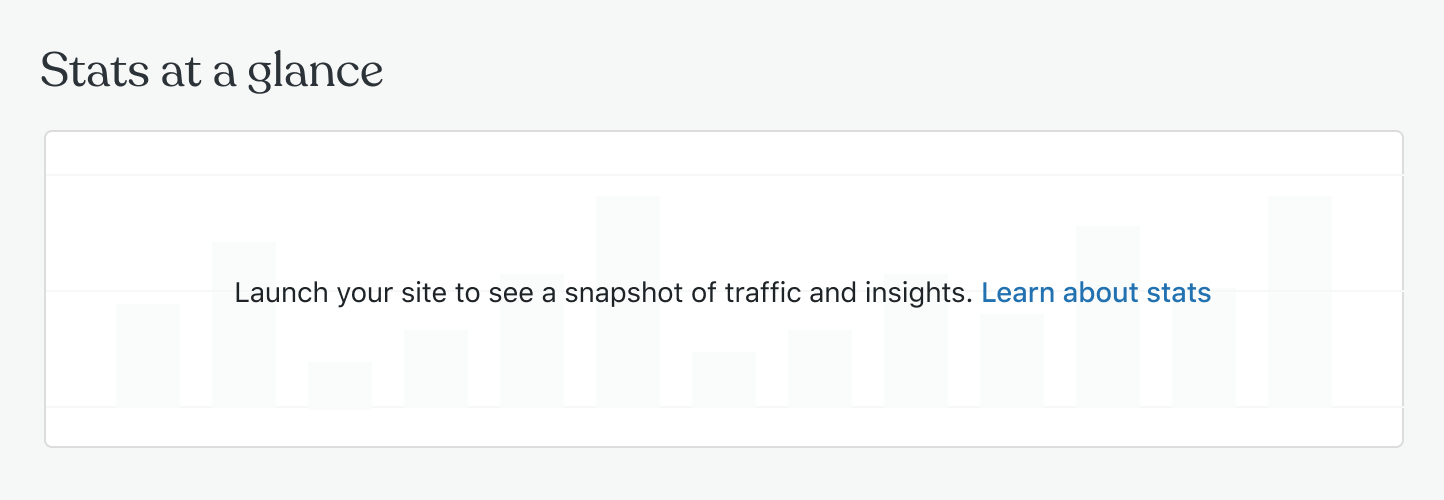
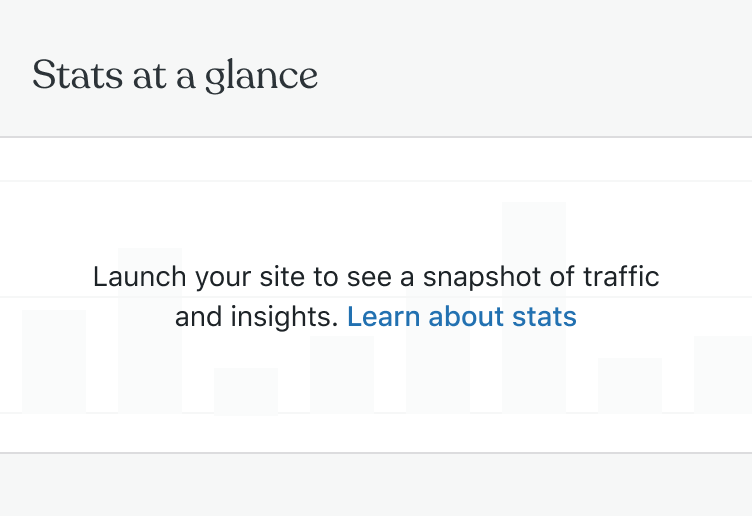
"Learn about stats" opens the Stats support document in a modal.
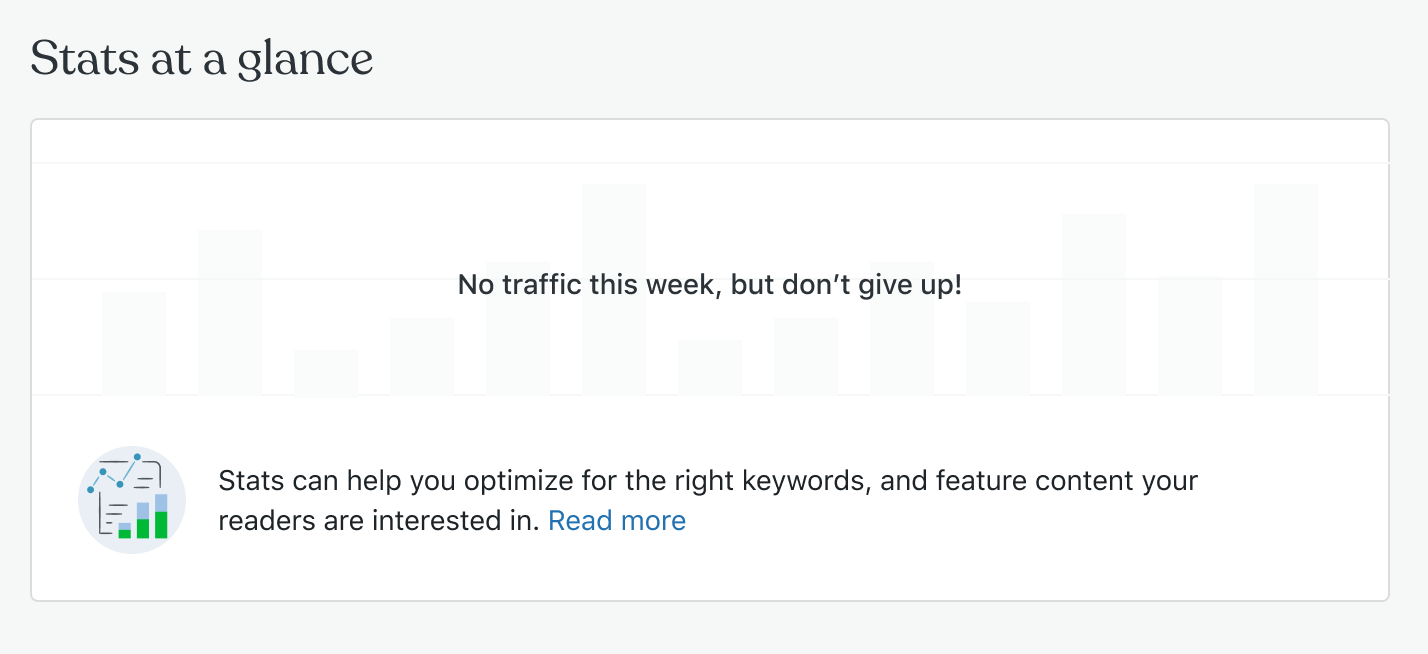
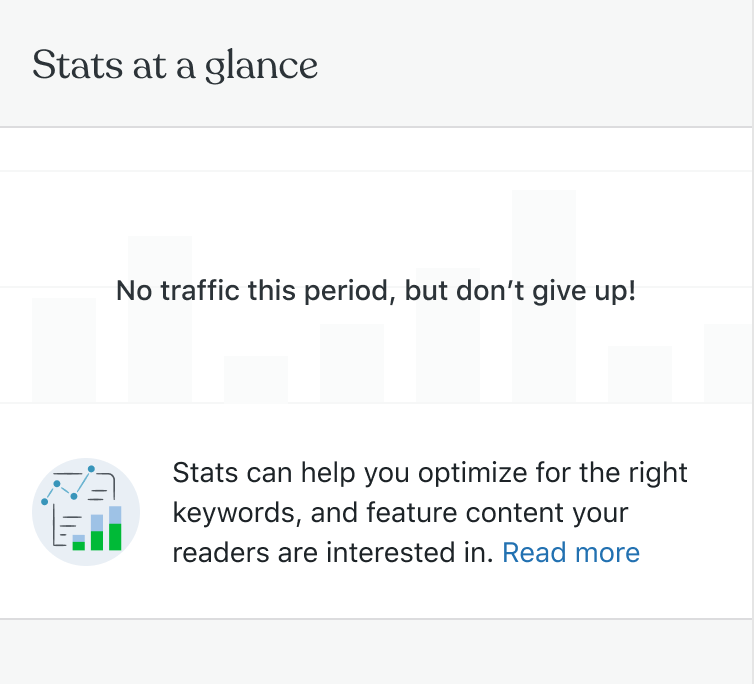
3. Empty stats
If there are no stats to show, we use the empty state to educate users about stats. We can show little encouraging messages and bite-sized info about how to use their stats, what stats are collected, etc. Some thoughts on what helpful info we can show:
- Pull some answers from the FAQ on the stats support doc
- Succinct snippets from WordPress.com/go content like this post or this post
- Coordinate with HEs on what they thing would be helpful based on their experience talking with customers.
4. Stats disabled
We still need a design for if someone disables stats to encourage them to enable stats to get all kinds of good insights.
 gwwar
gwwar
All 10 comments
Here's the latest proposal. This is not ready for implementation as is. It still needs another round of feedback from a wider audience.
As noted above, we'll always show the stats card rather than hiding it like we currently do. It creates a more consistent experience from user to user as well as throughout the entire user journey. Right now it's not clear to users why they sometimes see Stats and sometimes don't.
Because of this, we'll need a few different states for the card outlined below. I'd love to get any feedback or questions you might have on the various states of the card, implementation details, or visual nitpicks. @Automattic/dotcom-manage-design
1. Stats!
If there are stats to show for the period of time that's visible, we show them. This uses the same logic as the current graph on /stats which seems to change time period depending on how much can comfortably fit in the viewport.
- Page views in the bar graph with x and y axes.
- Most popular day and time for the same time period shown in the graph (or fallback to the last week if necessary).
- Top post and page.
- If no blog posts got any hits, we replace top post with total views.
_Feedback: Thoughts on the subtitle "Page views" here? I'd like to make it less jargon-y. I tried removing it but the graph lacks context without something._
2. Pre-launch
Before launching, we set expectations for this section and provide a way to learn more about stats. We keep it lightweight so we don't distract from the primary task at hand (the site setup checklist).
"Learn about stats" opens the Stats support document in a modal.
3. Empty stats
If there are no stats to show, we use the empty state to educate users about stats. We can show little encouraging messages and bite-sized info about how to use their stats, what stats are collected, etc. Some thoughts on what helpful info we can show:
- Pull some answers from the FAQ on the stats support doc
- Succinct snippets from WordPress.com/go content like this post or this post
- Coordinate with HEs on what they thing would be helpful based on their experience talking with customers.
4. Stats disabled
We still need a design for if someone disables stats to encourage them to enable stats to get all kinds of good insights.
 danhauk
on 15 Apr 2020
danhauk
on 15 Apr 2020
Thanks I've updated the summary to reflect the latest
gwwar
on 15 Apr 2020
Awesome work @danhauk! Some quick feedback/questions:
This uses the same logic as the current graph on /stats which seems to change time period depending on how much can comfortably fit in the viewport.
It also depends on the selected segment.
Should we retrieve the daily visits which is the default segment when going to /stats?
Top post and page.
Do we currently display this anywhere else? Just wondering if this is a new functionality we need to implement or if it's ready to use somewhere.
Thoughts on the subtitle "Page views" here? I'd like to make it less jargon-y. I tried removing it but the graph lacks context without something.
"Page views" sounds good to me 👍.
Pull some answers from the FAQ on the stats support doc
Succinct snippets from WordPress.com/go content like this post or this post
I like this for showing when there is no traffic to the site yet. From a technical point of view I don't think we have any API endpoint where we can pull these, so rather than fetching the pages/docs and parsing the answers from it, as a start I'd recommend to just hardcode a few on Calypso and randomly show one of them.
 mmtr
on 17 Apr 2020
mmtr
on 17 Apr 2020
Should we retrieve the daily visits which is the default segment when going to /stats?
To start, we'll go with daily visits. In an ideal world it would be great to always see some kind of stats there. For example, if there haven't been any visits in the last week, maybe we show a weekly graph or monthly graph. But that logic hasn't been thought through completely yet.
Do we currently display this anywhere else?
We do display what I think are top posts and pages on /stats. They're dependent on the segment selected, so we'll probably need to make sure they're weekly.
so rather than fetching the pages/docs and parsing the answers from it, as a start I'd recommend to just hardcode a few on Calypso and randomly show one of them.
I definitely agree with this as a first implementation. We can work with Happiness to pull out the best bite-sized insights to show there.
danhauk
on 21 Apr 2020
Thoughts on the subtitle "Page views" here? I'd like to make it less jargon-y. I tried removing it but the graph lacks context without something.
"Page views" sounds good to me 👍.
On a second thought, we may want to make clear these views also include post views and are not specific to the site pages. Can we maybe simplify it to just "Views"?
mmtr
on 24 Apr 2020
We still need a design for if someone disables stats to encourage them to enable stats to get all kinds of good insights.
Not sure about this, shouldn't we respect the user choice of having stats turned off? I certainly would be a bit disappointed if I'm encouraged to enable stats when I deactivated the stats module for whatever reason.
mmtr
on 24 Apr 2020
If no blog posts got any hits, we replace top post with total views.
To clarify, these are the total views for the current day, right?
Also, what if we don't have any top page? Should we replace it with something else?
mmtr
on 24 Apr 2020
I know this is not ready for full implementation yet, but wanted to start a PR exploring what's being proposed here: https://github.com/Automattic/wp-calypso/pull/41441
My goal with that PR is to identify potential blockers if any, start implementing the most definitive part (such as the chart or the placeholder for unlaunched tasks) and accelerate the discussion here on the non-definitive part so we can have a final agreement.
mmtr
on 24 Apr 2020
We do display what I think are top posts and pages on
/stats. They're dependent on the segment selected, so we'll probably need to make sure they're weekly.
I noted we currently don't provide separate stats for top posts and top pages. They are combined and the API returns just the 10 content items with more views. If for any reason all of them are the same type, we cannot now the top item for the type.
In other words, that means that we cannot know what's the top post if the top 10 content items are pages (and vice versa, we cannot know the top page if top content items are all posts).
But maybe that's not a big deal? We can always fallback to other stats such as views or visitors if a post or page is not given in the top 10 content items.
mmtr
on 24 Apr 2020
@mmtr Thanks for all the info here! Let me answer these questions that I missed.
Not sure about this, shouldn't we respect the user choice of having stats turned off? I certainly would be a bit disappointed if I'm encouraged to enable stats when I deactivated the stats module for whatever reason.
This makes a lot of sense, though we do currently have something like this in the Stats section:
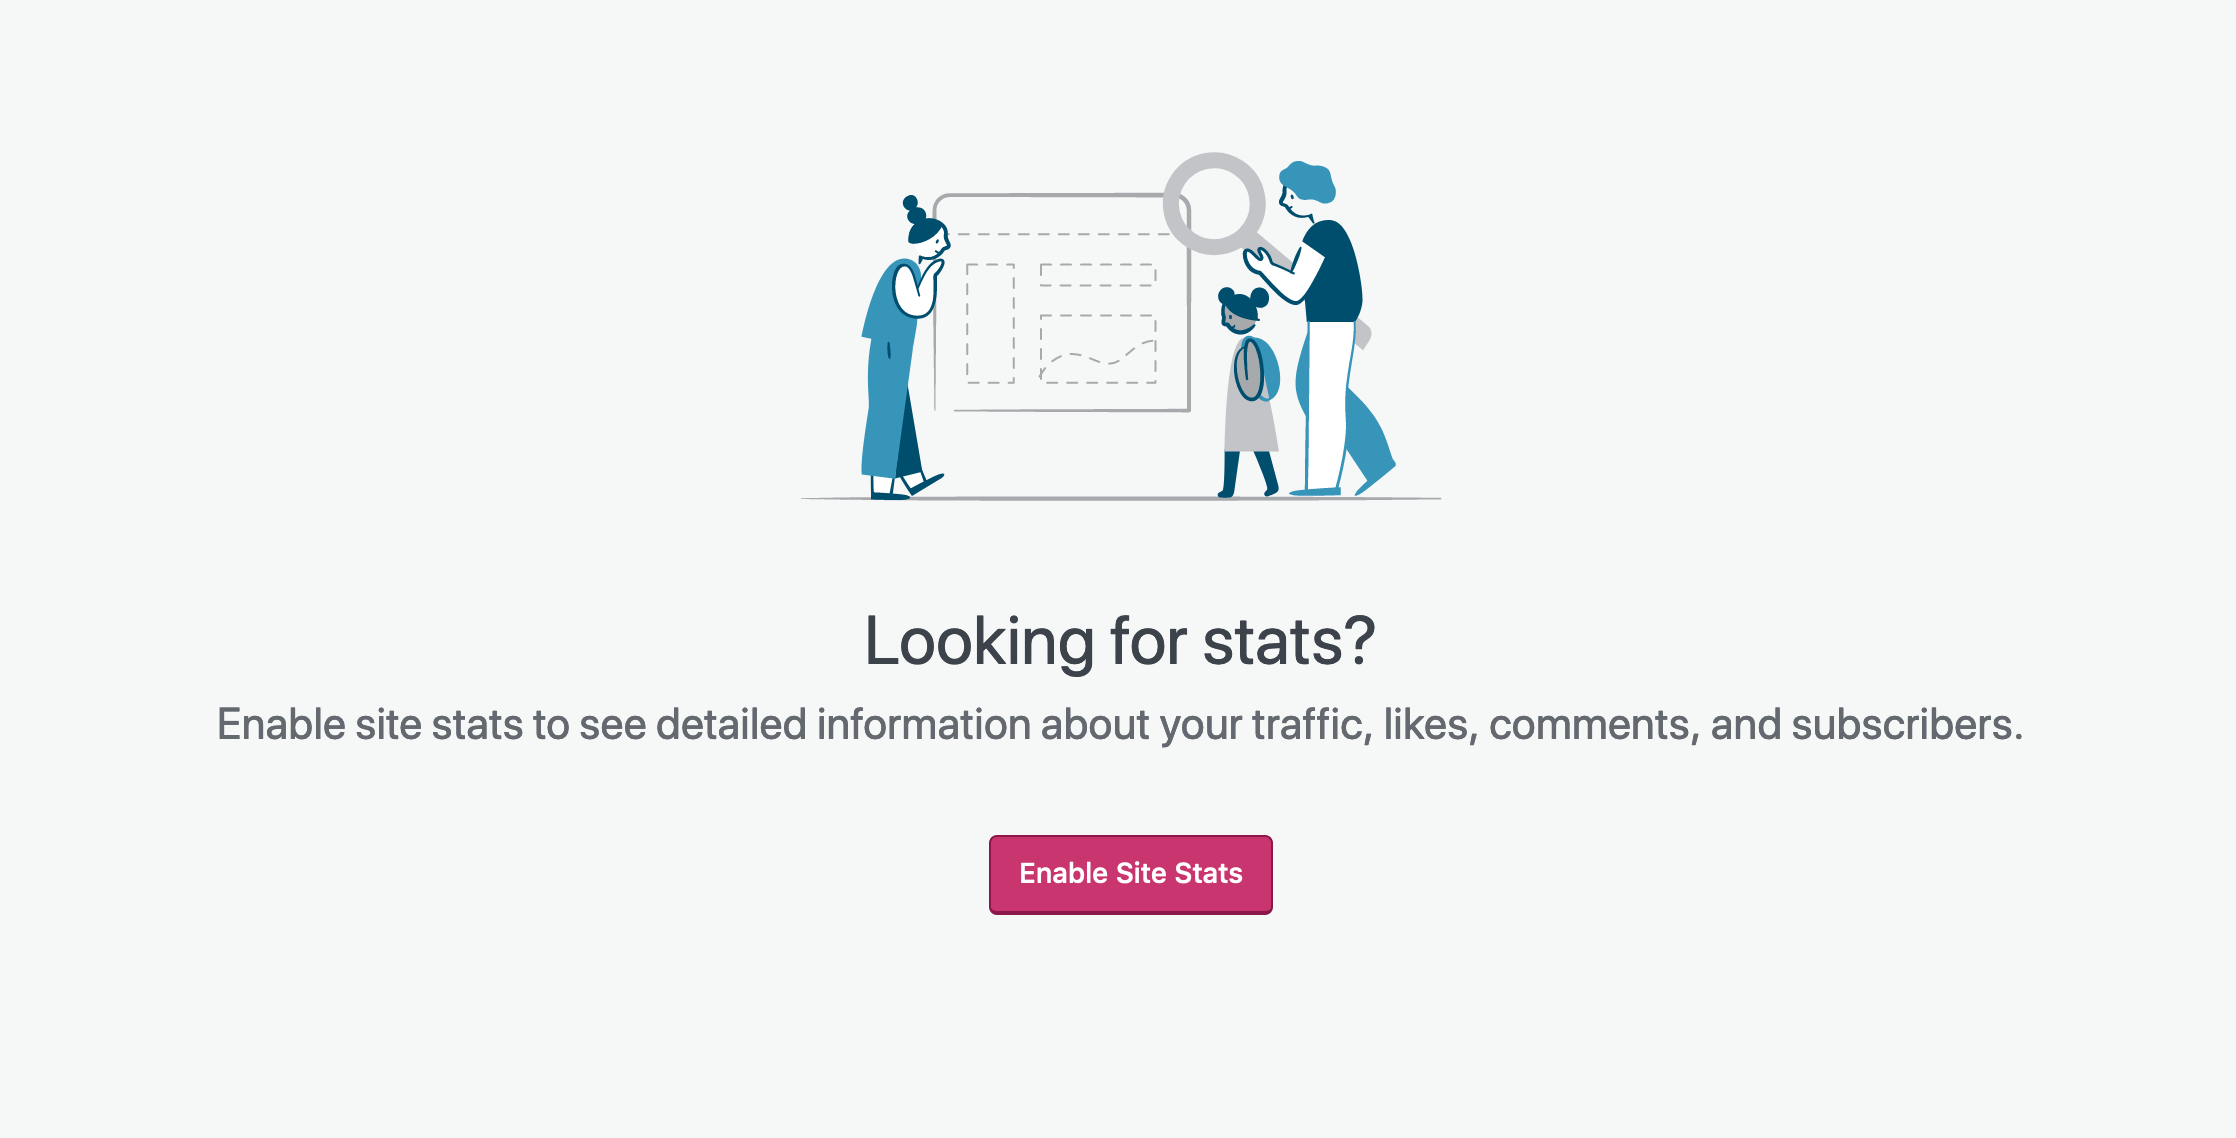
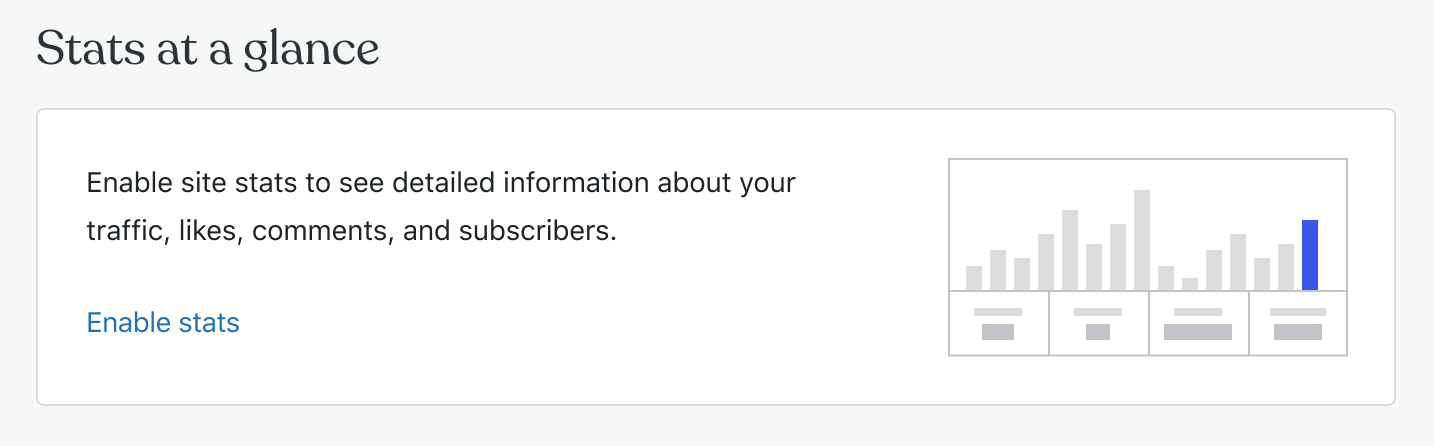
Are there any cases where someone might have stats turned off and not know about it? I don't want someone to not have stats because they're not aware they're available. I was thinking the prompt would be something more subtle than the screenshot above:
To clarify, these are the total views for the current day, right?
Sorry, this was meant to be total views for the week.
But maybe that's not a big deal? We can always fallback to other stats such as views or visitors if a post or page is not given in the top 10 content items.
Yeah I think it's safe to fall back to total views if all the top 10 content items are the same type.
danhauk
on 29 Apr 2020
Related issues
 samouri
·
3Comments
samouri
·
3Comments
 hoverduck
·
3Comments
samouri
·
3Comments
hoverduck
·
3Comments
samouri
·
3Comments
 ehg
·
3Comments
ehg
·
3Comments
 kellychoffman
·
3Comments
kellychoffman
·
3Comments
Most helpful comment
Here's the latest proposal. This is not ready for implementation as is. It still needs another round of feedback from a wider audience.
As noted above, we'll always show the stats card rather than hiding it like we currently do. It creates a more consistent experience from user to user as well as throughout the entire user journey. Right now it's not clear to users why they sometimes see Stats and sometimes don't.
Because of this, we'll need a few different states for the card outlined below. I'd love to get any feedback or questions you might have on the various states of the card, implementation details, or visual nitpicks. @Automattic/dotcom-manage-design
1. Stats!
If there are stats to show for the period of time that's visible, we show them. This uses the same logic as the current graph on /stats which seems to change time period depending on how much can comfortably fit in the viewport.
_Feedback: Thoughts on the subtitle "Page views" here? I'd like to make it less jargon-y. I tried removing it but the graph lacks context without something._
2. Pre-launch
Before launching, we set expectations for this section and provide a way to learn more about stats. We keep it lightweight so we don't distract from the primary task at hand (the site setup checklist).
"Learn about stats" opens the Stats support document in a modal.
3. Empty stats
If there are no stats to show, we use the empty state to educate users about stats. We can show little encouraging messages and bite-sized info about how to use their stats, what stats are collected, etc. Some thoughts on what helpful info we can show:
4. Stats disabled
We still need a design for if someone disables stats to encourage them to enable stats to get all kinds of good insights.