Windows_exporter: Error on Exchange Server
Hi,
i have update the exporter to 0.8.
Now we become this error:
An error has occurred during metrics gathering:

error collecting metric Desc{fqName: "wmi_exporter_collector_success", help: "wmi_exporter: Whether the collector was successful.", constLabels: {}, variableLabels: [collector]}: failed to prepare scrape: ReqQueryValueEx failed: Die angeforderte Ressource wird bereits verwendet. errno 170
Enabled collectors: net, os, service, system, textfile, cpu, cs, logical_disk
 pasarn
All 37 comments
Hi @pasarn,
Thanks for reporting! This seems to be an issue with the new Perflib integration. Could you share your Windows version, if you've made any customizations in the install etc?
 carlpett
on 6 Aug 2019
carlpett
on 6 Aug 2019
Also, do you have other servers where you do not see this problem?
carlpett
on 6 Aug 2019
This server does't work:
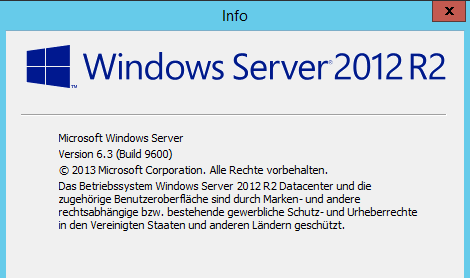
An other server with the same OS Build have no problem. A deference is the cpu cores. The working server have 4 and the other 8.
pasarn
on 6 Aug 2019
It seems this problem would be caused by something else locking the performance counters registry key. Does it happen on every scrape or just sometimes? I haven't seen it locked during a long period, but something else could have a bug causing it not to be released.
Some troubleshooting steps:
- Does running the Windows Performance Monitor (perfmon) work? How about
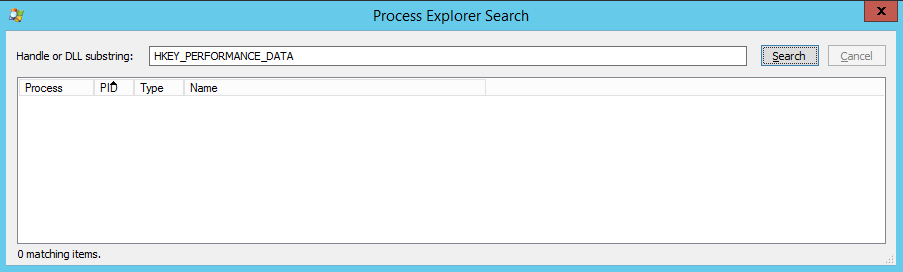
typeperf, for example runningtypeperf -qx Processorin a command line prompt? - Check what is holding the lock on HKEY_PERFORMANCE_DATA with Process Explorer.
carlpett
on 6 Aug 2019
It is on every scrape.
Output form typeperf:
C:\Windows\system32>typeperf -qx Prozessor
\Prozessor(0)\Prozessorzeit (%)
\Prozessor(1)\Prozessorzeit (%)
\Prozessor(2)\Prozessorzeit (%)
\Prozessor(3)\Prozessorzeit (%)
\Prozessor(4)\Prozessorzeit (%)
\Prozessor(5)\Prozessorzeit (%)
\Prozessor(6)\Prozessorzeit (%)
\Prozessor(7)\Prozessorzeit (%)
\Prozessor(_Total)\Prozessorzeit (%)
\Prozessor(0)\Benutzerzeit (%)
\Prozessor(1)\Benutzerzeit (%)
\Prozessor(2)\Benutzerzeit (%)
\Prozessor(3)\Benutzerzeit (%)
\Prozessor(4)\Benutzerzeit (%)
\Prozessor(5)\Benutzerzeit (%)
\Prozessor(6)\Benutzerzeit (%)
\Prozessor(7)\Benutzerzeit (%)
\Prozessor(_Total)\Benutzerzeit (%)
\Prozessor(0)\Privilegierte Zeit (%)
\Prozessor(1)\Privilegierte Zeit (%)
\Prozessor(2)\Privilegierte Zeit (%)
\Prozessor(3)\Privilegierte Zeit (%)
\Prozessor(4)\Privilegierte Zeit (%)
\Prozessor(5)\Privilegierte Zeit (%)
\Prozessor(6)\Privilegierte Zeit (%)
\Prozessor(7)\Privilegierte Zeit (%)
\Prozessor(_Total)\Privilegierte Zeit (%)
\Prozessor(0)\Interrupts/s
\Prozessor(1)\Interrupts/s
\Prozessor(2)\Interrupts/s
\Prozessor(3)\Interrupts/s
\Prozessor(4)\Interrupts/s
\Prozessor(5)\Interrupts/s
\Prozessor(6)\Interrupts/s
\Prozessor(7)\Interrupts/s
\Prozessor(_Total)\Interrupts/s
\Prozessor(0)\DPC-Zeit (%)
\Prozessor(1)\DPC-Zeit (%)
\Prozessor(2)\DPC-Zeit (%)
\Prozessor(3)\DPC-Zeit (%)
\Prozessor(4)\DPC-Zeit (%)
\Prozessor(5)\DPC-Zeit (%)
\Prozessor(6)\DPC-Zeit (%)
\Prozessor(7)\DPC-Zeit (%)
\Prozessor(_Total)\DPC-Zeit (%)
\Prozessor(0)\Interruptzeit (%)
\Prozessor(1)\Interruptzeit (%)
\Prozessor(2)\Interruptzeit (%)
\Prozessor(3)\Interruptzeit (%)
\Prozessor(4)\Interruptzeit (%)
\Prozessor(5)\Interruptzeit (%)
\Prozessor(6)\Interruptzeit (%)
\Prozessor(7)\Interruptzeit (%)
\Prozessor(_Total)\Interruptzeit (%)
\Prozessor(0)\DPCs in Warteschlange/s
\Prozessor(1)\DPCs in Warteschlange/s
\Prozessor(2)\DPCs in Warteschlange/s
\Prozessor(3)\DPCs in Warteschlange/s
\Prozessor(4)\DPCs in Warteschlange/s
\Prozessor(5)\DPCs in Warteschlange/s
\Prozessor(6)\DPCs in Warteschlange/s
\Prozessor(7)\DPCs in Warteschlange/s
\Prozessor(_Total)\DPCs in Warteschlange/
\Prozessor(0)\DPC-Rate
\Prozessor(1)\DPC-Rate
\Prozessor(2)\DPC-Rate
\Prozessor(3)\DPC-Rate
\Prozessor(4)\DPC-Rate
\Prozessor(5)\DPC-Rate
\Prozessor(6)\DPC-Rate
\Prozessor(7)\DPC-Rate
\Prozessor(_Total)\DPC-Rate
\Prozessor(0)\Leerlaufzeit (%)
\Prozessor(1)\Leerlaufzeit (%)
\Prozessor(2)\Leerlaufzeit (%)
\Prozessor(3)\Leerlaufzeit (%)
\Prozessor(4)\Leerlaufzeit (%)
\Prozessor(5)\Leerlaufzeit (%)
\Prozessor(6)\Leerlaufzeit (%)
\Prozessor(7)\Leerlaufzeit (%)
\Prozessor(_Total)\Leerlaufzeit (%)
\Prozessor(0)\% C1-Zeit
\Prozessor(1)\% C1-Zeit
\Prozessor(2)\% C1-Zeit
\Prozessor(3)\% C1-Zeit
\Prozessor(4)\% C1-Zeit
\Prozessor(5)\% C1-Zeit
\Prozessor(6)\% C1-Zeit
\Prozessor(7)\% C1-Zeit
\Prozessor(_Total)\% C1-Zeit
\Prozessor(0)\% C2-Zeit
\Prozessor(1)\% C2-Zeit
\Prozessor(2)\% C2-Zeit
\Prozessor(3)\% C2-Zeit
\Prozessor(4)\% C2-Zeit
\Prozessor(5)\% C2-Zeit
\Prozessor(6)\% C2-Zeit
\Prozessor(7)\% C2-Zeit
\Prozessor(_Total)\% C2-Zeit
\Prozessor(0)\% C3-Zeit
\Prozessor(1)\% C3-Zeit
\Prozessor(2)\% C3-Zeit
\Prozessor(3)\% C3-Zeit
\Prozessor(4)\% C3-Zeit
\Prozessor(5)\% C3-Zeit
\Prozessor(6)\% C3-Zeit
\Prozessor(7)\% C3-Zeit
\Prozessor(_Total)\% C3-Zeit
\Prozessor(0)\C1-Übergänge/s
\Prozessor(1)\C1-Übergänge/s
\Prozessor(2)\C1-Übergänge/s
\Prozessor(3)\C1-Übergänge/s
\Prozessor(4)\C1-Übergänge/s
\Prozessor(5)\C1-Übergänge/s
\Prozessor(6)\C1-Übergänge/s
\Prozessor(7)\C1-Übergänge/s
\Prozessor(_Total)\C1-Übergänge/s
\Prozessor(0)\C2-Übergänge/s
\Prozessor(1)\C2-Übergänge/s
\Prozessor(2)\C2-Übergänge/s
\Prozessor(3)\C2-Übergänge/s
\Prozessor(4)\C2-Übergänge/s
\Prozessor(5)\C2-Übergänge/s
\Prozessor(6)\C2-Übergänge/s
\Prozessor(7)\C2-Übergänge/s
\Prozessor(_Total)\C2-Übergänge/s
\Prozessor(0)\C3-Übergänge/s
\Prozessor(1)\C3-Übergänge/s
\Prozessor(2)\C3-Übergänge/s
\Prozessor(3)\C3-Übergänge/s
\Prozessor(4)\C3-Übergänge/s
\Prozessor(5)\C3-Übergänge/s
\Prozessor(6)\C3-Übergänge/s
\Prozessor(7)\C3-Übergänge/s
\Prozessor(_Total)\C3-Übergänge/s

Der Befehl wurde erfolgreich ausgeführt.
There is no Handle on HKEY_PERFORMANCE_DATA
pasarn
on 6 Aug 2019
Hm, ok, looks like that actually doesn't find anything on my system either. What about HKLM\SOFTWARE\Microsoft\Windows NT\CurrentVersion\Perflib?
Did you install via the msi, or are you running some custom installation?
carlpett
on 6 Aug 2019
On this hive are many handles:
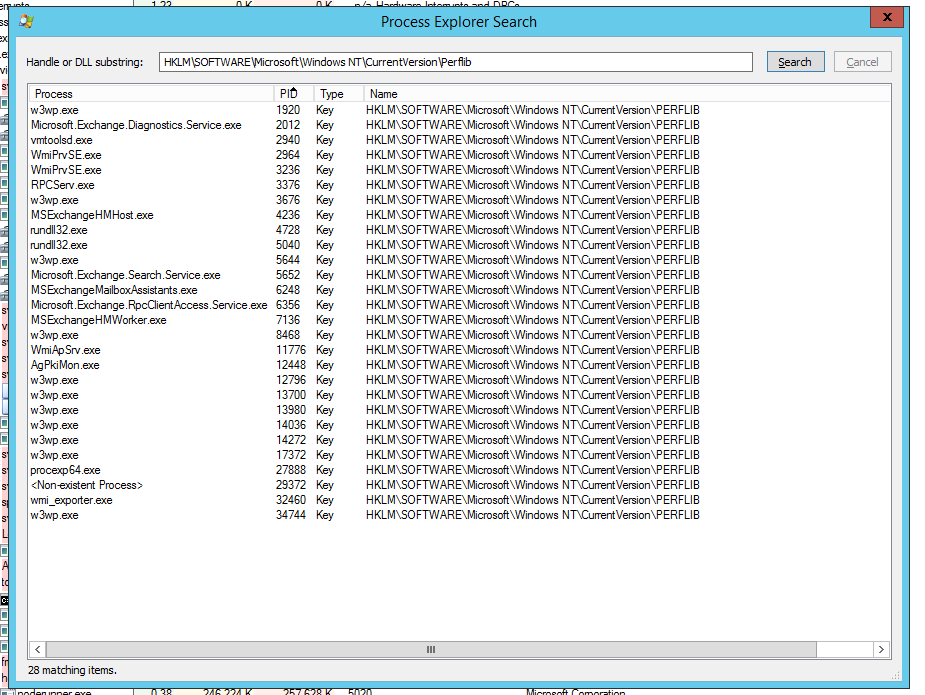
I used the MSI Installer without parameters.
pasarn
on 7 Aug 2019
Hm. <Non-existent Process> looks odd. _Could be_ that it is the remains of something that crashed while holding a lock... (But then I don't see why perfmon would work)
@leoluk, any ideas?
I'm not very happy about suggesting a reboot, but otherwise I don't have any other ideas at the moment. Would it be possible to do a reboot?
carlpett
on 8 Aug 2019
The
A reboot is no option at the moment. I must speak with our Exchange team to plan the reboot. I think on the next patchday.
pasarn
on 8 Aug 2019
I have restart the wmi_exporter service. Now i receive Metrics but it is realy slow.
# HELP wmi_exporter_build_info A metric with a constant '1' value labeled by version, revision, branch, and goversion from which wmi_exporter was built.
# TYPE wmi_exporter_build_info gauge
wmi_exporter_build_info{branch="master",goversion="go1.12.3",revision="d01c66986cec25928693b123d0b2155220fdd540",version="0.8.0"} 1
# HELP wmi_exporter_collector_duration_seconds wmi_exporter: Duration of a collection.
# TYPE wmi_exporter_collector_duration_seconds gauge
wmi_exporter_collector_duration_seconds{collector="cpu"} 0
wmi_exporter_collector_duration_seconds{collector="cs"} 0.076783
wmi_exporter_collector_duration_seconds{collector="logical_disk"} 0.1027844
wmi_exporter_collector_duration_seconds{collector="net"} 0.1338915
wmi_exporter_collector_duration_seconds{collector="os"} 0.0637798
wmi_exporter_collector_duration_seconds{collector="system"} 0.1536835
wmi_exporter_collector_duration_seconds{collector="textfile"} 0
# HELP wmi_exporter_collector_success wmi_exporter: Whether the collector was successful.
# TYPE wmi_exporter_collector_success gauge
wmi_exporter_collector_success{collector="cpu"} 1
wmi_exporter_collector_success{collector="cs"} 1
wmi_exporter_collector_success{collector="logical_disk"} 1
wmi_exporter_collector_success{collector="net"} 1
wmi_exporter_collector_success{collector="os"} 1
wmi_exporter_collector_success{collector="system"} 1
wmi_exporter_collector_success{collector="textfile"} 1
# HELP wmi_exporter_collector_timeout wmi_exporter: Whether the collector timed out.
# TYPE wmi_exporter_collector_timeout gauge
wmi_exporter_collector_timeout{collector="cpu"} 0
wmi_exporter_collector_timeout{collector="cs"} 0
wmi_exporter_collector_timeout{collector="logical_disk"} 0
wmi_exporter_collector_timeout{collector="net"} 0
wmi_exporter_collector_timeout{collector="os"} 0
wmi_exporter_collector_timeout{collector="system"} 0
wmi_exporter_collector_timeout{collector="textfile"} 0
# HELP wmi_exporter_perflib_snapshot_duration_seconds Duration of perflib snapshot capture
# TYPE wmi_exporter_perflib_snapshot_duration_seconds gauge
wmi_exporter_perflib_snapshot_duration_seconds 137.0020984
Interesting that a restart of the service helped :thinking:
But this is strange: wmi_exporter_perflib_snapshot_duration_seconds 137.0020984. It typically takes a couple of hundred milliseconds, not several minutes... Is the machine under heavy load?
carlpett
on 8 Aug 2019
The load is ok. Between 40% and 50%
pasarn
on 8 Aug 2019
This sounds like one of the perflib DLLs timing out. Which objects does wmi_exporter request?
The registry hive is "fake" so there are no handles.
 leoluk
on 8 Aug 2019
leoluk
on 8 Aug 2019
Hi All,
I was able to reproduce the issue on one of our older VM's. The scrape was taking less than a second and was working fine for few hours until one of my colleagues logged in and forr unknown reason explorer.exe started using 100% CPU. Immediately after that wmi_exporter started crashing and threw the same error as @pasarn reported.
An error has occurred during metrics gathering: error collecting metric Desc{fqName: "wmi_exporter_collector_success", help: "wmi_exporter: Whether the collector was successful.", constLabels: {}, variableLabels: [collector]}: failed to prepare scrape: ReqQueryValueEx failed: The requested resource is in use. errno 170
This is a staging VM so I can help with troubleshooting if needed. I will try to get the CPU to 100% and see if this is happening every time...
 zoransimeonov
on 8 Aug 2019
zoransimeonov
on 8 Aug 2019
@leoluk For now we went with Global, to keep it simple. I have a branch where I added some smarts to it, but since all the machines I tested on returned Global in < 300 ms, it seemed fast enough.
@zoransimeonov Thanks! Will be interesting if it is consistent - I did a lot of testing under 100% load scenarios since that is when we've had the most issues with WMI. Perhaps there is some difference in what happens during testing (I just use CPUSTRES from SysInternals) and your case.
carlpett
on 8 Aug 2019
I've tried various sequences of starting before, during and after stress loads, and also launching multiple copies of wmi_exporter and having them query simultaneously. Still haven't managed to reproduce.
@zoransimeonov is your VM the same version of Windows as @pasarn?
carlpett
on 8 Aug 2019
Easy to reproduce if it hits 100% CPU load. The moment CPU usage drops it continues working.
Bumping the CPU Priority helps with obtaining the snapshot. I do not think we are experiencing locking of the performance counters registry key but might be wrong...
Winver: Windows Server 2008 R2 Enterprise, Version 6.1 (Build 7601, Service Pack 1)
100% CPU Load. Wmi_Exporter running with "Normal" CPU Priority
"C:\Program Files\wmi_exporter\wmi_exporter.exe" --log.format logger:eventlog?name=wmi_exporter --collectors.enabled cpu,textfile --telemetry.addr :9182
An error has occurred during metrics gathering: error collecting metric Desc{fqName: "wmi_exporter_collector_success", help: "wmi_exporter: Whether the collector was successful.", constLabels: {}, variableLabels: [collector]}: failed to prepare scrape: ReqQueryValueEx failed: The requested resource is in use. errno 170
100% CPU Load. Wmi_Exporter running with "High" CPU Priority
"C:\Program Files\wmi_exporter\wmi_exporter.exe" --log.format logger:eventlog?name=wmi_exporter --collectors.enabled cpu,textfile --telemetry.addr :9182
wmi_exporter_collector_duration_seconds{collector="cpu"} 0
wmi_exporter_collector_duration_seconds{collector="textfile"} 0
wmi_exporter_collector_success{collector="cpu"} 1
wmi_exporter_collector_success{collector="textfile"} 1
wmi_exporter_collector_timeout{collector="cpu"} 0
wmi_exporter_collector_timeout{collector="textfile"} 0
wmi_exporter_perflib_snapshot_duration_seconds 18.0596331
zoransimeonov
on 9 Aug 2019
Hi,
wanted to say that I have the same error on the following machine with exchange installed:
OS Name: Microsoft Windows Server 2019 Standard
OS Version: 10.0.17763 N/A Build 17763
wmi_exporter_perflib_snapshot_duration_seconds has the longest delay when there is no error. (30-70 seconds)
 pouyana
on 5 Sep 2019
pouyana
on 5 Sep 2019
I am also having this same issue only on exchange servers.
 mwarchut-monsoon
on 17 Sep 2019
mwarchut-monsoon
on 17 Sep 2019
Hello,
I would like to know if there is a solution for this problem? Recently I installed wmi_exporter myself too on an Windows 2016 server that run Exchange and I got this error. We are using Prometheus for monitoring our Linux based servers and we would like to extend for Windows platform as well, however this issue is preventing us to go further.
 siliattila
on 25 Oct 2019
siliattila
on 25 Oct 2019
I have the same issue
An error has occurred during metrics gathering:
error collecting metric Desc{fqName: "wmi_exporter_collector_success", help: "wmi_exporter: Whether
the collector was successful.", constLabels: {}, variableLabels: [collector]}: failed to prepare scrape:
ReqQueryValueEx failed: Die angeforderte Ressource wird bereits verwendet. errno 170
Running on Server Core 2019 (used as a host for docker). I tried to only use cpu or os as collectors. But that did not helped.
 soerendd
on 26 Nov 2019
soerendd
on 26 Nov 2019
I have same issue on 3 servers. Windows server 2016 with 700+ IIS process collector only processes.
I try run collectors with os and other and i get same error
 AvdeevArtem
on 1 Dec 2019
AvdeevArtem
on 1 Dec 2019
@carlpett
Hi Calle, is there any way to start the exporter in more verbose mode? Seems that I have the same problem and want help you to find the root cause.
Error message: failed to prepare scrape: ReqQueryValueEx failed: The requested resource is in use.
I'm using v 0.9.0 on Windows Server 2012 R2 Standard (6.3.9600 N/A Build 9600). Installed using msi package, started as a windows service with the following parameters:
C:\Program Files\wmi_exporter\wmi_exporter.exe --log.format logger:eventlog?name=wmi_exporter --telemetry.addr :9182
Enabled collectors are: net, os, service, system, textfile, cpu, cs, logical_disk
 dinardavliev
on 20 Dec 2019
dinardavliev
on 20 Dec 2019
Hey all,
Sorry for the lack of response here, been away for a while and have a pretty full plate before the holidays.
@dinardavliev Much appreciated that you want to investigate! The log level can be set to highest verbosity with --log.level debug.
That might not give much more information in this case, since it is returned from the low-level Windows APIs, but worth a shot.
If that turns out to not give much more information, I think the next step will be using ETW (Event Tracing for Windows) to see what is going on inside the OS...
Please let me know if you find anything! I doubt I'll have time to do deeper debugging myself of this during 2019, unfortunately.
carlpett
on 20 Dec 2019
@carlpett
anything new "news" here?
We have the same problem as @pasarn
 Schmitz-C
on 20 Jan 2020
Schmitz-C
on 20 Jan 2020
Just checking if anyone resolved the issue. Getting the same issues Server 2019 build 17763.973 Exchange 2019. Rebooted worked for a few minutes and the issue came back. The strange thing is the other server in the cluster is working fine same server build and exchange build as the other one with the issue.
 elezondra
on 30 Jan 2020
elezondra
on 30 Jan 2020
FYI,
I was able to resolve our issue by uninstalling the latest wmi-exporter and installing 0.2.7 version. I didnt try other previous versions to see if they work as well.
elezondra
on 31 Jan 2020
Hello,
I'm currently working full-time on expanding the wmi_exporter with Exchange Server WMI metrics for a client. The collector is nearly done, but the delay on the /metrics endpoint is causing the scraping to fail.
This seems to be the case regardless of which collectors are enabled and as others have mentioned the wmi_exporter_perflib_snapshot_duration_seconds metric is consistently somewhere above 30s.
I'm working on this issue full time with the resources of my client who is determined to see this issue resolved.
My knowledge of the OS and underlying systems involved in this issue is limited so I'm open to suggestions on where to direct our troubleshooting efforts
Version 0.4.3 supposedly runs fine on Exchange-servers.
 eikaas
on 6 Feb 2020
eikaas
on 6 Feb 2020
Hey everyone,
Apart from lack of time and access to affected machines, the main the issue is that I don't have any real idea what Exchange is doing to machines that cause perflib to fail.
@eikaas if you have some time, it would be interesting to know if perflib actually hangs for 30s and then returns something, or if we're just aborting at that stage? If you dump the ScrapeContext, is there anything in perfObjects?
For those of you testing with earlier versions, given what we know you should be fine up to and including 0.7, since perflib was added in 0.8. If this is _not_ the case, that would also be an interesting data point.
carlpett
on 6 Feb 2020
Should be possible to test this using the standalone perflib exporter's debugging page and figure out which collector is causing it. Perhaps Exchange registers a custom perflib DLL that happens to be very expensive?
Is wmi_exporter still using the Global collector filter?
leoluk
on 6 Feb 2020
I can confirm that the issue definitely seems introduced in v0.8.0 (or v0.7.999 to be precise).
Later versions outputs the correct metrics most of the time, but it takes around a minute from request to response.
@carlpett I will look into the ScrapeContext and report back on monday
@leoluk Don't know what it is, but perflib.go:13 suggests its still using the Global collector filter.
I think the exchange custom perflib DLL hypothesis seems a likely culprit at this point - will investigate
eikaas
on 7 Feb 2020
@leoluk Yep, haven't had time to make it clever yet. Looks like I might need to put some time into it.
@eikaas Thanks :+1:
carlpett
on 8 Feb 2020
Hey all,
I made a quick hack to test if we can avoid the problem by not querying all perflib objects, as suggested. Please try out this build and see if it improves the situation: https://ci.appveyor.com/api/buildjobs/cby7rew27rwo07we/artifacts/output%2Famd64%2Fwmi_exporter-0.9.1-specific-perflib-objects.1%2B13-amd64.exe
carlpett
on 9 Feb 2020
@carlpett Works perfectly! Nothing left for me to do but eat cake now I guess 🍰 😄
eikaas
on 10 Feb 2020
@eikaas Thanks! I'll try to massage the PR into a releasable state the coming days.
Enjoy the cake :wink:
carlpett
on 12 Feb 2020
@carlpett do you have a .msi?
 jlynch93
on 13 Feb 2020
jlynch93
on 13 Feb 2020
@carlpett I think this can be closed
 secustor
on 10 Mar 2020
secustor
on 10 Mar 2020
Related issues
 majerus1223
·
7Comments
majerus1223
·
7Comments
 Psk8140
·
3Comments
Psk8140
·
3Comments
 lngphp
·
4Comments
lngphp
·
4Comments
 jdx-john
·
4Comments
jdx-john
·
4Comments
 amitsaha
·
5Comments
amitsaha
·
5Comments
Most helpful comment
Hey all,
I made a quick hack to test if we can avoid the problem by not querying all perflib objects, as suggested. Please try out this build and see if it improves the situation: https://ci.appveyor.com/api/buildjobs/cby7rew27rwo07we/artifacts/output%2Famd64%2Fwmi_exporter-0.9.1-specific-perflib-objects.1%2B13-amd64.exe