Windows_exporter: WMI Exporter - up - not reliable
Morning guys,
I am using WMI Exporter and leveraging Up to determine that the instance is up, however this does not seem to be reliable under high CPU conditions and WMI Exporter stops responding.
This is becoming quite frustrating for my on-call engineers who are getting woken up when an OpsGenie Alert stating an instance is down, when infact it isn't and its a case that CPU is running hot, but not critical.
Is there a way of making this more robust or being able to mitigate against this?
 pete-leese
All 32 comments
Hi,
What is your alerting rule? I see two "simple" mitigations:
- Longer time before firing the alert, say
for: 10m - Combine with other indicators such as cpu not being high when the machine last was up
I'd generally suggest alternative 1, but of course this will prolong time until you react when things are _actually_ down
 carlpett
on 6 Nov 2018
carlpett
on 6 Nov 2018
Hi Carl,
We already have set for: 10 and reluctant to set it any higher.
What I have noticed is that if I remove all of the collectors apart from textfile it does report as being up consistently and metrics endpoint loads instantly.
I assume something is timing out whilst collecting metrics.
Below are the collectors I have enabled;
cpu,cs,logical_disk,net,os,process,service,system,mssql,textfile
This is taking well over 30 seconds to load, but seems to be considerably quicker when "system" and "mssql" collectors are removed.
pete-leese
on 6 Nov 2018
mssql class collector availreplica failed after 164.965436s: Exception occurred. (Invalid class )
I wonder if this has anything to do with it timing out ?
pete-leese
on 6 Nov 2018
In general, the problem is that WMI will be slow when the system is under load. It seems excessive that an invalid class could take that long, though... Does that work when the system is less busy?
carlpett
on 6 Nov 2018
It doesn't return any metrics on /metrics when SQL collector is enabled, I just see the error in event viewer.
It has worked historically and has been for some months, It might be that it is still timing out, but not enough to prevent metrics from loading under lower cpu conditions.
pete-leese
on 6 Nov 2018
We are having the same issue here, down set to 10 minutes for alerting on Windows and it is randomly failing on high load.
I think the up check should not even rely on wmi, it should always return that it's up (Because if the host is down anyway the exporter will not respond)
 kedare
on 16 Nov 2018
kedare
on 16 Nov 2018
I think it is a fundamental flaw with this exporter and it does need a heartbeat of some description to validate the system is up.
I have seen it fail under different conditions, but essentially server was still responding as was able to log on via RDP.
I have considered a couple of workarounds;
1) deploy a new instance of WMI exporter runs on a separate port that only uses the textfile collector and create a suitable metrics file, create an absent based alert to determine if host / up down.
2) leverage blackbox exporter to ping hosts - but this is a step back in my eyes.
3) Deploy Perflib exporter and use this for up alert - But this is not mature yet and looks like development has stalled.
All 3 options are less than ideal, and brings me back to the fact wmi exporter needs to be able to cope in high load conditions or incorporate something that definitive identifies the system as up.
pete-leese
on 16 Nov 2018
@kedare It doesn't rely on WMI, strictly speaking. The up metric is created by the Prometheus server depending on if the scrape succeeds or not. In this case, your instances aren't responding within your set timeout, so Prometheus aborts the scrape and sets up=0.
Potential workarounds I can see:
- Making the Prometheus scrape timeout longer (but for the case above with 164 seconds, this would probably not be a good idea)
- Making the exporter itself abort the WMI call after some set time (but this would probably need to be passed as a parameter to the scrape). The WMI library we use doesn't support this, out-of-the-box, so we'll need to do a fair investment into ensuring this doesn't lead to resource leaks or similar
We can't really influence the fact that the WMI subsystem in Windows isn't fast/highly prioritized, so that queries are slow is fundamentally not something we can fix in the exporter. We could switch to using perflib internally, but it has a rather different model, so also a large piece of work to get feature parity.
I understand your frustration with this, so I'm not trying to suggest your concerns are invalid. It is, however, a non-trivial thing to address.
carlpett
on 16 Nov 2018
I think the issue is that (if I understand right) that in the current behavior each request to the exporter trigger WMI reads?
Would not it be better to separate those 2 parts?
Read WMI async every X seconds for example (configurable) and process requests from the asynchronous read (so WMI -> Cache, and the exposed data is from the cache), that should solve this timeout issue.
kedare
on 16 Nov 2018
The general recommendation is that exporters should _not_ do caching, see https://prometheus.io/docs/instrumenting/writing_exporters/#scheduling.
Could you give some examples of how long your scrapes and each collection takes (the wmi_exporter_collector_duration_seconds metrics) when you have high load? What does high load mean in your case?
carlpett
on 16 Nov 2018
I agree with Carl on the caching front as can imagine it will skew the time stamps if not adding offsets etc...
I’ll set up a grafana dashboard this week but I get gaps of 40mins plus in many cases so not sure how much use this will be?
High load is generally high IO utilisation % disk busy causes issues and also under high cpu load conditions - usually application pools running away and hammering the cpu.
I setup perflib on a number of servers and it happily collects metrics during the times wmi exporter fails but that exporter is far from production ready.
If we can get it reporting accurate with UP then that’s half the battle and as I mentioned quite frustrating getting woken up in the night for an instance down alert where the instance is actually up and serving requests, albeit under load.
pete-leese
on 11 Dec 2018
I think for now the best solution would be to use Telegraf with the prometheus exporter enabled so far.
kedare
on 11 Dec 2018
That’s a fair comment @kedare but I have invested a lot of time and effort into wmi exporter, and Don’t really fancy the overhead of another exporter running just for up.
pete-leese
on 19 Dec 2018
I suppose it depend on how it's deployed, but having sometime more than 10 minutes of blank in the graphs is not an acceptable solution in our case.
kedare
on 19 Dec 2018
No it isn’t for us either tbh but will have to explore alternative exporters and possibly migrate away for some functionality.
pete-leese
on 2 Jan 2019
Not probably the most elegant solution but I got around this by doing a simple "nc -z hostname 9182" check and getting response times from that. Times are quite nice and neat overall and I do up/down checking this way. If the port responds, good. If this times you, bad. No need to change anything client-side.
Currently grabs hostnames from prometheus.yml.
Main negative with this is that you might want to do quite a bit of relabeling as these would come from local textfile vs. from the host itself.
It still allows me to have wmi running as-is and using "connected lines" to monitor metrics while this custom "upcheck.sh" runs as a cron every minute and I can use that for actual alarms.
 oasiz-
on 13 Jan 2019
oasiz-
on 13 Jan 2019
I suppose it depend on how it's deployed, but having sometime more than 10 minutes of blank in the graphs is not an acceptable solution in our case.
@kedare I agree with you on this one and are struggling to find a good solution to get high resolution cpu-metrics per process during peak CPU-loads. Have you investigated other solutions to get these metrics to Prometheus? I have had a look at https://gitlab.com/infragravity/sonar-docker and the performance counters approach, but I'm not sure if this solution will have the same underlying problems as wmi_exporter. The same goes for using Telegraf.
 theimdal
on 5 Mar 2019
theimdal
on 5 Mar 2019
To update and give some glimmer of hope, after the decision in the above linked issue, we're working on reducing the reliance on WMI, which should help alleviate this issue. In my testing so far, results are promising! Hope to get a testable version out soon.
carlpett
on 5 May 2019
This is great news. Looking forward to a test release !
Keep up the good work!!
pete-leese
on 14 May 2019
Yes! Really looking forward to this one.
theimdal
on 14 May 2019
Hey all,
I've just build a preview release (that is, don't push this onto everything you have just yet): https://github.com/martinlindhe/wmi_exporter/releases/tag/v0.7.999-preview.2
Would be great if you have time to test it and give some feedback on whether it helps you!
carlpett
on 25 May 2019
I am testing with the v07.999-preview.2 on a Windows 2019 Server. I put the host under heavy load using the "HeavyLoad" load generator. I am getting a constant stream of wmi_exporter timeouts in this state:
[33mWARN[0m[42644] Collection timed out, still waiting for [os system memory net logical_disk] [33msource[0m="exporter.go:136"
[33mWARN[0m[42654] Collection timed out, still waiting for [logical_disk os system memory net] [33msource[0m="exporter.go:136"
[33mWARN[0m[42665] Collection timed out, still waiting for [memory net logical_disk os system] [33msource[0m="exporter.go:136"
[33mWARN[0m[42676] Collection timed out, still waiting for [net logical_disk os system memory] [33msource[0m="exporter.go:136"
We are testing wmi_exporter in conjunction with netdata, so the graphs we are generating are shown below -- (lots of missing data points).
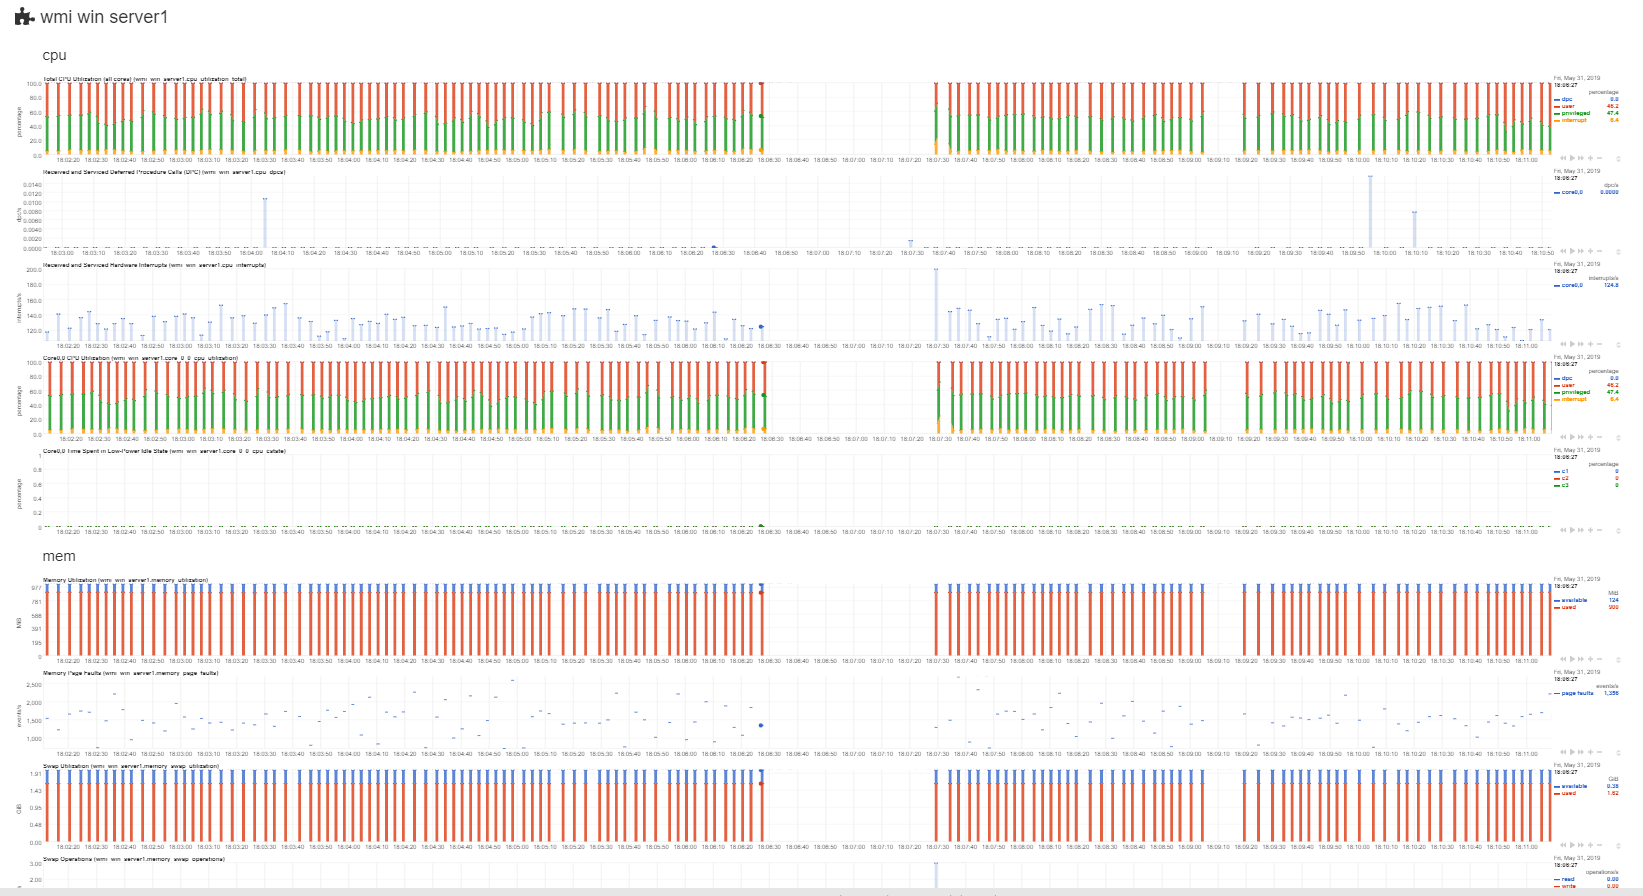
I don't know if this is solvable, since the machine is clearly too busy to service all the WMI requests, but here is the data FYI.
 irvintim
on 31 May 2019
irvintim
on 31 May 2019
Maybe worth while running perflib exporter side by side to see if that drops the equivalent metrics.
pete-leese
on 31 May 2019
I realize I should have set some better expectations and explained the changes a bit better. Here's what is changed in the preview:
- The cpu collector uses perflib rather than WMI. This means that that collector (not all of them, yet) should be very fast. But we're also hoping to hear that there is no "unexpected behaviour" in terms of breaking existing dashboards, different measurement results, etc.
- A new flag to time out individual collectors in order to return the scrape with whatever collectors did finish on time. NOTE This flag needs to be tuned to fit your Prometheus
scrape_timeout(or the default, 10s) in order to have an effect. If you have the default 10s timeout, try setting--scrape.max-durationto something slightly lower, 9s perhaps.
carlpett
on 3 Jun 2019
Prometheus does pass down the scrape timeout as a header.
On Mon 3 Jun 2019, 09:29 Calle Pettersson, notifications@github.com wrote:
I realize I should have set some better expectations and explained the
changes a bit better. Here's what is changed in the preview:
- The cpu collector uses perflib rather than WMI. This means that that
collector (not all of them, yet) should be very fast. But we're also hoping
to hear that there is no "unexpected behaviour" in terms of breaking
existing dashboards, different measurement results, etc.- A new flag to time out individual collectors in order to return the
scrape with whatever collectors did finish on time. NOTE This flag
needs to be tuned to fit your Prometheus scrape_timeout (or the
default, 10s) in order to have an effect. If you have the default 10s
timeout, try setting --scrape.max-duration to something slightly
lower, 9s perhaps.—
You are receiving this because you are subscribed to this thread.
Reply to this email directly, view it on GitHub
https://github.com/martinlindhe/wmi_exporter/issues/270?email_source=notifications&email_token=ABWJG5RRVRZNBLTONTJA6ETPYS24HA5CNFSM4GCAO6PKYY3PNVWWK3TUL52HS4DFVREXG43VMVBW63LNMVXHJKTDN5WW2ZLOORPWSZGODWYNUHY#issuecomment-498129439,
or mute the thread
https://github.com/notifications/unsubscribe-auth/ABWJG5QLAVZEQDOBWXX7GADPYS24HANCNFSM4GCAO6PA
.
 brian-brazil
on 3 Jun 2019
brian-brazil
on 3 Jun 2019
@brian-brazil Ah, nice. However, it doesn't seem to be passed through when using the promhttp package. I'll see about replacing it.
carlpett
on 6 Jun 2019
There might be a context available in future client_golang versions.
brian-brazil
on 6 Jun 2019
I'm seeing this same issue as well, was there ever a true fix to this?
 jlynch93
on 13 Feb 2020
jlynch93
on 13 Feb 2020
We had to disable the service on our windows boxes since they work so bad and hug alot of RAM and CPU over time (perhaps another issue)
 mattias-elvaco
on 13 Feb 2020
mattias-elvaco
on 13 Feb 2020
found a fix to this issue, https://github.com/martinlindhe/wmi_exporter/issues/374
Waiting for a release now....
jlynch93
on 13 Feb 2020
There's been a lot of changes to alleviate this issue, both converting collectors to use perflib and also better timeout management. I'll close this, and if anyone is still facing issues on 0.13+ we can look into it again.
carlpett
on 26 Jul 2020
Unfortunately still seeing this issue on 0.15.0. We've got a scrape timeout of 10s and default settings on the exporter.
The main culprits seem to be the cs and os collectors. Both these collectors are consistently the only ones we see timing out, even under normal load of the machines.
 benridley
on 3 Dec 2020
benridley
on 3 Dec 2020
Related issues
 Gerthum
·
9Comments
benridley
·
5Comments
Gerthum
·
9Comments
benridley
·
5Comments
 captainhistory
·
8Comments
captainhistory
·
8Comments
 jdx-john
·
4Comments
jdx-john
·
4Comments
 wizardmatas
·
5Comments
wizardmatas
·
5Comments
Most helpful comment
To update and give some glimmer of hope, after the decision in the above linked issue, we're working on reducing the reliance on WMI, which should help alleviate this issue. In my testing so far, results are promising! Hope to get a testable version out soon.