Windows_exporter: CPU collector blocks every ~17 minutes on call to wmi.Query
We've deployed the wmi-exporter on a number of our Windows systems running Server 2012r2 standard. This was a version built several months ago with Go 1.8.
These systems typically push 20-30 Gbps of traffic and have 24 hyperthreads. There is generally plenty of room on half of these threads.
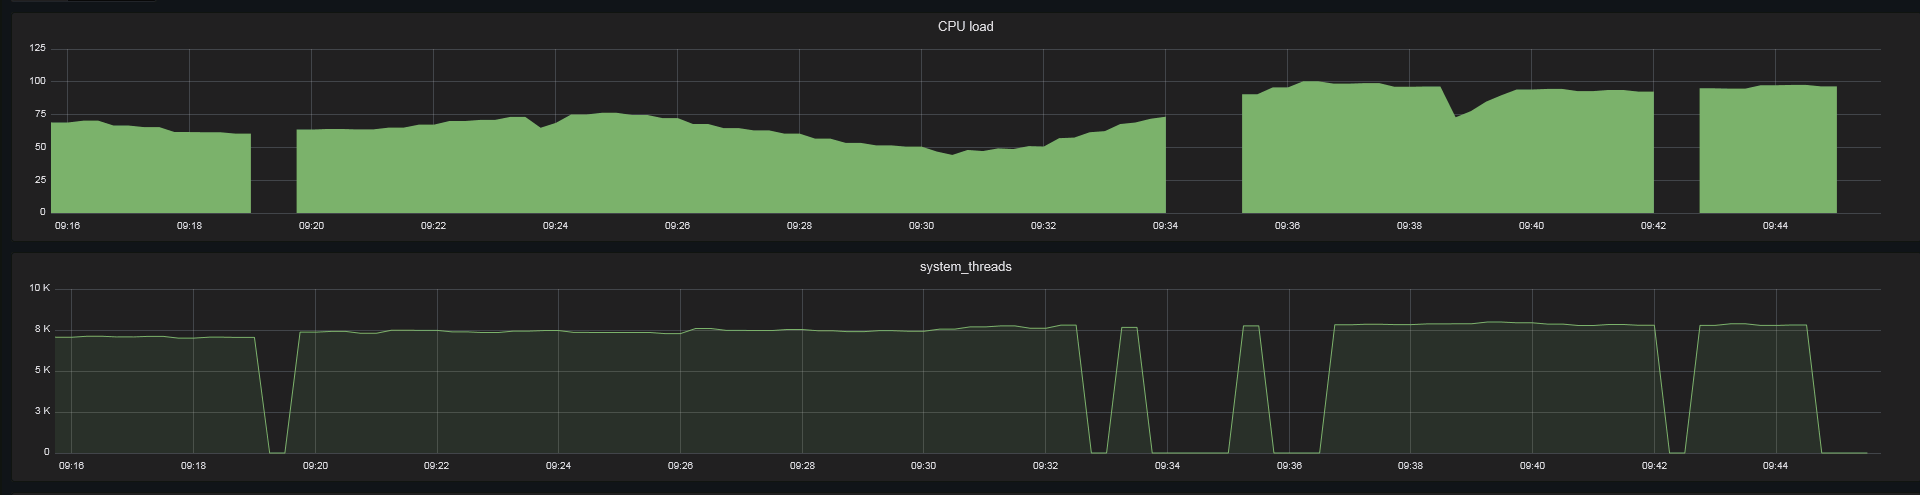
Having deployed the exporter, we observed that every 17-18 minutes (independent of when the exporter was started), the traffic being served by them would drop significantly for roughly 120 seconds and CPU consumption on one or two cores would spike. The "WMI Provider Host" would also increase in CPU utilisation during this time.
Killing the exporter did not cause the load to drop off immediately.
We also noticed that calls to the exporter would block during this time.
We set GOMAXPROCS to 2, to see if there was any concurrency issues that might be overloading WMI, but that didn't improve matters.
We built a new version from master on Friday June 30th with Go 1.8.1. The issue persisted.
We started to disable collectors to isolate where the problem was occurring and found that it only happened when the CPU collector was enabled. We put some printfs around the calls inside the collect function and found that it was blocking on the call to wmi.Query.
Interestingly, we did not see any pauses or breaks in the data while monitoring that data in perfmon while the query was running.
We dialled testing back to a 2 CPU VM running Windows 10 not doing anything particularly difficult or interesting and polling using "curl $blah ; sleep 60" in a loop.
The results suggest that something is going wrong every 17-18 minutes (the lines with * were added by me):
time="2017-07-03T10:31:38-07:00" level=debug msg="OK: cpu collector succeeded after 0.032996s." source="exporter.go:90"
2017/07/03 10:32:38 *** Starting CPU Collector run...
2017/07/03 10:32:38 *** Created WMI Query for CPU...
2017/07/03 10:32:40 *** Ran WMI Query for CPU...
2017/07/03 10:32:40 *** Sending data for 0 to exporter...
2017/07/03 10:32:40 *** Sending data for 1 to exporter...
time="2017-07-03T10:32:40-07:00" level=debug msg="OK: cpu collector succeeded after 2.324834s." source="exporter.go:90"
2017/07/03 10:33:40 *** Starting CPU Collector run...
2017/07/03 10:33:40 *** Created WMI Query for CPU...
2017/07/03 10:33:40 *** Ran WMI Query for CPU...
2017/07/03 10:33:40 *** Sending data for 0 to exporter...
2017/07/03 10:33:40 *** Sending data for 1 to exporter...
time="2017-07-03T10:33:40-07:00" level=debug msg="OK: cpu collector succeeded after 0.046001s." source="exporter.go:90"
2017/07/03 10:34:40 *** Starting CPU Collector run...
2017/07/03 10:34:40 *** Created WMI Query for CPU...
2017/07/03 10:34:40 *** Ran WMI Query for CPU...
2017/07/03 10:34:40 *** Sending data for 0 to exporter...
2017/07/03 10:34:40 *** Sending data for 1 to exporter...
< snip a few more ~0.04 second runs >
time="2017-07-03T10:46:41-07:00" level=debug msg="OK: cpu collector succeeded after 0.044845s." source="exporter.go:90"
2017/07/03 10:47:41 *** Starting CPU Collector run...
2017/07/03 10:47:41 *** Created WMI Query for CPU...
2017/07/03 10:47:41 *** Ran WMI Query for CPU...
2017/07/03 10:47:41 *** Sending data for 0 to exporter...
2017/07/03 10:47:41 *** Sending data for 1 to exporter...
time="2017-07-03T10:47:41-07:00" level=debug msg="OK: cpu collector succeeded after 0.038003s." source="exporter.go:90"
2017/07/03 10:48:41 *** Starting CPU Collector run...
2017/07/03 10:50:05 *** Created WMI Query for CPU...
2017/07/03 10:50:08 *** Ran WMI Query for CPU...
2017/07/03 10:50:08 *** Sending data for 0 to exporter...
2017/07/03 10:50:08 *** Sending data for 1 to exporter...
time="2017-07-03T10:50:08-07:00" level=debug msg="OK: cpu collector succeeded after 86.787446s." source="exporter.go:90"
07/03 10:51:08 *** Starting CPU Collector run...
2017/07/03 10:51:08 *** Created WMI Query for CPU...
2017/07/03 10:51:08 *** Ran WMI Query for CPU...
2017/07/03 10:51:08 *** Sending data for 0 to exporter...
2017/07/03 10:51:08 *** Sending data for 1 to exporter...
time="2017-07-03T10:51:08-07:00" level=debug msg="OK: cpu collector succeeded after 0.034084s." source="exporter.go:90"
I tested again using official version v0.2.5 and again observed an unexpected increase in gathering time ~17 minutes after the last spike.
time="2017-07-03T11:01:03-07:00" level=info msg="Starting server on :9182" source="exporter.go:206"
time="2017-07-03T11:01:04-07:00" level=debug msg="OK: cpu collector succeeded after 0.186394s." source="exporter.go:90"
time="2017-07-03T11:02:04-07:00" level=debug msg="OK: cpu collector succeeded after 0.022045s." source="exporter.go:90"
time="2017-07-03T11:03:04-07:00" level=debug msg="OK: cpu collector succeeded after 0.025063s." source="exporter.go:90"
time="2017-07-03T11:04:05-07:00" level=debug msg="OK: cpu collector succeeded after 0.031924s." source="exporter.go:90"
time="2017-07-03T11:05:05-07:00" level=debug msg="OK: cpu collector succeeded after 0.027066s." source="exporter.go:90"
time="2017-07-03T11:06:07-07:00" level=debug msg="OK: cpu collector succeeded after 0.036162s." source="exporter.go:90"
time="2017-07-03T11:07:10-07:00" level=debug msg="OK: cpu collector succeeded after 3.061992s." source="exporter.go:90"
time="2017-07-03T11:08:10-07:00" level=debug msg="OK: cpu collector succeeded after 0.036285s." source="exporter.go:90"
time="2017-07-03T11:09:10-07:00" level=debug msg="OK: cpu collector succeeded after 0.036368s." source="exporter.go:90"
time="2017-07-03T11:10:11-07:00" level=debug msg="OK: cpu collector succeeded after 0.187498s." source="exporter.go:90"
time="2017-07-03T11:11:07-07:00" level=debug msg="OK: cpu collector succeeded after 0.031065s." source="exporter.go:90"
time="2017-07-03T11:12:07-07:00" level=debug msg="OK: cpu collector succeeded after 0.030048s." source="exporter.go:90"
time="2017-07-03T11:13:07-07:00" level=debug msg="OK: cpu collector succeeded after 0.030922s." source="exporter.go:90"
time="2017-07-03T11:14:08-07:00" level=debug msg="OK: cpu collector succeeded after 0.030062s." source="exporter.go:90"
time="2017-07-03T11:15:08-07:00" level=debug msg="OK: cpu collector succeeded after 0.024992s." source="exporter.go:90"
time="2017-07-03T11:16:08-07:00" level=debug msg="OK: cpu collector succeeded after 0.030092s." source="exporter.go:90"
time="2017-07-03T11:17:08-07:00" level=debug msg="OK: cpu collector succeeded after 0.030072s." source="exporter.go:90"
time="2017-07-03T11:18:08-07:00" level=debug msg="OK: cpu collector succeeded after 0.029085s." source="exporter.go:90"
time="2017-07-03T11:19:08-07:00" level=debug msg="OK: cpu collector succeeded after 0.031077s." source="exporter.go:90"
time="2017-07-03T11:20:08-07:00" level=debug msg="OK: cpu collector succeeded after 0.031975s." source="exporter.go:90"
time="2017-07-03T11:21:08-07:00" level=debug msg="OK: cpu collector succeeded after 0.034084s." source="exporter.go:90"
time="2017-07-03T11:22:08-07:00" level=debug msg="OK: cpu collector succeeded after 0.031888s." source="exporter.go:90"
time="2017-07-03T11:23:11-07:00" level=debug msg="OK: cpu collector succeeded after 2.759751s." source="exporter.go:90"
time="2017-07-03T11:24:11-07:00" level=debug msg="OK: cpu collector succeeded after 0.036913s." source="exporter.go:90"
I don't understand WMI enough to understand where to start digging, but it would be useful to understand if anyone else observes this.
If there's other data that is useful to gather. please let me know.
 higels
All 71 comments
Is the 2012r2 servers fully patched, especially I think there are some WMI related patches that is not security related so maybe have not been applied? Unfortunatley I cannot provide you with a complete list, google turns up some stuff, like https://support.microsoft.com/en-us/help/3103616/wmi-query-doesn-t-work-in-windows-server-2012-r2-or-windows-server-201
If you have the ability, is the issue reproducible in Windows Server 2016, or Windows 10?
 martinlindhe
on 3 Jul 2017
martinlindhe
on 3 Jul 2017
The tests I ran on the 2 CPU VM were all Windows 10 Pro. The issue is far less pronounced there; this might be because it has way fewer CPUs to poll.
And yes, definitely fully patched. That specific hotfix was present on the 2012r2 server I was using to repro.
Looking at a few 2016 systems, the issue was also present there.
higels
on 3 Jul 2017
Thanks for your quick response! The os collector has been around for a while now and this is the first report of this kind. There was some additions to the os collector released in 0.2.3. Perhaps testing the 0.2.2 release could at least rule out those changes. (I am doubtful)
So, what you're seeing is around every 17 minutes, the prometheus scrape makes the "WMI Provider Host" process spin up, ?
When you were reproducing it on Win10, were the machines otherwise idle, or do they only experience this under load?
Is other software running that also interacts with WMI?
martinlindhe
on 3 Jul 2017
Re: the VM: it's idle and is running on my desktop. The debug log output for a run over a longer period of time is attached.
And yes, that is correct. Every 17 or so minutes, the poll of the CPU collector takes longer than expected, wmiprvse.exe spikes up in utilisation.
I'll try to catch it in procmon next time it happens.
To be clear, this seems to be due to the CPU collector rather than the OS collector. I'm testing with
.\wmi_exporter.exe "-collectors.enabled" cpu "-log.level" debug
I just tested with 2.2 on the Windows 10 Pro VM and anecdotally, the poll which was expected to take 2-3 seconds at 13:33 did indeed take 2-3 seconds. (sample size of one etc. etc.)
time="2017-07-03T13:30:19-07:00" level=info msg="Enabled collectors: cpu" source="exporter.go:175"
time="2017-07-03T13:30:19-07:00" level=info msg="Starting WMI exporter (version=0.2.2, branch=master, revision=a41b9de37c017e4406769ef183952b17959ebb11)" source="exporter.go:186"
time="2017-07-03T13:30:19-07:00" level=info msg="Build context (go=go1.8, user=appvyr-win\\appveyor@APPVYR-WIN, date=20170317-18:39:35)" source="exporter.go:187"
time="2017-07-03T13:30:19-07:00" level=info msg="Starting server on :9182" source="exporter.go:190"
time="2017-07-03T13:31:02-07:00" level=debug msg="OK: cpu collector succeeded after 0.028056s." source="exporter.go:88"
time="2017-07-03T13:32:02-07:00" level=debug msg="OK: cpu collector succeeded after 0.030073s." source="exporter.go:88"
time="2017-07-03T13:33:05-07:00" level=debug msg="OK: cpu collector succeeded after 2.852098s." source="exporter.go:88"
time="2017-07-03T13:34:05-07:00" level=debug msg="OK: cpu collector succeeded after 0.040098s." source="exporter.go:88"
time="2017-07-03T13:35:04-07:00" level=debug msg="OK: cpu collector succeeded after 0.046114s." source="exporter.go:88"
Procmon suggests that wmiprvse.exe is doing something completely different for those runs which take longer, but that wmi_exporter is not doing anything different in constructing the query.
A normal run finishes in about 40 operations whereas the stalled ones spend 3 seconds reading a whole bunch of registry keys (starting in
HKLM\SOFTWARE\Microsoft\Windows NT\CurrentVersion\Perflib_V2Providers).
If I just leave it running without wmi_exporter polling it, this doesn't seem to happen.
So, almost certainly a problem on the OS side. I'm just curious if there's something about my environment which is making it worse and if there's something we can do to prevent this behaviour from triggering.
higels
on 4 Jul 2017
Okay, that's reassuring for us, but I do understand it's not helping you.
Least effort would appear to be to disable the cpu collector then.
If you wish to delve deeper, you could possibly manually comment out parts of the cpu collector, to try to identify if a particular metric triggers the metric.
@carlpett do you have any input on this?
martinlindhe
on 4 Jul 2017
Hm, quite disturbing... @higels What services/Windows features do you have enabled on the servers? Were those also present on the Windows 10 VM, or was that a mostly blank OS?
Did you notice if this was wholly based on time, or is it also dependent on scrape frequency? That is, if you scrape twice as often, does the blocking happen twice as often as well?
I found this troubleshooting tip, which would also be interesting to know the output from:
Assuming you know which PID is consuming lots of cpu, start by getting a list of PID's running wmiprvse.exe by running this a command prompt:
tasklist /fi "imagename eq wmiprvse.exe"
This should show a table similar to this:
Image Name PID Session Name Session# Mem Usage
========================= ======== ================ =========== ============
WmiPrvSE.exe 1716 Services 0 7,240 K
Next we need to list all of our WMI providers and see which PID they are hosted in.
C:\Windows\System32>wmic path msft_providers get hostinggroup,hostprocessidentifier,namespace,provider,user /format:list
Note the HostProcessIdentifier as it is the PID of an instance of wmiprvse.exe
HostingGroup=DefaultNetworkServiceHost
HostProcessIdentifier=1716
Namespace=root\CIMV2
provider=CIMWin32 <-- Name of the provider. There are providers for different types of software such as Exchange, MS SQL. etc etc
User=
Here we can see that Process 1716 is hosting the CIMWin32 Provider. Its reponsible for providing access to all of the Win32 classes such as Win32_ComputerSystem or Win32_QuickFixEngineering. Sometimes you are going to see that mulitple providers are being hosted under the same instance of wmiprvse.exe. When this happens you will need to narrow your scope even further by using Process Exporer and examining the stack to see which DLL(Provider) is responsible for the high cpu.
One potential environmental thing this would point out is if you have some special WMI provider installed (as part as drivers, most commonly) which is misbehaving.
 carlpett
on 4 Jul 2017
carlpett
on 4 Jul 2017
@higels I've been tinkering a bit with my own systems now to see if I've simply been missing this, but I cannot seem to reproduce it. Tested Win 10, Server 2012 and Server 2016, so I think there must be something specific in your setup that is required to trigger it. Would be most interesting to know more!
carlpett
on 4 Jul 2017
The VM is just a pretty normal Parallels Windows VM. It has some domain admin tools installed and the Parallels integration utilities.
It is definitely based on time rather than request frequency; I can spam requests as fast as I like outside of that window.
I noticed that every time this issue occurred, I'd see an event like this in the WMI event viewer bucket thing (I tidied it up a bit to make it more readable):
Log Name:      Microsoft-Windows-WMI-Activity/Operational
Source:        Microsoft-Windows-WMI-Activity
Date:          7/4/17 9:53:14 AM
Event ID:      5857
Description:
WMIProv provider started with result code 0x0. HostProcess = wmiprvse.exe; ProcessID = 1048; ProviderPath = %systemroot%\system32\wbem\wmiprov.dll
Event Xml: <Execution ProcessID="1048" ThreadID="7248" />

Log Name:      Microsoft-Windows-WMI-Activity/Operational
Source:        Microsoft-Windows-WMI-Activity
Date:          7/4/17 9:53:15 AM
Event ID:      5857
Description:
Msft_ProviderSubSystem provider started with result code 0x0. HostProcess = wmiprvse.exe; ProcessID = 1304; ProviderPath = %systemroot%\system32\wbem\wmiprvsd.dll
Event Xml: <Execution ProcessID="1304" ThreadID="5832" />
This event rarely happens outside of that window.
I turned on event tracing for WMI and I've noticed that along with this, the following occurs whenever the stall happens:
Log Name:      Microsoft-Windows-WMI-Activity/Trace
Source:        Microsoft-Windows-WMI-Activity
Date:          7/4/17 9:53:14 AM
Event ID:      19
Description:
Performing delete operation on the WMI repository. OperationID = 18805; Operation = WMIBinaryMofResource.HighDateTime=30596117,LowDateTime=1905995314,Name="C:\\Windows\\system32\\drivers\\ndis.sys[MofResourceName]"
Event Xml: <Execution ProcessID="1304" ThreadID="5832" ProcessorID="1" KernelTime="2" UserTime="3" />

Log Name:      Microsoft-Windows-WMI-Activity/Trace
Source:        Microsoft-Windows-WMI-Activity
Date:          7/4/17 9:53:14 AM
Event ID:      19
Description:
Performing delete operation on the WMI repository. OperationID = 18805; Operation = WMIBinaryMofResource.HighDateTime=30577788,LowDateTime=3367994896,Name="C:\\Windows\\system32\\drivers\\en-US\\ndis.sys.mui[MofResourceName]"
Event Xml: <Execution ProcessID="1304" ThreadID="5832" ProcessorID="0" KernelTime="1" UserTime="2" />

Log Name:      Microsoft-Windows-WMI-Activity/Trace
Source:        Microsoft-Windows-WMI-Activity
Date:          7/4/17 9:53:14 AM
Event ID:      20
Description:
Performing Update operation on the WMI repository. OperationID = 18805; Operation = WMIBinaryMofResource.HighDateTime=30596117,LowDateTime=1905995314,Name="C:\\Windows\\system32\\drivers\\ndis.sys[MofResourceName]"; Flags = 0
Event Xml:
    <Execution ProcessID="1304" ThreadID="8108" ProcessorID="0" KernelTime="14" UserTime="19" />

Log Name:      Microsoft-Windows-WMI-Activity/Trace
Source:        Microsoft-Windows-WMI-Activity
Date:          7/4/17 9:53:14 AM
Event ID:      20
Description:
Performing Update operation on the WMI repository. OperationID = 18805; Operation = WMIBinaryMofResource.HighDateTime=30577788,LowDateTime=3367994896,Name="C:\\Windows\\system32\\drivers\\en-US\\ndis.sys.mui[MofResourceName]"; Flags = 0
Event Xml: <Execution ProcessID="1304" ThreadID="8108" ProcessorID="1" KernelTime="14" UserTime="19" />
And then I spotted that every time we have a stalled request, the following is being run on WMI, presumably by WBEM (if I've understood the architecture correctly...)
So, some kind of re-index task which is triggered by the first request on a particular group after a given amount of time?
Am I really the only person seeing this?
CorrelationId = {00000000-0000-0000-0000-000000000000}; GroupOperationId = 20118; OperationId = 20124; Operation = Start IWbemServices::ExecQuery - ROOT\WMI : select * from WMIBinaryMofResource where Name = "C:\\Windows\\system32\\kernelbase.dll[MofResourceName]"; ClientMachine = WINVM; User = NT AUTHORITY\SYSTEM; ClientProcessId = 7092; NamespaceName = \\.\ROOT\WMI
CorrelationId = {00000000-0000-0000-0000-000000000000}; GroupOperationId = 20118; OperationId = 20125; Operation = Start IWbemServices::ExecQuery - ROOT\WMI : select * from WMIBinaryMofResource where Name = "C:\\Windows\\system32\\en-US\\kernelbase.dll.mui[MofResourceName]"; ClientMachine = WINVM; User = NT AUTHORITY\SYSTEM; ClientProcessId = 7092; NamespaceName = \\.\ROOT\WMI
CorrelationId = {00000000-0000-0000-0000-000000000000}; GroupOperationId = 20118; OperationId = 20126; Operation = Start IWbemServices::ExecQuery - ROOT\WMI : select * from WMIBinaryMofResource where Name = "C:\\Windows\\System32\\drivers\\ACPI.sys[ACPIMOFResource]"; ClientMachine = WINVM; User = NT AUTHORITY\SYSTEM; ClientProcessId = 7092; NamespaceName = \\.\ROOT\WMI
CorrelationId = {00000000-0000-0000-0000-000000000000}; GroupOperationId = 20118; OperationId = 20127; Operation = Start IWbemServices::ExecQuery - ROOT\WMI : select * from WMIBinaryMofResource where Name = "C:\\Windows\\System32\\drivers\\en-US\\ACPI.sys.mui[ACPIMOFResource]"; ClientMachine = WINVM; User = NT AUTHORITY\SYSTEM; ClientProcessId = 7092; NamespaceName = \\.\ROOT\WMI
CorrelationId = {00000000-0000-0000-0000-000000000000}; GroupOperationId = 20118; OperationId = 20128; Operation = Start IWbemServices::ExecQuery - ROOT\WMI : select * from WMIBinaryMofResource where Name = "C:\\Windows\\system32\\drivers\\ndis.sys[MofResourceName]"; ClientMachine = WINVM; User = NT AUTHORITY\SYSTEM; ClientProcessId = 7092; NamespaceName = \\.\ROOT\WMI
CorrelationId = {00000000-0000-0000-0000-000000000000}; GroupOperationId = 20118; OperationId = 20129; Operation = Start IWbemServices::ExecQuery - ROOT\WMI : select * from WMIBinaryMofResource where Name = "C:\\Windows\\system32\\drivers\\en-US\\ndis.sys.mui[MofResourceName]"; ClientMachine = WINVM; User = NT AUTHORITY\SYSTEM; ClientProcessId = 7092; NamespaceName = \\.\ROOT\WMI
CorrelationId = {00000000-0000-0000-0000-000000000000}; GroupOperationId = 20118; OperationId = 20130; Operation = Start IWbemServices::ExecQuery - ROOT\WMI : select * from WMIBinaryMofResource where Name = "C:\\Windows\\System32\\Drivers\\portcls.SYS[PortclsMof]"; ClientMachine = WINVM; User = NT AUTHORITY\SYSTEM; ClientProcessId = 7092; NamespaceName = \\.\ROOT\WMI
CorrelationId = {00000000-0000-0000-0000-000000000000}; GroupOperationId = 20118; OperationId = 20131; Operation = Start IWbemServices::ExecQuery - ROOT\WMI : select * from WMIBinaryMofResource where Name = "C:\\Windows\\system32\\drivers\\battc.sys[BATTCWMI]"; ClientMachine = WINVM; User = NT AUTHORITY\SYSTEM; ClientProcessId = 7092; NamespaceName = \\.\ROOT\WMI
CorrelationId = {00000000-0000-0000-0000-000000000000}; GroupOperationId = 20118; OperationId = 20132; Operation = Start IWbemServices::ExecQuery - ROOT\WMI : select * from WMIBinaryMofResource where Name = "C:\\Windows\\system32\\drivers\\en-US\\battc.sys.mui[BATTCWMI]"; ClientMachine = WINVM; User = NT AUTHORITY\SYSTEM; ClientProcessId = 7092; NamespaceName = \\.\ROOT\WMI
Well, you are at least the only one observant enough to notice it :)
One thing that would be interesting to test would be if this happens with other WMI clients. Could you try calling while($true) { Measure-Command { Get-WMIObject Win32_PerfRawData_PerfOS_Processor }; sleep 30 } in a Powershell prompt and see if that also seems to hang every 17 minutes? If it does, does this also happen if you use perfmon?
carlpett
on 5 Jul 2017
Actually, I _do_ see it on my local machine. Its just much less pronounced that what you see @higels. Running that powershell snippet, every 16 minutes, the cpu scrape took ~1 second, instead of a few tens of milliseconds.
This leaves us with two questions:
What is happening, and why does it only seem to affect the cpu collector?
Why does it take so much longer time on your systems? I've tested this on physical and virtual machines, virtualized on KVM, Hyper-V and VMware, and Windows 10, 2012R2 and 2016. None of them are hit nearly as bad as you are.
carlpett
on 5 Jul 2017
I've left this:
$i= 0 ; while ($true) { $m=measure-command { get-wmiobject Win32_PerfRawData_PerfOS_Processor } ; if ($m -gt 800000) {write-host $i" - "$m} ; $i += 1 ; sleep 1}
running on my VM for a few hours and it's pretty clear that every 946 iterations, the job takes roughly 3 seconds, so I'm guessing whatever is triggering this leaves 950 seconds between runs.
I'm running that on an unloaded production class 2012r2 system now. Let's see what happens.
The daemon that pushes the traffic on the prod systems interacts with WMI every second (in a separate thread), so that likely explains why perf tanked.
I suspect the answer to "why does it affect the CPU collector" is someone decided to put a trigger for re-initialisation into the Processor object and arbitrarily decided that 950 seconds was an appropriate interval.
I'll do some more debugging today, maybe one of the registry keys it reads allows us to control this.
higels
on 5 Jul 2017
I think we'll have to chalk this one up to weirdness in Perflib. I'll see if I can open a bug with Microsoft, it definitely seems like bad and undesirable behavior, amplified by a few orders of magnitude by how we're interacting with WMI.
I've tried a few different things to see if it's possible to reduce the impact of this which might be useful to someone down the line:
HKEY_LOCAL_MACHINE\SOFTWARE\Microsoft\Windows NT\CurrentVersion\Perflib\Updating - setting this as a DWORD with a non-zero value caused queries to .PerfRawData. objects to fail after 16 minutes since the last time it re-initialised.
HKEY_LOCAL_MACHINE\SOFTWARE\Microsoft\Windows NT\CurrentVersion\Perflib\Disable Performance Counters - setting this to a DWORD with value 1 caused it to return no data when queried.
Thanks for your help, sorry I wasn't able to find a fix.
higels
on 10 Jul 2017
@higels Thank you very much yourself, a very thorough investigation! If you do get any information back from Microsoft, that would also be very interesting.
I guess we'll close this, as it appears there is not much we can do from what we know now.
carlpett
on 12 Jul 2017
I'm encountering the same issue but only on 2 out of 3 servers (no VMs):

Version: 0.2.7
Left server: Windows Server 2012 R2
Middle server: Windows Server 2008 R2
Right server: Windows Server 2012 R2
Never encoutered the issue on my Win 7 PC.
 alexandrul
on 16 Nov 2017
alexandrul
on 16 Nov 2017
I'm also experiencing this issue on multiple bare-metal Windows Server 2012 R2 hosts. Same symptoms - WMI process CPU spikes in 16-17 minute intervals.
While unlikely, I wouldn't fully discount the possibility that wmi_exporter is using WMI in a way that makes it hang. I've seen similar bugs in software before.
 leoluk
on 20 Jan 2018
leoluk
on 20 Jan 2018
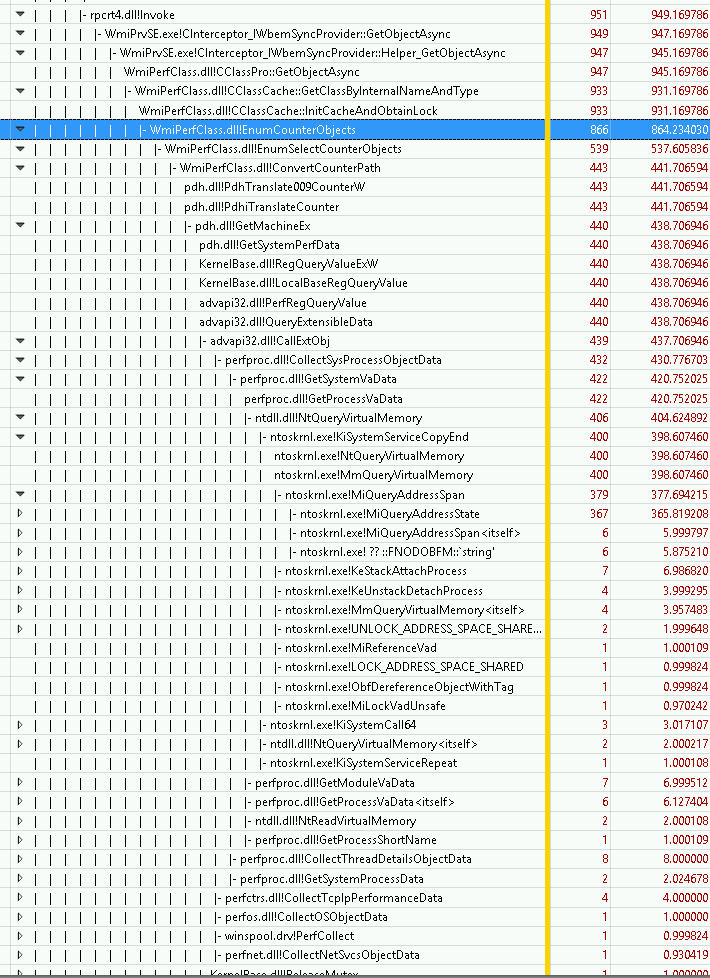
After some profiling, it looks like the WMI Provider Server regularly refreshes some sort of class name cache, calling EnumCounterObjects, which in turns reads a massive number of registry keys, in line with what @higels discovered. I haven't yet been able to figure out what triggers it.

It appears that EnumCounterObjects is not supposed to do this, and there's a fix in KB4038774 (and presumably the following non-security rollup, even though there's no further mention of it).
Addressed issue where the performance counter query causes CPU usage to increase for extended periods of time. This occurs because EnumCounterObjects() queries the data for all counters when it tries to get the names of all counters.
I see no mention of Windows Server 2008 being affected.
However, after installing the KB in question, I'm still getting timeouts.
leoluk
on 21 Jan 2018
I'm seeing the same things and initially logged issue #140, I did increase my scrape timeouts on the prometheus job and made things a bit better in terms of the missing gaps in the time series, however you can definitely still see in the exporter scrape duration I'm tracking.
also noticed that it depends on what options you have enabled in the wmi-exporter, i.e. having the defaults and IIS will increase considerably
very deterministic though
wmi-exporter defaults only
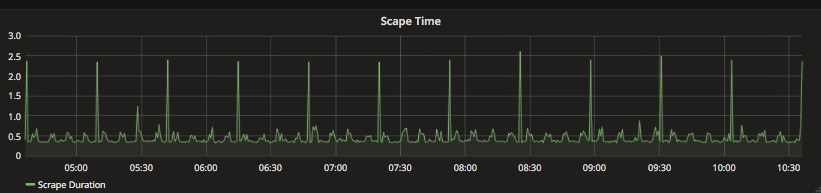
wmi-exporter with defaults + IIS enabled

 madeinoz67
on 16 Feb 2018
madeinoz67
on 16 Feb 2018
I think @leoluk's observations match closely what is going down. ("it looks like the WMI Provider Server regularly refreshes some sort of class name cache").
The issue seems to be with the wmi code we are using.
From our code, we call wmi.Query().
This function internally uses a Client https://github.com/StackExchange/wmi/blob/master/wmi.go#L74
It seems we are not initializing the Client used by wmi properly, as this comment indicates at line https://github.com/StackExchange/wmi/blob/master/wmi.go#L106:
// SWbemServiceClient is an optional SWbemServices object that can be
// initialized and then reused across multiple queries. If it is null
// then the method will initialize a new temporary client each time.
I can make an experimental program changing this behavior if someone's up for testing it
martinlindhe
on 16 Feb 2018
I can make an experimental program changing this behavior if someone's up for testing it
Sure, happy to test (separate branch is fine).
leoluk
on 16 Feb 2018
Great! Am working on such change now.
It will be a separate branch with a separate wmi_explorer.exe for testing
martinlindhe
on 16 Feb 2018
How is this different from https://github.com/martinlindhe/wmi_exporter/blob/94caf8ee61027bd02ae694353597741182b00829/exporter.go#L148 though?
leoluk
on 16 Feb 2018
@leoluk good question, i didn't consider this code :... Got to look through it some more, but with your comment it seems we already are doing this.
But your profile suggests its not working properly
martinlindhe
on 16 Feb 2018
My current assumption is that the bug is in Windows, not wmi_exporter. I can reproduce it by querying WMI through PowerShell and the hang is system-wide.
To me it appears like querying performance data via WMI, in low intervals, is fundamentally broken. About every 1000 seconds, there's a spike in query latency where WMI updates its list of perflib providers.
The KB lessens the impact by making it less expensive, but does not fully resolve the issue (it didn't help in my case). The refresh would have to happen asynchronously in a way that does not affect queries.
The reason this affects some users but not others is that the duration depends on the hardware configuration. On a tiny VM it took less than 6 seconds, much longer on beefy bare-metal hosts. Depending on scrape interval and timeout, it makes sense that it would only lead to issues in some configurations. Apparently, it takes a longer time the more RAM a host has. Stack profiling shows that the most expensive call is CollectSysProcessObjectData which in turns enumerates memory:
Even if you do not get timeouts, you'll probably see the spikes in the wmi_exporter_collector_duration_seconds metric:
sum by (instance) (max_over_time(wmi_exporter_collector_duration_seconds[1m]))
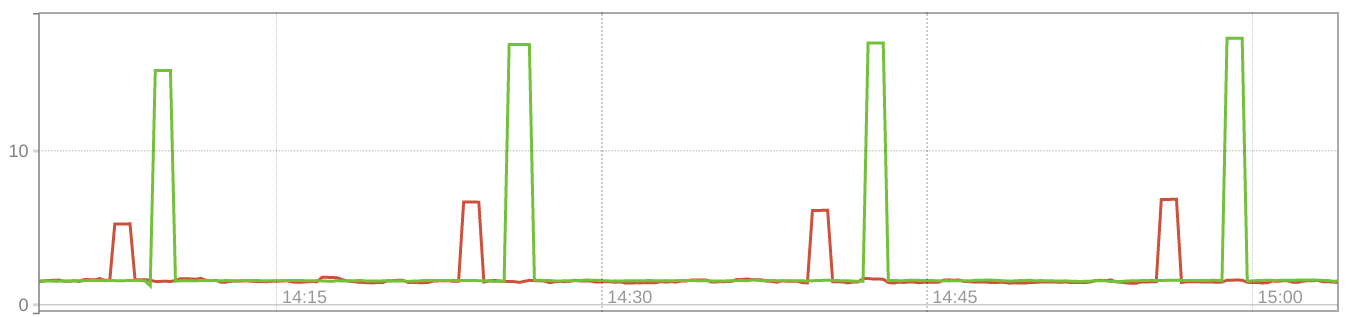
(red = VM, green = bare metal, for the bare-metal host one scrape fails so the actual value is even higher)
To me, this implies that in the presence of this bug, WMI is unsuitable for high-resolution performance monitoring. Even it does not lead to timeouts, it will slightly decrease accuracy.
This issue also explains a long-standing issue I've had with WMI blocking the Check_MK windows agent, which reported false CPU load spikes on hosts with more than 500GB of RAM, with three minute check intervals, mind you:

leoluk
on 16 Feb 2018
I've gone through the code more and realize the fix I was suggesting is already in code as @leoluk pointed out.
That would be the only possible cause in our end for such stall as far as I can figure.
Additionally, with more feedback from @leoluk it seems more plausible this is actually an issue in the WMI agent in Windows. (I don't like to simplifying stuff down to "not our bug", but it seems we cannot do much about it).
Sorry for the noise!
martinlindhe
on 16 Feb 2018
@leoluk Kudos on the very impressive troubleshooting here :)
Does this happen also by just running perfmon? That by default uses a much shorter interval than Prometheus, so it seems like it should see the issue as well?
carlpett
on 16 Feb 2018
Perfmon uses the PDH library, not WMI. I did not test with Perfmon, but PDH is not affected.
Here's a quick summary of the relationship: https://msdn.microsoft.com/en-us/library/windows/desktop/aa371643(v=vs.85).aspx
I've started to work on a Go library for the HKEY_PERFORMANCE_DATA interface. You basically do one RegQueryValueEx call and get a 300k binary blob in return that you'll have to parse yourself, but it has all the metrics in it and only takes a few ms to complete. Preliminary testing looks great so far.
leoluk
on 16 Feb 2018
@leoluk PDH sounds really interesting. Please keep us updated!
Googling, I found https://github.com/influxdata/telegraf/blob/master/plugins/inputs/win_perf_counters/pdh.go
martinlindhe
on 16 Feb 2018
Learning new things today :)
My previous, apparently faulty, understanding was that Perfmon used the subscription/async query method, so thus my interest in if that also caused issues.
I guess switching to a PDH approach would require quite a lot of changes, but very interesting idea nevertheless!
carlpett
on 16 Feb 2018
We've seen implications of issues with the windows WMI component in this project so many times by now, I think it might be a good idea to investigate use of PDH further.
martinlindhe
on 16 Feb 2018
Any further on this one chaps ? Cheers.
 pete-leese
on 28 Feb 2018
pete-leese
on 28 Feb 2018
@VR6Pete Please refrain from posting asking for status updates. It just contributes to spamming us.
I hope you understand, thanks.
martinlindhe
on 28 Feb 2018
Hi, owing to the fact that martin has already closed this I'll try to actually further some discussion by asking a couple questions. _I don't see a google group or IRC channel otherwise I'd use that._
Our team is encountering this issue on our systems as well, and we were able to replicate it using some of the procedures listed here.
leoluk's interpretation indicated that part of the issue here seems to be that WmiPerfClass.dll is regularly refreshing some sort of internal cache.
ExecQuery() does take in some flags: https://msdn.microsoft.com/en-us/library/aa390880(v=vs.85).aspx
I haven't tested them, but I know that contributors over on wmi.go were at one point considering changes to allow for these flags: https://github.com/StackExchange/wmi/issues/25
Is there a reason that passing those flags wouldn't be relevant to this issue? I'd expect @carlpett would have mentioned it otherwise.
If I'm following the plot here, it looks like WmiPerfClass.dll, at some interval, decides it wants to update a list it has. What doesn't seem to be clear is _what influences it's decision to do so_. It bears repeating that perhaps the way we are using ExecQuery (or rather, wmi.go is using it) in a way that is triggering some condition internally that causes it to update its list of providers for that reason. Is there additional data or interpretation that I'm missing that points to a design flaw?
 Ray-B
on 11 Apr 2018
Ray-B
on 11 Apr 2018
@Ray-B Correct, there is currently no other communication channel than the issues list. Perhaps something we should consider.
I was actually had not read that conversation over at the wmi-library, very interesting! My understanding is that these things are primarily for making each query more efficient (which in itself is of course something we should look into), rather than something which could avoid triggering the updates in WMI itself. However, since we don't really understand why this is happening anyway, it might be worth experimenting...
If I could find some time to build a prototype with the flags enabled, would you be able to run some testing with it?
carlpett
on 12 Apr 2018
@carlpett Sure, just me me know. We have an environment we can roll this to fairly rapidly.
Ray-B
on 12 Apr 2018
@Ray-B Did a quick spike, please let me know how well it works!
wmi_exporter-wbemflags.zip
In order to use the wbemFlagForwardOnly flag, I had to remove some allocation optimizations, so there might be a runtime hit. Interesting to know how noticeable that is as well
carlpett
on 12 Apr 2018
I also did some experimenting with these flags, with wbemFlagReturnImmediately and your build as well. Sadly does not make a difference for my setup :(
Here's what I've been working on: https://github.com/leoluk/perflib_exporter
It includes both a library for the perflib interface and a simple exporter. Godoc: https://godoc.org/github.com/leoluk/perflib_exporter/perflib
Performance has been great on my staging systems with most scrapes completing within a few dozen milliseconds, including full service and process list. Once the remaining tasks are completed and the interface is stable, it will be used in a large Windows production setup.
Feedback would be highly appreciated, especially about the perflib API - I designed it such that it could be used by projects like wmi_exporter.
leoluk
on 13 Apr 2018
@carlpett I work with @Ray-B and I wanted to update you on the results of running the spike from above. Sadly the issue is still present, and occurs with on a similar interval.
 davidwin93
on 26 Apr 2018
davidwin93
on 26 Apr 2018
We probably should re-open this, since it is still quite actively discussed.
carlpett
on 12 May 2018
@leoluk Hey, how stable is your perflib_exporter?
Asking here, because it looks like all interested people are here.
 JaPyR
on 25 Jun 2018
JaPyR
on 25 Jun 2018
It's ready for testing. It has been running in a staging environment for the past four months without missing scrapes or misbehaving, so I consider the perflib library stable.
However, there a a few edge cases in the name mangling code left to fix which will change the output, so that part isn't stable yet. You can expect a beta release within the next weeks.
If anyone wants to contribute, send me an email!
leoluk
on 26 Jun 2018
I confirm this would be very interesting to not have those blank phases.
Hosts are wrongly reported down in our case (After 2 minutes of failed scrapping).
 kedare
on 3 Jul 2018
kedare
on 3 Jul 2018
If I can get my hands on a compiled test version of the exporter, I could test it and see if #204 can be solved.
 FLeven
on 17 Jul 2018
FLeven
on 17 Jul 2018
In case you're referring to perflib_exporter, there's a test version on the releases page: https://github.com/leoluk/perflib_exporter/releases
I'm actively working on getting it production-ready.
leoluk
on 17 Jul 2018
Previously mentioned on this forum:
higels commented on Jul 10, 2017 mentioned opening a bug ticket to Microsoft support. Is there a link to that Microsoft Bug report support ticket?
 TreTru
on 11 Sep 2018
TreTru
on 11 Sep 2018
I was told by an ex-MS employee that this would be unlikely to be fruitful - I should have mentioned that here.
As is happens, I just started looking at the perflib exporter this morning.
higels
on 11 Sep 2018
Thank you for the update Higels.
TreTru
on 11 Sep 2018
Update: I also _had_ this problem for a long time in virtually all of my Windows servers.
However, today I just noticed this problem is not happening anymore in Windows Server 2016 (it _does_ happen yet in Windows Server 2012 R2).
Since all my servers have Windows Updates enabled, I suppose this was fixed by Microsoft in some recent update.
Unfortunately I don't have a large Prometheus history to point more exactly _when_ the problem was fixed.
If anyone here could corroborate with my theory this would be very useful for everyone. 😉
 fdcastel
on 9 Jan 2019
fdcastel
on 9 Jan 2019
Yes, it's fixed in 2016 (and has been for a while) but not 2012.
leoluk
on 9 Jan 2019
I'm seeing this on windows 2016, does someone know which windows update that solved this issue?
 johi12
on 4 Apr 2019
johi12
on 4 Apr 2019
Hey all,
I've just build a preview release (that is, don't push this onto everything you have just yet): https://github.com/martinlindhe/wmi_exporter/releases/tag/v0.7.999-preview.2
Would be great if you have time to test it and give some feedback on whether it helps you!
carlpett
on 25 May 2019
Tested with scrape timeout 60s:

Dash for 30 last min:

Dash for 3hour:

11-30 start tesing new version.
12-10 - old version.
12-25 - new version for get logs.
 Teriand
on 27 May 2019
Teriand
on 27 May 2019
Thanks @Teriand,
That doesn't look like it helped much :( Have you adjusted Prometheus' scrape timeout? It is 10s by default, so even if the exporter aborts after 60s, Prometheus will have given up a long time ago.
carlpett
on 27 May 2019
global:
  scrape_interval:     15s # Set the scrape interval to every 15 seconds. Default is every 1 minute.
  evaluation_interval: 15s # Evaluate rules every 15 seconds. The default is every 1 minute.
  scrape_timeout: 15s
Yes, the scrape timer is 15 seconds.
But with the old wmi this was enough.
And timeout cant more interval.
Teriand
on 27 May 2019
What I would have expected would be that you'd still get "holes" for the metrics that we time out internally in the exporter, but that up and any data that was able to complete before the timeout should be available (given that the wmi timeout is set to shorter than the Prometheus timeout, that is).
From your graphs though, it looks like this version is actually slower than the previous version, which is curious, and worrying. What is the previous version you use? Could you try running wmi_exporter with --scrape.max-duration 10s?
carlpett
on 27 May 2019
start test 9-30, with 10s
and 9-37 change priority to high

last 1h
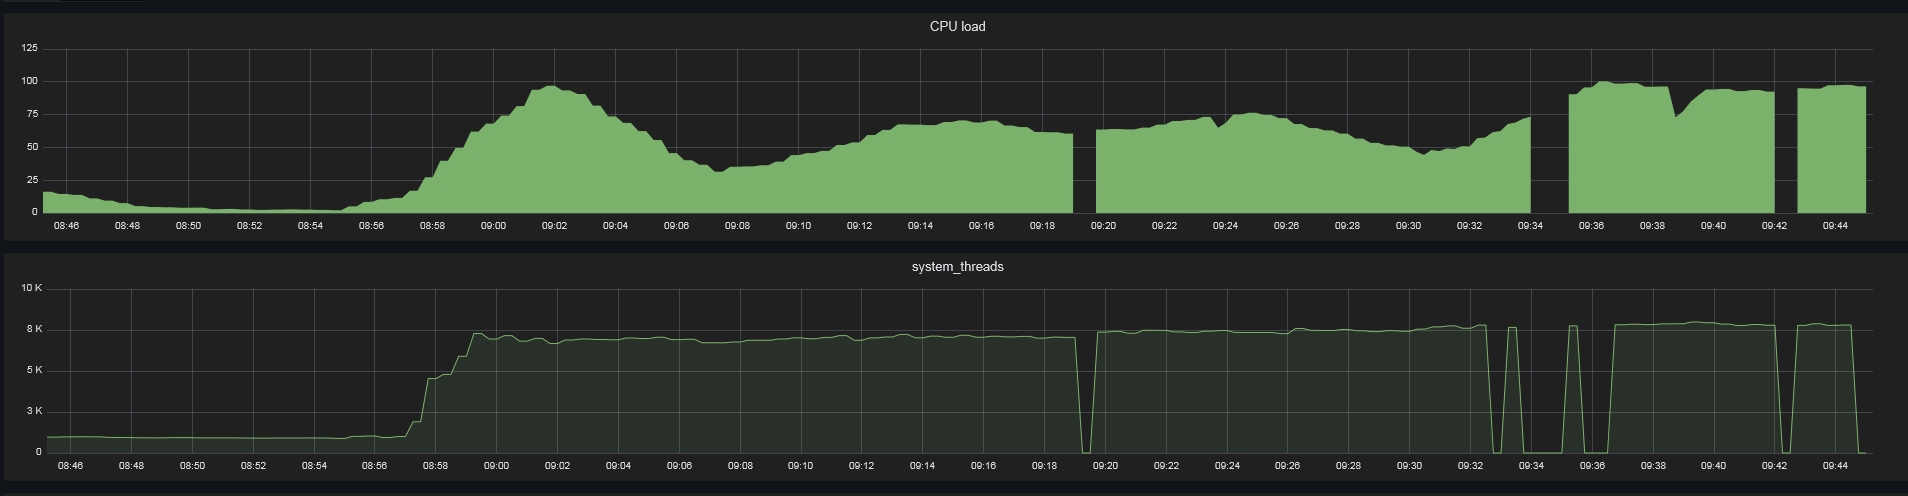
last 30min
current wmi-exporter version - from 20.12.17 (dont update after i merge msmq support)
Teriand
on 28 May 2019
Since the cpu collector was moved to perflib in v0.8.0, and a number of other collectors in v0.9.0, is this no longer an issue? Or are there other collectors which still trigger the problem?
 candlerb
on 4 Dec 2019
candlerb
on 4 Dec 2019

This issue has been solved for me :+1:
 corny
on 5 Dec 2019
corny
on 5 Dec 2019
Nice - maybe this issue can be closed then.
candlerb
on 5 Dec 2019
I've got release v0.10.2 (the newest as of this date) installed on multiple AWS EC2 instances running Windows Server 2016 and I still see this problem in my collector metrics. It seems to specifically impact iis, process, and .NET framework based collectors.

 AbsorbJonny
on 27 Mar 2020
AbsorbJonny
on 27 Mar 2020
I believe this will remain a problem as long as we use WMI. We've successfully migrated a lot of them to perflib, but there are still quite a few remaining. And some of them, such as the cs collector, cannot be migrated to Perflib since the data isn't available there.
So in some sense I suspect this issue will remain relevant for quite some time, although less and less for each release.
carlpett
on 27 Mar 2020
I believe this will remain a problem as long as we use WMI. We've successfully migrated a lot of them to perflib, but there are still quite a few remaining. And some of them, such as the
cscollector, cannot be migrated to Perflib since the data isn't available there.
So in some sense I suspect this issue will remain relevant for quite some time, although less and less for each release.
@carlpett Yes unfortunately.
I was just hunting down an issue like this on version 0.14 and it seems to be caused by the logon collector. Once I took that out of the list the duration of a scrape dropped from ~4.5 seconds to < 0.5 seconds (likely because the machine in question was running exchange with a lot of connections / sessions).
But in addition there seem to be no more spikes happening without the logon collector until now. I configured two equal machines, one with and the other without logon to see if this theory hold up.
 frittentheke
on 15 Oct 2020
frittentheke
on 15 Oct 2020
OP here... I completely forgot to update this issue.
We randomly found out what made the scrapes jam up so badly in our particular use-case. We had left a virtual media ISO mounted through the iDrac (Dell's BMC thing). As soon as we unmounted that, the impact of the 17 minute scrape went from a many 10s of seconds down to a more normal time.
So, if you are:
- running windows_exporter
- mounting virtual media based ISOs
- running server 2016
- have another application that hits WMI very frequently
Then, just make sure you unmount the ISO when you aren't using it.
higels
on 15 Oct 2020
We randomly found out what made the scrapes jam up so badly in our particular use-case. We had left a virtual media ISO mounted through the iDrac (Dell's BMC thing). As soon as we unmounted that, the impact of the 17 minute scrape went from a many 10s of seconds down to a more normal time.
[...]Then, just make sure you unmount the ISO when you aren't using it.
Thanks, I double checked that, but that was not the issue in my case - disabling the logon collector makes all the difference:
With logon enabled:

When running without logon:

Mind the scaling! As you can see logon causes rather long scrapes per-se, but really kills the metrics scraping once some load / more exchange connections come in.
@carlpett do you see any chance of improving the performance on collecting session data?
Should I raise another issue since this is not about cpu, but logon?
frittentheke
on 16 Oct 2020
From a quick look there doesn't appear to be an equivalent perflib counter for Win32_LogonSession :disappointed:
At the minimum I think it's worth documenting the potential performance impact of the collector.
 breed808
on 16 Oct 2020
breed808
on 16 Oct 2020
@breed808 thanks a lot for looking into this issue so quickly.
If switching PerfLib is not possible, maybe there is potential for optimizing the query?
I suspect not simply querying all fields / details of the Win32_LogonSession WMI (https://github.com/prometheus-community/windows_exporter/blob/master/collector/logon.go#L54) might make a big difference.
Maybe there even is another metric just giving the number of logins without all those expensive details to be fetched?
frittentheke
on 19 Oct 2020
@frittentheke I haven't found any good sources for those metrics aside from the LogonSession class either, sadly. Re efficient querying, if you have a busy server to test on, could you share the results from running these two?
Measure-Command -Expression {Get-WmiObject -query "SELECT * FROM Win32_LogonSession"}
Measure-Command -Expression {Get-WmiObject -query "SELECT LogonType FROM Win32_LogonSession"}
I haven't seen major differences previously, but I suspect the people seeing issues with the logon collector might have much larger datasets, so worth testing!
carlpett
on 19 Oct 2020
@carlpett I ran those commands ... but apparently there is not much of a difference:
Measure-Command -Expression {Get-WmiObject -query "SELECT * FROM Win32_LogonSession"}


Days              : 0
Hours             : 0
Minutes           : 0
Seconds           : 4
Milliseconds      : 821
Ticks             : 48213496
TotalDays         : 5,58026574074074E-05
TotalHours        : 0,00133926377777778
TotalMinutes      : 0,0803558266666667
TotalSeconds      : 4,8213496
TotalMilliseconds : 4821,3496
Measure-Command -Expression {Get-WmiObject -query "SELECT LogonType FROM Win32_LogonSession"}


Days              : 0
Hours             : 0
Minutes           : 0
Seconds           : 4
Milliseconds      : 584
Ticks             : 45848030
TotalDays         : 5,3064849537037E-05
TotalHours        : 0,00127355638888889
TotalMinutes      : 0,0764133833333333
TotalSeconds      : 4,584803
TotalMilliseconds : 4584,803
I'm NOT having any problems with this issue anymore. I always thought it was fixed by some Windows Update.
That said, I did the same tests on both Windows Server 2016 and Server 2019.
Windows Server 2016 (Version 10.0.14393 / 83 users currently logged in / AvgCpu*: 22%)
Measure-Command -Expression {Get-WmiObject -query "SELECT LogonType FROM Win32_LogonSession"}
TotalMilliseconds : 791,1173

Measure-Command -Expression {Get-WmiObject -query "SELECT * FROM Win32_LogonSession"}
TotalMilliseconds : 1159,6284
Windows Server 2019 (Version 10.0.17763.1518 / 101 users currently logged in / AvgCpu*: 19%)
Measure-Command -Expression {Get-WmiObject -query "SELECT LogonType FROM Win32_LogonSession"}
TotalMilliseconds : 747,9188

Measure-Command -Expression {Get-WmiObject -query "SELECT * FROM Win32_LogonSession"}
TotalMilliseconds : 844,6833
These numbers are considerably faster than the ones posted by @frittentheke. Maybe my servers have some update that aren't present in the ones having the problem? I'm available to investigate this matter further, if you wish.
_Edit: * Added average CPU usage in the last 3 hours_
fdcastel
on 19 Oct 2020
@fdcastel thanks for posting the queries on your systems. I believe my > 2k logon sessions due to exchange running on this machine might be the issue for the difference in performance.
I run Win 2016 with a quite recent patch level. Do you believe there is a particular patch I should check for then?
frittentheke
on 20 Oct 2020
I believe my > 2k logon sessions (...)
There's always an explanation 😄
I run Win 2016 with a quite recent patch level. Do you believe.If there is a particular patch I should check for then?
No. I'm sorry. I'm just trying to keep the servers up-to-date, mostly for security reasons. But I don't keep a close watch on every patch release.
It was just a hunch, given the significant difference in the times I saw. But, surely, 20x more users could explain it 😅.
fdcastel
on 22 Oct 2020
Related issues
 liyang010813
·
4Comments
liyang010813
·
4Comments
 Knuspel
·
5Comments
Knuspel
·
5Comments
 amitsaha
·
5Comments
amitsaha
·
5Comments
 Gerthum
·
9Comments
Gerthum
·
9Comments
 lngphp
·
4Comments
lngphp
·
4Comments
Most helpful comment
I also did some experimenting with these flags, with wbemFlagReturnImmediately and your build as well. Sadly does not make a difference for my setup :(
Here's what I've been working on: https://github.com/leoluk/perflib_exporter
It includes both a library for the perflib interface and a simple exporter. Godoc: https://godoc.org/github.com/leoluk/perflib_exporter/perflib
Performance has been great on my staging systems with most scrapes completing within a few dozen milliseconds, including full service and process list. Once the remaining tasks are completed and the interface is stable, it will be used in a large Windows production setup.
Feedback would be highly appreciated, especially about the perflib API - I designed it such that it could be used by projects like wmi_exporter.