Webrender: Bad performance when rendering long list of links separated with commas.
Hi,
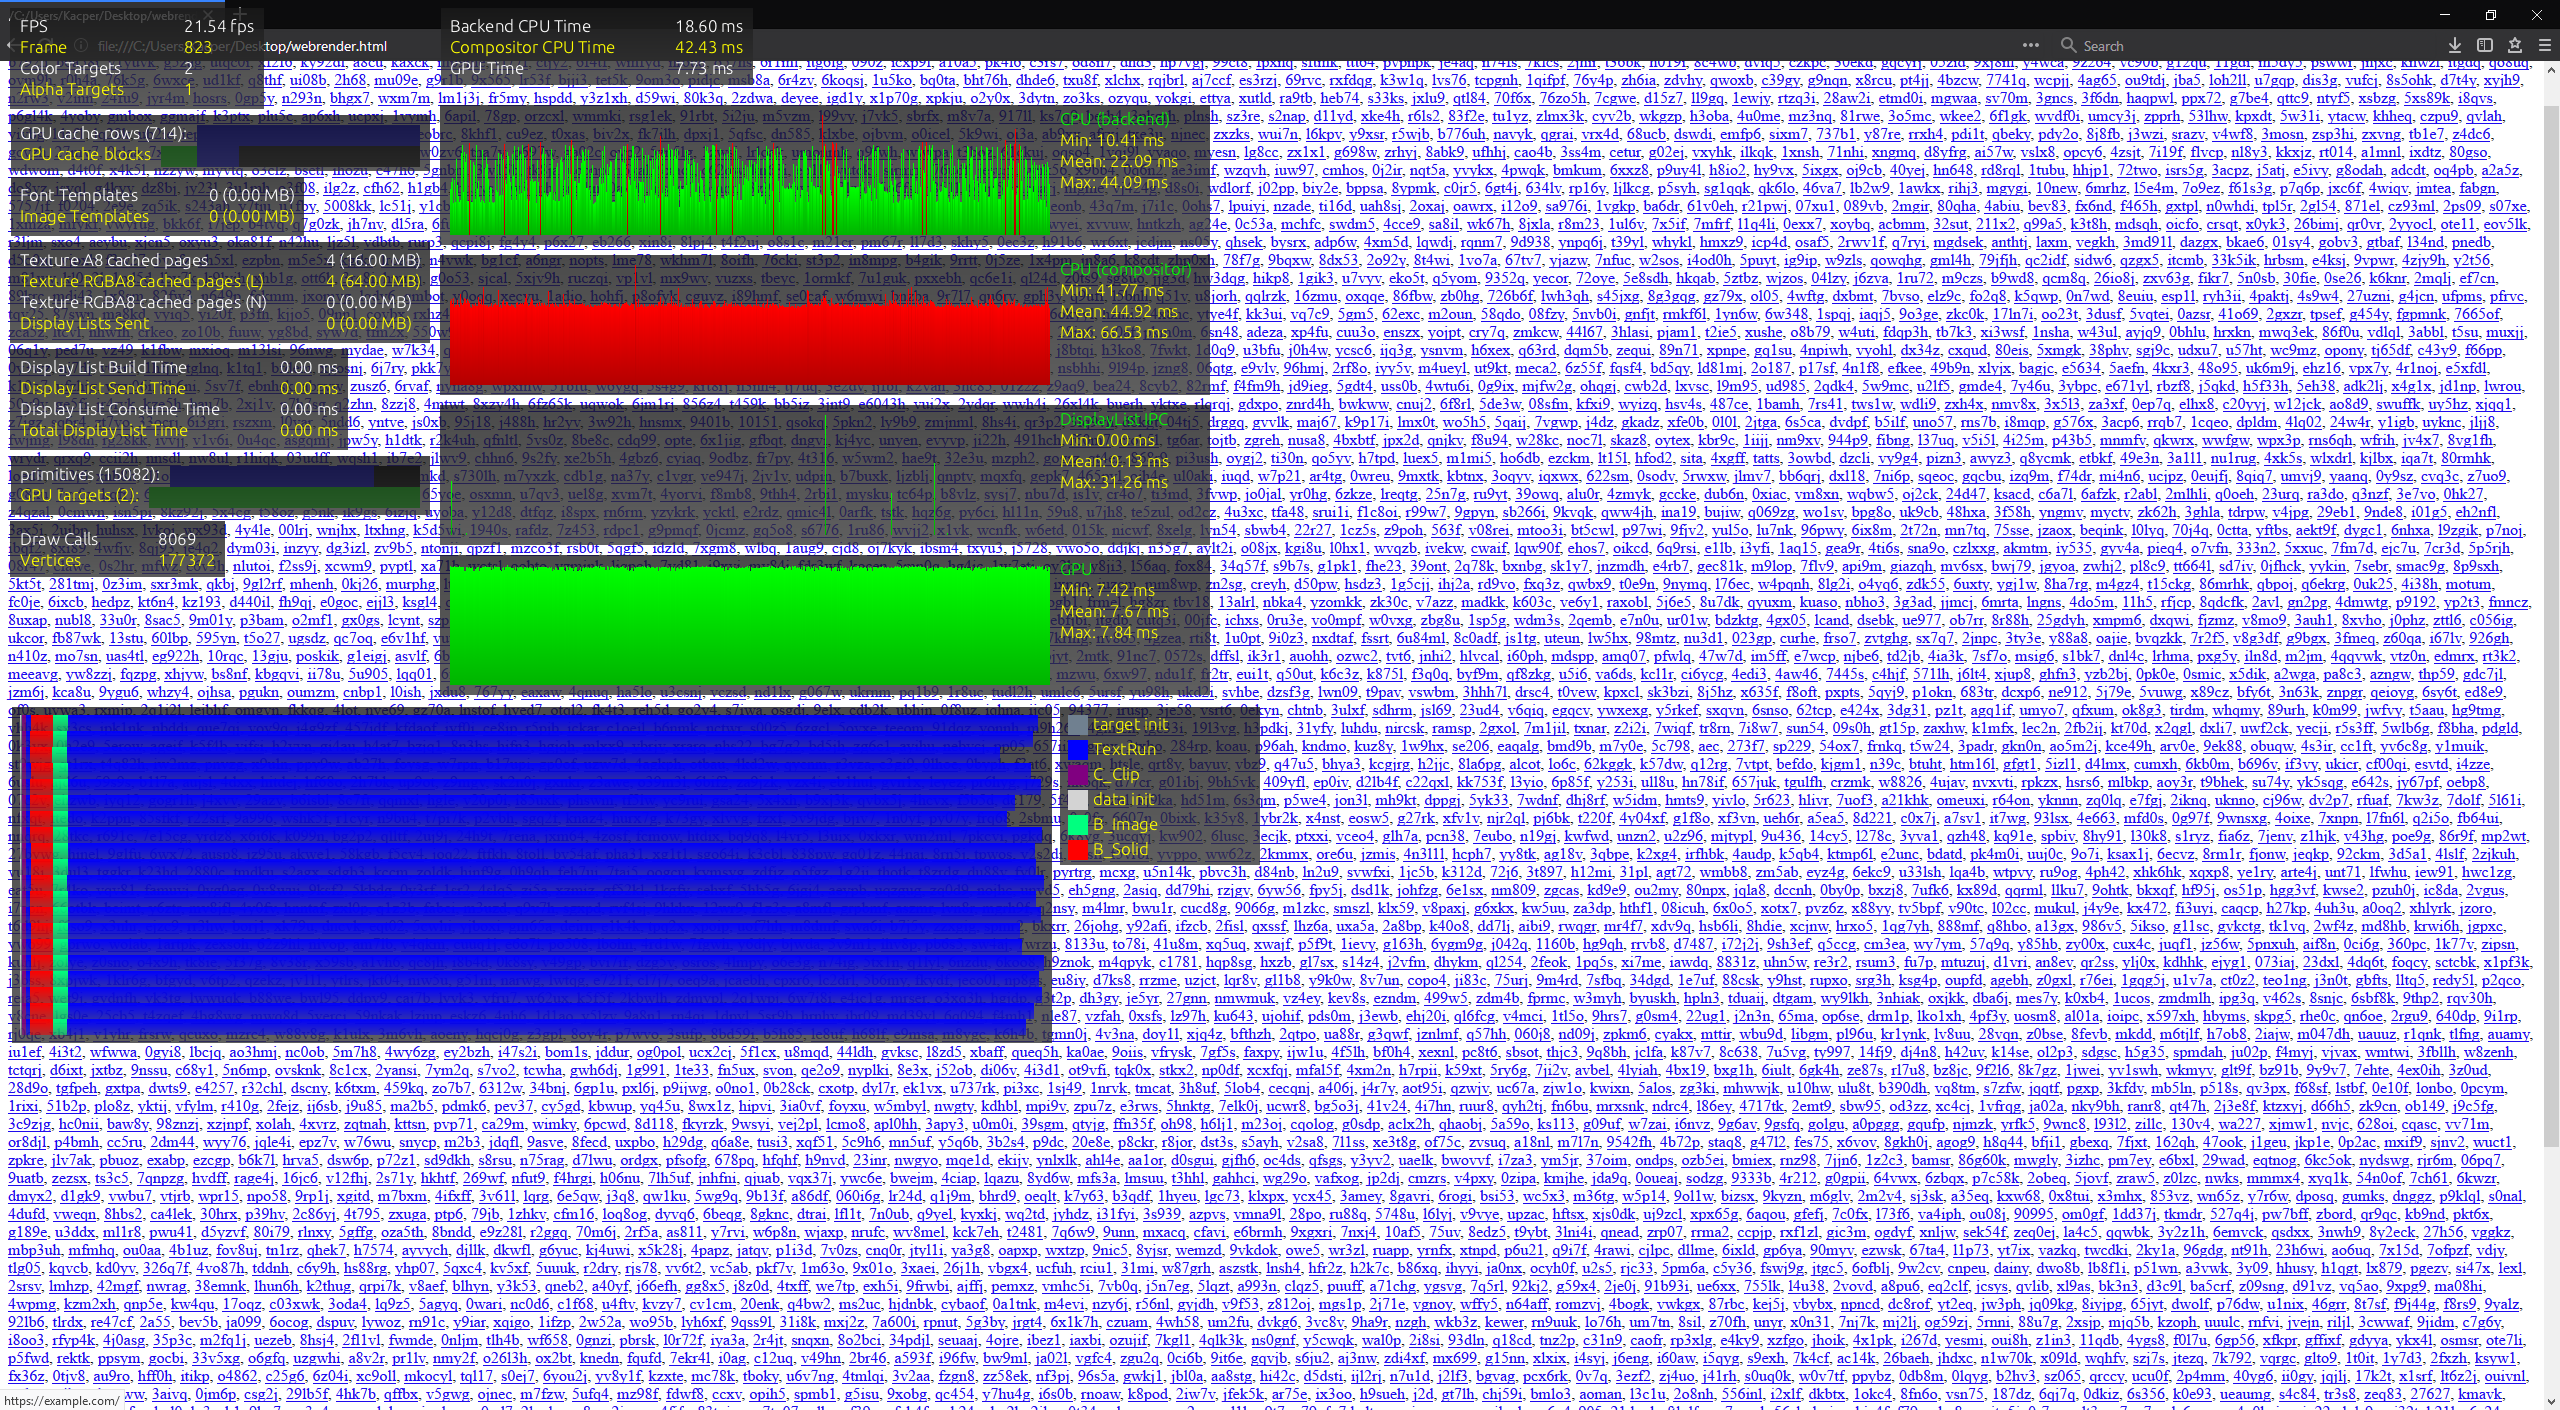
I noticed that one page works really slow with webrender enabled. It turned out to be a list of links. It tanks compositor performance and CPU backed to a lesser degree. With 5000 links I get 45ms mean when scrolling on decent CPU. And it spikes to 160ms when selecting text. You can see the attached screenshot for profiler view after little bit of scrolling the page.
Click for screenshot
It happens when links are separated with commas. Probably matter of having alternating text color or something.
Here is the page that you can reproduce the issue.
<!DOCTYPE html>
<html lang="en">
<head>
</head>
<body>
    <script>
        for (let i = 0; i < 5000; ++i) {
            const str = (Math.random() + 1).toString(36).substring(7);
            document.body.insertAdjacentHTML('beforeend', `<a href="https://example.com/">${str}</a>, `);
        }
    </script>
</body>
</html>
Regards,
Kacper
 kasper93
All 17 comments
I'd guess that we are switching the batches too match here, and transitioning towards a single image brush draw call for all transparent things would help. More investigation to follow.
 kvark
on 20 Jun 2018
kvark
on 20 Jun 2018
Hi,
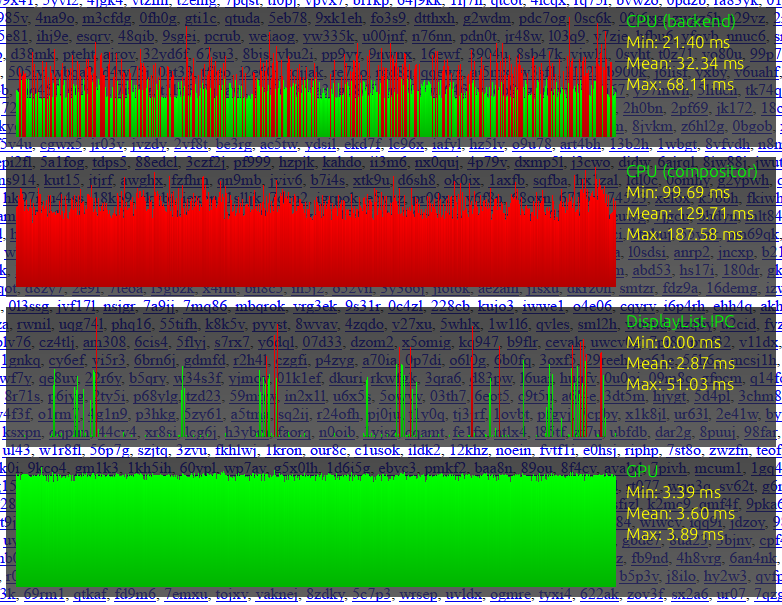
Any news about this? I'm asking because recent version is actually 3 times slower than one tested in original report. Which makes even smaller lists to produce lags. Original testcase now takes 130 ms per frame in CPU compositor. Should I create issue on bugzilla, not sure where you track issues more?
Click for screenshot
kasper93
on 24 Oct 2018
Taking another look. We are making 30K draw calls, which is the major problems. Expected draw call count should be within 100. And the reason for this is because the text underline is a solid primitive, and we end up interlacing it with text primitives, breaking all the batches.
kvark
on 25 Oct 2018
Is this something picture caching can/should solve? (browsers do indeed observably draw these things interlaced, not sure if doing anything at the display-list level to deinterlace them would be strictly web compatible)
 Gankra
on 25 Oct 2018
Gankra
on 25 Oct 2018
Picture caching is sort of a universal answer to anything:
- look, there is something stupid we do, and it costs us!
- oh, but with picture caching we'll only do it once!
I'd like to see an orthogonal solution here. For instance, what's stopping us to render all the underline (given that it's solid rects) in the opaque pass?
kvark
on 25 Oct 2018
I expect we could add an optimization that checks the line style and determines if it's opaque (so in this case checking that the style is "solid" should be sufficient). The fact that it's interleaved with definitely-non-opaque text isn't a problem for that?
Gankra
on 25 Oct 2018
Not at all. The problem only occurs when some semi-transparent stuff is interleaved with another. Shoving anything into the opaque pass is a huge win.
kvark
on 25 Oct 2018
The underlines, if they are line-style: solid, _should_ be getting drawn as rectangles in the opaque pass. If they're not, that's a bug!!
 gw3583
on 25 Oct 2018
gw3583
on 25 Oct 2018
@gw3583 I'm on it ;)
kvark
on 25 Oct 2018
@gw3583 btw, would you see any issues drawing the dashes/dotted decorations in opaque pass, given that they need to be snapped?
kvark
on 25 Oct 2018
There is AA on at least the dots and wavy styles, so they probably need to be alpha pass. The dashes are done via image repeat, so we'd probably need to introduce discard into brush_image, which doesn't seem ideal?
gw3583
on 25 Oct 2018
Note that my #3232 only addresses the rendering and scrolling issues. There is more to this case: display lists are humongous, which is seen every time the selection changes. We spend > 50ms just sending the DLs and then about 30ms in the WR backend processing them...
kvark
on 25 Oct 2018
Note that my #3232 only addresses the rendering and scrolling issues
Improvement is huge. On 2560x1400 resolution I get around 30fps when scrolling. (i7 5820k and R9 390) but it is no longer visible on first glance in real websites. Still pure CPU rendering is faster tho.
There is more to this case: display lists are humongous, which is seen every time the selection changes. We spend > 50ms just sending the DLs and then about 30ms in the WR backend processing them...
On my end it takes 1800-2200 ms on DL IPC. Basically when anything is selected on page it tanks the performance. Maybe we should keep this issue open for further improvements?
kasper93
on 28 Oct 2018
I think the "IPC" time might just be us choking on https://bugzilla.mozilla.org/show_bug.cgi?id=1435931#c4 which is largely an upstream gecko bug
Gankra
on 29 Oct 2018
Yeah selecting text on my mac spends 24 seconds stuck computing text selection indices: http://bit.ly/2zbWKcq
You see this as a massive spike in the "DisplayList IPC" graph because that graph covers the time from starting to construct the display list to having fully consumed the display list in the webrender backend. The time we get stuck computing selections is done inside CreateWebrenderCommands for text display items (to determine style changes and whether to draw a box around that item), so it gets charged against display list construction time (which is in fact an accurate claim).
Gankra
on 29 Oct 2018
this was improved a lot by @mattwoodrow in the lastest nightly, but it still takes multiple seconds for a selection change to appear on the screen in webrender
Gankra
on 31 Oct 2018
Gankra
on 31 Oct 2018
Related issues
 mstange
·
4Comments
Gankra
·
4Comments
mstange
·
4Comments
Gankra
·
4Comments
 jrmuizel
·
5Comments
mstange
·
4Comments
jrmuizel
·
5Comments
mstange
·
4Comments
 Darkspirit
·
4Comments
Darkspirit
·
4Comments
Most helpful comment
Improvement is huge. On 2560x1400 resolution I get around 30fps when scrolling. (i7 5820k and R9 390) but it is no longer visible on first glance in real websites. Still pure CPU rendering is faster tho.
On my end it takes 1800-2200 ms on DL IPC. Basically when anything is selected on page it tanks the performance. Maybe we should keep this issue open for further improvements?