Webpack: Webpack4 has memory leak in development mode
Do you want to request a feature or report a bug?
bug
What is the current behavior?
The memory increased when running webpack4 in development, and the memory didn't release. So there was memory leak.
Then node will throw error
JavaScript heap out of memory
I saw the heapsnapshot, there was many repeated String Objects which were compiled by webpack.
If the current behavior is a bug, please provide the steps to reproduce.
run webpack development mode with , update the business code and waiting rebuild, then update the code...you will see the increasing memory.
What is the expected behavior?
Clear memory in time.
If this is a feature request, what is motivation or use case for changing the behavior?
Please mention other relevant information such as the browser version, Node.js version, webpack version, and Operating System.
[email protected]
 zD98
zD98
All 156 comments
@zD98 Please create minimum reproducible test repo
 alexander-akait
on 2 Apr 2018
alexander-akait
on 2 Apr 2018
project git: https://github.com/zD98/webpack-memory-test
npm start
Because the repo is very small, so multiple operations that change code quickly can increase the memory, and it would not be released.
zD98
on 2 Apr 2018
Having same issue on webpack 4.5.0.
The webpack just crash (out of memory) after a few incremental rebuilds
 zlk89
on 7 Apr 2018
zlk89
on 7 Apr 2018
Unchanged module string should be compiled and cached once. Unchanged modules are compiled every time in rebuilding Now. So does the CachePlugin have some errors ?
zD98
on 9 Apr 2018
I just upgraded from 3.10.0 to 4.5.0 and I'm seeing this sporadically in development:
i 「wdm」: Compiling...
webpack building...

<--- Last few GCs --->

[9284:000000000028FA40]  1100280 ms: Mark-sweep 1385.1 (1411.9) -> 1385.1 (1411.9
) MB, 292.3 / 0.1 ms  allocation failure GC in old space requested
[9284:000000000028FA40]  1100624 ms: Mark-sweep 1385.1 (1411.9) -> 1385.1 (1407.9
) MB, 343.1 / 0.1 ms  last resort GC in old space requested
[9284:000000000028FA40]  1100867 ms: Mark-sweep 1385.1 (1407.9) -> 1385.1 (1407.9
) MB, 243.6 / 0.1 ms  last resort GC in old space requested


<--- JS stacktrace --->

==== JS stack trace =========================================

Security context: 000003025D1257C1 <JSObject>
    0: builtin exit frame: lastIndexOf(this=000003B48B1F6031 <Very long string[60
6700]>,00000315AAE8BF89 <String[1]\: \n>)

    1: /* anonymous */(aka /* anonymous */) [C:\www\node\poject\node_modu
les\webpack-sources\node_modules\source-list-map\lib\SourceListMap.js:~100] [pc=0
000029834AF4F94](this=0000006331D822D1 <undefined>,sln=00000157ABFAF271 <SourceNo
de map = 0000026155AF2B41>)
 ...

FATAL ERROR: CALL_AND_RETRY_LAST Allocation failed - JavaScript heap out of memor
y
 1: node_module_register
 2: v8::internal::FatalProcessOutOfMemory
 3: v8::internal::FatalProcessOutOfMemory
 4: v8::internal::Factory::NewRawTwoByteString
 5: v8::internal::Smi::SmiPrint
 6: v8::internal::StackGuard::HandleInterrupts
 7: v8::internal::SlicedString::SlicedStringGet
 8: v8_inspector::protocol::Debugger::API::SearchMatch::fromJSONString
 9: v8_inspector::protocol::Debugger::API::SearchMatch::fromJSONString
10: 0000029833B86B21
The only change I made to my config file was adding mode: 'development'.
 colinrobertbrooks
on 12 Apr 2018
colinrobertbrooks
on 12 Apr 2018
@colinrcummings can you create minimum reproducible test repo?
alexander-akait
on 12 Apr 2018
@evilebottnawi, see above. I was able to reproduce it with this test repo by making "multiple operations that change code quickly" as @zD98 indicates.
colinrobertbrooks
on 12 Apr 2018
This is the list of changes between the two modes https://medium.com/webpack/webpack-4-mode-and-optimization-5423a6bc597a so I'd disable each and see if it fixes anything. I'm slowly going through them now but for us even production eventually blows up. I imagine more people don't run production in development and so maybe it hasn't been spotted.
 briandipalma
on 19 Apr 2018
briandipalma
on 19 Apr 2018
What might be the easiest way to fix this is to disable both modes but I can't find anything in the documentation for that.
briandipalma
on 19 Apr 2018
mode = "none" still blows up...I'm not sure mode is the issue.
briandipalma
on 19 Apr 2018
@briandipalma problem not in mode, problem inside plugin, need detect there and fix it
alexander-akait
on 19 Apr 2018
@evilebottnawi do you have some suggestions about detecting which plugin has problem? I can't get any ideas from the source code.
zD98
on 19 Apr 2018
The use case where it's blowing up for us is during testing with webpack-karma. We launch ~40 sets of tests with a new compiler serially eventually it gets to ~30 in the list and node blows up. This worked OK with Webpack 3 and webpack-karma for Webpack 3.
I don't understand how this leak could work though, as we launch a new Karma Server per package (https://github.com/caplin/caplin-dev-tools/blob/master/karma-test-runner/src/utils.js#L90-L120) so that means a new compiler. Once the tests are finished wouldn't it garbage collect the compiler, is there some global cache that Webpack keeps adding to and needs cleaning down?
briandipalma
on 20 Apr 2018
@zD98 just enable/disable loaders/plugins and run profile plugin
alexander-akait
on 20 Apr 2018
Same problem here. It seems that it happens after I upgraded webpack to 4.6.0
<--- Last few GCs --->

[2412:0x104002400] 25996906 ms: Mark-sweep 1379.2 (1478.5) -> 1379.1 (1479.5) MB, 1530.3 / 0.0 ms  allocation failure GC in old space requested
[2412:0x104002400] 25998428 ms: Mark-sweep 1379.1 (1479.5) -> 1379.1 (1443.0) MB, 1521.6 / 0.0 ms  last resort GC in old space requested
[2412:0x104002400] 25999977 ms: Mark-sweep 1379.1 (1443.0) -> 1379.1 (1443.0) MB, 1548.5 / 0.0 ms  last resort GC in old space requested


<--- JS stacktrace --->

==== JS stack trace =========================================

Security context: 0x1249908a55e9 <JSObject>
    1: update [internal/crypto/hash.js:57] [bytecode=0x1249429dddd9 offset=128](this=0x12499a34faf9 <Hash map = 0x12493c8ff401>,data=0x12499a34fa31 <Very long string[993669]>,encoding=0x1249334022d1 <undefined>)
    2: update [/Users/Carter/newlook/node_modules/webpack/lib/util/createHash.js:25] [bytecode=0x1249429d98b9 offset=85](this=0x12499a34fc61 <BulkUpdateDecorator map = 0x12493c8ff4b1>,da...

FATAL ERROR: CALL_AND_RETRY_LAST Allocation failed - JavaScript heap out of memory
 1: node::Abort() [/usr/local/bin/node]
 2: node::OnFatalError(char const*, char const*) [/usr/local/bin/node]
 3: v8::Utils::ReportOOMFailure(char const*, bool) [/usr/local/bin/node]
 4: v8::internal::V8::FatalProcessOutOfMemory(char const*, bool) [/usr/local/bin/node]
 5: v8::internal::Factory::NewRawTwoByteString(int, v8::internal::PretenureFlag) [/usr/local/bin/node]
 6: v8::internal::String::SlowFlatten(v8::internal::Handle<v8::internal::ConsString>, v8::internal::PretenureFlag) [/usr/local/bin/node]
 7: v8::String::WriteUtf8(char*, int, int*, int) const [/usr/local/bin/node]
 8: node::StringBytes::Write(v8::Isolate*, char*, unsigned long, v8::Local<v8::Value>, node::encoding, int*) [/usr/local/bin/node]
 9: node::StringBytes::InlineDecoder::Decode(node::Environment*, v8::Local<v8::String>, v8::Local<v8::Value>, node::encoding) [/usr/local/bin/node]
10: node::crypto::Hash::HashUpdate(v8::FunctionCallbackInfo<v8::Value> const&) [/usr/local/bin/node]
11: v8::internal::FunctionCallbackArguments::Call(void (*)(v8::FunctionCallbackInfo<v8::Value> const&)) [/usr/local/bin/node]
12: v8::internal::MaybeHandle<v8::internal::Object> v8::internal::(anonymous namespace)::HandleApiCallHelper<false>(v8::internal::Isolate*, v8::internal::Handle<v8::internal::HeapObject>, v8::internal::Handle<v8::internal::HeapObject>, v8::internal::Handle<v8::internal::FunctionTemplateInfo>, v8::internal::Handle<v8::internal::Object>, v8::internal::BuiltinArguments) [/usr/local/bin/node]
13: v8::internal::Builtin_Impl_HandleApiCall(v8::internal::BuiltinArguments, v8::internal::Isolate*) [/usr/local/bin/node]
14: 0x1c55607842fd
15: 0x1c556083d196
16: 0x1c556083d196
17: 0x1c556078535f
18: 0x1c556083d196
make: *** [Makefile:2: dev] Abort trap: 6
 CarterLi
on 23 Apr 2018
CarterLi
on 23 Apr 2018
@CarterLi Can you create minimum reproducible test repo?
alexander-akait
on 23 Apr 2018
I've figured out our major problem, it was Karma. PR here https://github.com/karma-runner/karma/pull/2981 I think there are other leaks still present but they are smaller. It looks like my issue wasn't the same as this one anyway.
briandipalma
on 23 Apr 2018
same when I use development mode.
 gaterking
on 1 May 2018
gaterking
on 1 May 2018
I am having the same issue when building for production using webpack.
 rpellerin
on 2 May 2018
rpellerin
on 2 May 2018
We need minimum reproducible repo, without this it makes no sense to write about the fact that you have a problem. Thanks!
alexander-akait
on 2 May 2018
Good point, sorry for not providing a repo, it's private (work-related). Configuration is hardly reproducible.
A few pointers:
- We use
uglifyjs-webpack-plugin - We use the latest versions of
webpackandwebpack-cli - We use
CompressionPlugin - We have a lot of
.scssfiles
rpellerin
on 2 May 2018
Got the same issue when developing with hot reload.
 abruzzihraig
on 3 May 2018
abruzzihraig
on 3 May 2018
Guys please read https://github.com/webpack/webpack/issues/6929#issuecomment-386020396 again, we can't solve this problem because in pure usage webpack no problems, i.e. problem with memory leak in some loader/plugin, please create minimum reproducible test repo if you want to solve problem fastly. Thanks!
alexander-akait
on 3 May 2018
Ok, here is a minimal test case for the leak that I am experiencing.
I extracted the example from a much larger project that I am working on. The problem here seems caused by a third-party plugin, DojoWebpackPlugin, but in some snapshot I recall seeing other plugins that were causing the issue.
It appears that webpack is keeping Compilation instances around, probably because of how tapable hooks are used. I don't know the webpack source code well enough to proceed further in the investigation. See my example README for details.
 lorenzodallavecchia
on 3 May 2018
lorenzodallavecchia
on 3 May 2018
@lorenzodallavecchia Thanks!
alexander-akait
on 3 May 2018
I found the leak in Karma by using the Chrome dev tools and I'd recommend others to do the same. Starting node with --inspect-brk to debug the running process and run memory profiling. I doubt any of these issues are Webpack related, almost certainly they are in Loaders/Plugins or the usage of such.
briandipalma
on 3 May 2018
@briandipalma if you found memory leak please create issue in loader/plugins repo. We very much appreciate this issue and fix their very fast (try to fix asap :smile: ).
alexander-akait
on 3 May 2018
I was talking about the leak in this comment https://github.com/webpack/webpack/issues/6929#issuecomment-383591954 I'd suggest people use the Chrome tooling to trace down the leaks themselves it's doable with some patience.
briandipalma
on 3 May 2018
hi...maybe there are some conflicts between webpack's cache and other webpack plugin/loader's cache
In webpack4 config file, i set 'cache':true and comment cache-loader and cache option of the babel-loader,then the node don't crash.
So try it.
zD98
on 8 May 2018
I did some more investigation on my leak involving dojo-webpack-plugin (see the updated test case) and I found the root cause of the leak.
Long story short: it is probably not webpack's fault.
The gist of what dojo-webpack-plugin is doing is the following.
compiler.hooks.compilation.tap("test", compilation => {
  const context = Object.create(this, {
    compilation: { value: compilation },
  });
  let fn = (function() {
    console.log("Making compilation");
  }).bind(context);
  compiler.hooks.make.tap("test", fn);
});
As you can see, it is registering a Compiler hook that internally holds a reference to each Compilation object. This leaks all compilations via the tapable hook.
I also tried the equivalent webpack 3 code and it leaks the same.
I will be reporting this to the plugin author since I guess this is not something a plugin should do, isn't it?
lorenzodallavecchia
on 14 May 2018
i got this too.maybe the GC is suck.
i got this after a while when developing my project
 aqualaguna
on 22 May 2018
aqualaguna
on 22 May 2018
"webpack": "^3.6.0" The same existence
 luo772435545
on 1 Jun 2018
luo772435545
on 1 Jun 2018
I also meet with this problem.I'm not sure whether it relate to 'vue-loader'.Because it works normally without 'vue-loader' in one of my project.
 KyLeoHC
on 6 Jun 2018
KyLeoHC
on 6 Jun 2018
@KyLeoHC Same here, vue-loader@15 requires a new vue loader plugin. Not sure if it is the issue.
 AnonymousArthur
on 15 Jun 2018
AnonymousArthur
on 15 Jun 2018
I got this almost everyday. I didn't use vue.
CarterLi
on 15 Jun 2018
Same problem here. It seems that it happens after I upgraded webpack to 4.X
<--- Last few GCs --->

[89206:0x104802a00]  1393539 ms: Scavenge 1382.9 (1412.5) -> 1382.4 (1412.5) MB, 2.0 / 0.0 ms  (average mu = 0.059, current mu = 0.010) alloca
tion failure
[89206:0x104802a00]  1393596 ms: Scavenge 1383.4 (1412.5) -> 1382.9 (1412.5) MB, 3.2 / 0.0 ms  (average mu = 0.059, current mu = 0.010) alloca
tion failure
[89206:0x104802a00]  1393631 ms: Scavenge 1384.0 (1412.5) -> 1383.4 (1413.0) MB, 3.8 / 0.0 ms  (average mu = 0.059, current mu = 0.010) alloca
tion failure


<--- JS stacktrace --->

==== JS stack trace =========================================

    0: ExitFrame [pc: 0x35132d7841bd]
    1: StubFrame [pc: 0x35132d7962e8]
    2: StubFrame [pc: 0x35132d7bb659]
Security context: 0x2afd3a89e589 <JSObject>
    3: /* anonymous */(aka /* anonymous */) [0x2afd26ece2f9] [/Users/elviskang/projects/test/node_modules/[email protected]@webpack/lib/Stats.js:~
545] [pc=0x35132eddfe7d](this=0x2afddb6022e1 <undefined>,a=0x2afd06adfdd1 <Object map = 0x2afdda341399>,b=0x2afd06adfe49 <Object map = 0x2afdd
...

FATAL ERROR: Ineffective mark-compacts near heap limit Allocation failed - JavaScript heap out of memory
 1: node::Abort() [/usr/local/bin/node]
 2: node::OnFatalError(char const*, char const*) [/usr/local/bin/node]
 3: v8::Utils::ReportOOMFailure(v8::internal::Isolate*, char const*, bool) [/usr/local/bin/node]
 4: v8::internal::V8::FatalProcessOutOfMemory(v8::internal::Isolate*, char const*, bool) [/usr/local/bin/node]
 5: v8::internal::Heap::UpdateSurvivalStatistics(int) [/usr/local/bin/node]
 6: v8::internal::Heap::CheckIneffectiveMarkCompact(unsigned long, double) [/usr/local/bin/node]
 7: v8::internal::Heap::PerformGarbageCollection(v8::internal::GarbageCollector, v8::GCCallbackFlags) [/usr/local/bin/node]
 8: v8::internal::Heap::CollectGarbage(v8::internal::AllocationSpace, v8::internal::GarbageCollectionReason, v8::GCCallbackFlags) [/usr/local/
bin/node]
 9: v8::internal::Heap::AllocateRawWithRetry(int, v8::internal::AllocationSpace, v8::internal::AllocationAlignment) [/usr/local/bin/node]
10: v8::internal::Factory::NewHeapNumber(v8::internal::MutableMode, v8::internal::PretenureFlag) [/usr/local/bin/node]
11: v8::internal::Factory::NewNumber(double, v8::internal::PretenureFlag) [/usr/local/bin/node]
12: v8::internal::String::ToNumber(v8::internal::Handle<v8::internal::String>) [/usr/local/bin/node]
13: v8::internal::Runtime_StringToNumber(int, v8::internal::Object**, v8::internal::Isolate*) [/usr/local/bin/node]
14: 0x35132d7841bd
15: 0x35132d7962e8
 ElvisKang
on 21 Jun 2018
ElvisKang
on 21 Jun 2018
I've been getting this error a lot as well, happens mostly after quick css adjustments + saves.
From a vue-cli v3 project which uses webpack 4:

 hymair
on 25 Jun 2018
hymair
on 25 Jun 2018
Same here + many of my coworkers. Seems to primarily happen when recompiling a lot of files, e.g. switching branches, and gradually over time. Sounds like old compiled resources aren't getting freed up.
4GB allocated OOM's quickly, while with 5G, the extra gig gets completely used up over a short period of time.
 SEAPUNK
on 26 Jun 2018
SEAPUNK
on 26 Jun 2018
Inspecting it in Chrome DevTools memory profiler, it does seem like it cleans up the memory of the previous recompilation (leaving ~500KB behind), although the process itself still uses up +15MB each time it recompiles a 2KB file.
Maybe this is happening at the native module scope? File watcher, maybe? It's happening on all operating systems, though.
Looking at one of the 3 big memory allocations, at the end it does seem like it calls Watching.js watch() a few thousand times...
SEAPUNK
on 26 Jun 2018
I can confirm this issue too. Using vue-cli v3 which uses webpack v4 internally.
 ayZagen
on 27 Jun 2018
ayZagen
on 27 Jun 2018
This issue seems to be present while developing with hot-reload. If I look at http://localhost:3000/webpack-dev-server, it keeps adding hot reload files to the memory and does not cleanup the old ones. After several hot reloads result is "out of memory".
 g86
on 28 Jun 2018
g86
on 28 Jun 2018
Everyone concerned by this issue, are you using sass-loader ?
NB: Does your memory magically stop growing if you stop using sass-loader ?
 Sinewyk
on 3 Jul 2018
Sinewyk
on 3 Jul 2018
@Sinewyk I think so. It is most common stylesheet language. At least i use it.
ayZagen
on 3 Jul 2018
@Sinewyk, I am not using sass-loader.
colinrobertbrooks
on 3 Jul 2018
@Sinewyk we're using only postcss and postcss-next and have this problem at least twice a day
 sabarasaba
on 3 Jul 2018
sabarasaba
on 3 Jul 2018
I think sass-loader may be one of the culprits at least.
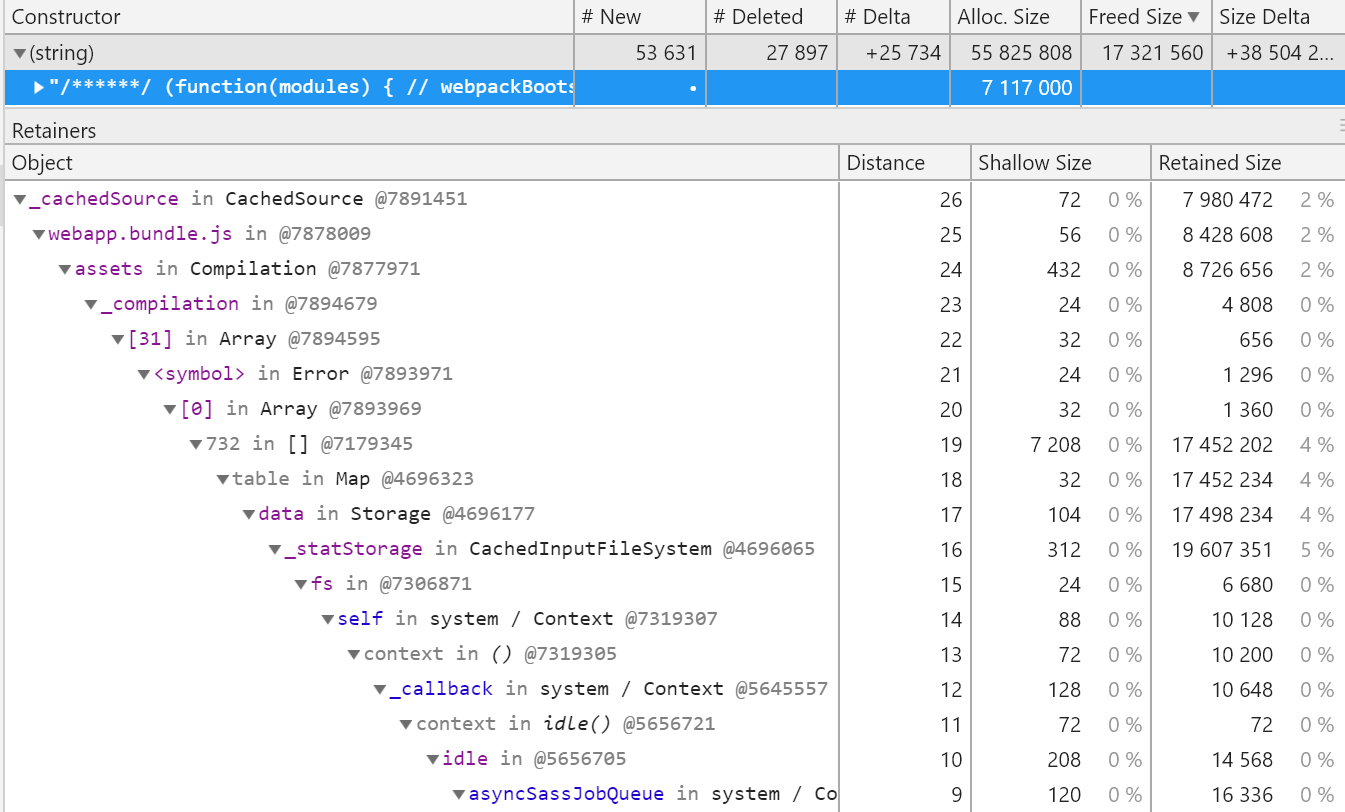
The asyncSassJobQueue is global and keeps a reference of the loader context which is never garbage collected apparently.
There may be something to do with the drain event of async#queue to delete the reference sometimes and start again fresh.
I'm disabling sass-loader and trying to find another leak.
NB: sass-loader clearly violates the "stateless" of the writing loader guide https://webpack.js.org/contribute/writing-a-loader/#stateless
Sinewyk
on 3 Jul 2018
I have something that is more of an investigation than a fix. I'm trying to wrap my head around Webpack's inner working, and I noticed that webpack keeps assets around in memory after they're written to disk. I couldn't find super obvious places where they were used again afterwards, so I ended up writing a dumb plugin to clear out assets after a compilation had emitted them to disk. I optionally used a Proxy to yell loudly if there's an attempt to access an asset after we've deleted them. This is only useful for things that keep a compiler around in memory (i.e. with watch mode enabled, or multi-compiler mode).
The plugin is essentially this:
const throwOnAssetAccess = true;

apply(compiler) {
    const plugin = { name: "ClearAssetsPlugin" };
    compiler.hooks.afterEmit.tap(plugin, compilation => {
        if (throwOnAssetAccess) {
            compilation.assets = new Proxy([], {
                get: function(target, prop) {
                    throw new Error(
                        "I deleted all your assets and you tries to access one of them."
                    );
                },
            });
        } else {
            // This seems to be enough for the garbage collector to clean up unused assets.
            compilation.assets = [];
        }
    });
}
I'm not sure what we're losing by removing these assets from memory, but things generally still seem to build without any loud failure. Again, this plugin is super dumb, and it feels like it's mostly just exposing my lack of understanding about webpack.
 salemhilal
on 3 Jul 2018
salemhilal
on 3 Jul 2018
I think the problem is not exactly the assets, but the Compilation objects. AFAICT the idea of Compilation is that they should be needed only during a build/rebuild and disposed of shortly after.
In my case, multiple Compilation objects were being kept around, each one with its assets and everything else. The culprit was a custom plugin that was leaking compilations by registering hooks on compiler that internally kept a reference to the compilation.
The following is the essence of the problematic pattern.
compiler.hooks.compilation.tap("test", compilation => {
  compiler.hooks.make.tap("test", () => {
    // use compilation in some way
  });
});
Both hook functions are registered on the compiler object, but the inner one also has a closed reference to compilation. In this way, the short-lived compilation is retained in memory by the compiler object, which has the same lifetime of the Webpack watch-mode execution.
I do not really understand why the above pattern has emerged or become problematic only with version 4.
About fixing that, webpack may provide some kind of guard for cases where hooks to compiler are added while handling an hook that provides access to the compilation and warn the plugin developer in some way.
lorenzodallavecchia
on 4 Jul 2018
@evilebottnawi as soon as we opt in into code splitting, we may have a memory leak.
I finally have a small project that launches webpack watch and a "scrambler" (something that edits your entry points for you automatically) side by side => https://github.com/Sinewyk/webpack_leak_6929
By editing the node --max_old_space_size=X parameter in the package.json from 50 to 75 we get a OOM in ~15 to ~60 seconds.
Install and yarn test and you may use something like GENERATE_HEAP_DUMP=true HEAPDUMP_INTERVAL=5000 yarn test to see in action the memory leak of the code splitting.
Finally I understand why I saw tons of SyncBailHook and stuff in the previous dumps, it's how all the various Chunks Optimization are registered apparently. And it leaks the compilation objects between runs.
Sinewyk
on 4 Jul 2018
AFAICT the idea of Compilation is that they should be needed only during a build/rebuild and disposed of shortly after.
Good catch; that definition seems to match up with the docs as well. I wouldn't be surprised if I saw this sort of leak in one of my plugins. I'll do some digging tomorrow.
salemhilal
on 4 Jul 2018
I'll take a look...
 sokra
on 5 Jul 2018
sokra
on 5 Jul 2018
@Sinewyk thanks for your repro.
sokra
on 5 Jul 2018
I found two leaks, both fixed in the PR referenced above.
There is still one known leak, but I can't do much about it. The in-memory filesystem piles up files when they contain a hash, i. e. 656cd54965df5bcf669a.hot-update.json...
sokra
on 5 Jul 2018
@sokra
Just tried 4.15.1 for vue-cli and still seeing memory leaks.
Why the old hot-update JSON need to hold up memory after they are broadcasted?
Also I don't think it's only the hot-update JSON, because what I observe is:
- Open a
vue-cliproject and run webpack in dev mode - Delete one char in a random file, hit save
- Memory usage of webpack process goes up ~30MB
- I edit and save many times during development, and the used memory never get reclaimed. Eventually leading to OOM error
Don't think the hot-updates alone can be 30MB. There's probably leak in the compilation targets.
I'm wondering if others can confirm if 4.15.1 solves the problem. Maybe the issue is in vue-loader.
But please keep this issue open as this is not resolved yet.
 octref
on 5 Jul 2018
octref
on 5 Jul 2018
@octref I've seen a few places in the codebase where it seems like webpack retains references to the previous build until another build is kicked off. For example, see compilerStats here — the MultiCompiler class keeps a reference to stats objects, even after compilations have finished. It replaces them as they're rebuilt: https://github.com/webpack/webpack/blob/8e6a012dbbb1526db1da753b61c43e8c61b3379f/lib/MultiCompiler.js#L31
If you build again, does memory continue to increase?
salemhilal
on 5 Jul 2018
@salemhilal
If you build again, does memory continue to increase?
I believe vue-cli is running webpack --watch under the hood, so each time I do a filesave it kicks off another incremental build and the memory usage increases.
webpack retains references to the previous build until another build is kicked off
I'm not familiar with webpack code base, but the cause might be that incremental build is not cleaning up no-longer-used compilation metadata / build targets.
octref
on 5 Jul 2018
@octref sorry, should have clarified: if you try to edit the same file over and over again, does the memory footprint keep increasing as webpack keeps rebuilding? I think there are a lot of places where webpack might need to clean up after itself, but as long as it's not ballooning in size as it builds a consistently-sized input, it may not be as critical an issue.
salemhilal
on 5 Jul 2018
if you try to edit the same file over and over again, does the memory footprint keep increasing as webpack keeps rebuilding?
If I keep editing a single file and do a save after edit, webpack increases memory by ~30MB.
The project is https://github.com/Microsoft/language-server-protocol-inspector if you are interested.
I'm linking to a dev version of vue-cli that's using webpack 4.15.1:

Here is a gif. As you see, all I'm doing is
- Delete a line
- Save
- Watch webpack memory usage increase by 10-30MB
- Bring that line back
- Watch webpack memory usage increase by another 10-30MB

octref
on 5 Jul 2018
@octref That's definitely some sort of memory leak. There are a lot of things that could be causing it though; it's very easy for plugins to introduce memory leaks (there's a good example in a previous comment). I think you'd need to reproduce your leak using a minimal webpack configuration (like in this comment above), or else open an issue on vue-cli's github repository.
salemhilal
on 6 Jul 2018
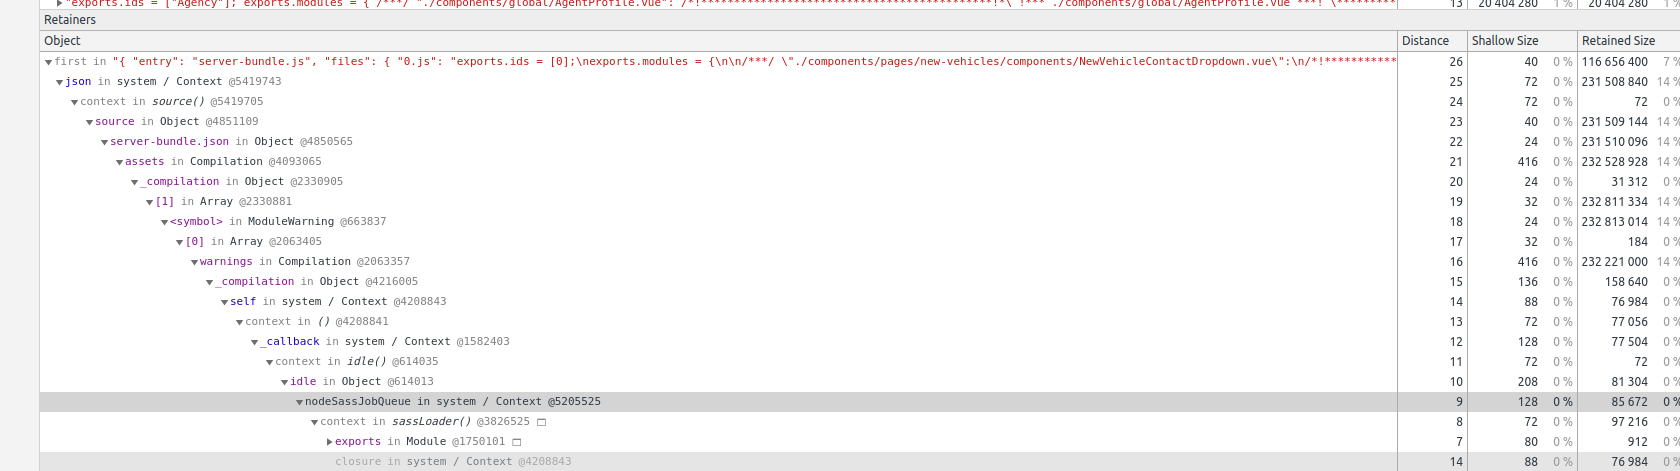
Ok this leak is a tricky one. Here is what happens:
From the devtools (when using the memory profiler you can see leaked Compilation objects. They are held by this chain:

Some module.exports has a webpack property holding the Compilation object. The webpack property is this one:

It's added to the postcss context.
The context should be temporal, but it's actually Object.assigned to the object returned by cosmiconfig:

cosmiconfig returns the module.exports for the .postcssrc.js file. But why is this Module still hold.
cosmiconfig uses require-to-string which does the following to load the file:

This doesn't add the module to the require.cache, but it still adding the module as child to the parent module. That's the leak.
Some things could have done better higher in the chain, but they are not the root cause.
- webpack could remove the
Compilationreference from the loader context once the loader finish compiling. This would decrease the amount of leaked memory a lot. postcss-load-configcould assign the context to a new object likeassign({}, config, ctx)instead of modifying the object. This would decrease the amount of leaked memory.
How to fix it?
It's actually already fixed in require-to-string version 2 via this commit:

https://github.com/floatdrop/require-from-string/commit/ca2b81f56cc6d5480a25ca8b2be5887de2dfb53c
So cosmiconfig can update it's dependency, which it already has in version 3 via this commit:
https://github.com/davidtheclark/cosmiconfig/commit/3846b1186376c1133e00ffb576434d05d8eb6a01
They actually stating that this fixes a memory leak in require-to-string.
So postcss-load-config has to update its cosmiconfig dependency. cc @michael-ciniawsky
Note that cosmiconfig is already at version 5, but this seem to be unusable because of this bug: https://github.com/davidtheclark/cosmiconfig/issues/148. This would break watching the config file.
They are proposing to use https://github.com/sindresorhus/clear-module but this package has the same memory leak bug as require-to-string had. cc @sindresorhus
So my proposal is to update cosmiconfig only to ^3.1.0.
Here is a little guide how to find memory leaks in webpack.
- node.js version 10 is needed.
- Attach the debugger/devtools. You could use
process._debugProcessto attach to a running node process. - Change the file a couple of times to everything is in the cache.
- Take a Heap snapshot. (1)
- Change the file two times, back to the prev state.
- Take a Heap snapshot. (2)
- Change the file two times, back to the prev state.
- Take a Heap snapshot. (3)
- In the devtools select snapshot 3.
- Choose
Objects allocated between Snapshot 1 and Snapshot 2 - Filter for
Compilation - Open
Compilationgroup. - Select one of the
Compilationobjects - Take a look at the
Retainerlist. It's automatically expanded in the correct way.

sokra
on 9 Jul 2018
submitted this PR: https://github.com/michael-ciniawsky/postcss-load-config/pull/151
 mikesherov
on 9 Jul 2018
mikesherov
on 9 Jul 2018
@mikesherov seems that it got merged with https://github.com/michael-ciniawsky/postcss-load-config/pull/152 and postcss-loader got updated to use the new version of the package too https://github.com/postcss/postcss-loader/commit/928d5c41d5e2bdec130b3c0899760889466ae7bd
sabarasaba
on 10 Jul 2018
Ok I'll check it again. It's difficult to find multiple memory leaks at once, they often hide behind each other...
sokra
on 10 Jul 2018
postcss-load-config is not published yet.
sokra
on 10 Jul 2018
postcss-loader v2.1.6 🎉
rm -rf [package-lock.json] node_modules && npm cache clean -f && npm i
 michael-ciniawsky
on 10 Jul 2018
michael-ciniawsky
on 10 Jul 2018
@sokra @michael-ciniawsky Thanks again. I believe the leak has been fixed.
octref
on 12 Jul 2018
Note that cosmiconfig is already at version 5, but this seem to be unusable because of this bug: davidtheclark/cosmiconfig#148. This would break watching the config file.
My impression is that that issue turned out not to really be a bug and certainly doesn't make cosmiconfig v5 unusable. Please let me know if you think there is in fact a problem that we're missing!
 davidtheclark
on 20 Jul 2018
davidtheclark
on 20 Jul 2018
I've tried what @michael-ciniawsky suggested but still getting the error.
Seems like it's happening at the same place as ElvisKang's case
Anybody still having this?
<--- Last few GCs --->

[69494:0x103000000]  3012592 ms: Mark-sweep 1392.2 (1446.2) -> 1392.1 (1446.2) MB, 338.9 / 0.0 ms  allocation failure GC in old space requested
[69494:0x103000000]  3012896 ms: Mark-sweep 1392.1 (1446.2) -> 1392.1 (1415.2) MB, 303.1 / 0.0 ms  last resort GC in old space requested
[69494:0x103000000]  3013227 ms: Mark-sweep 1392.1 (1415.2) -> 1392.1 (1415.2) MB, 330.9 / 0.0 ms  last resort GC in old space requested


<--- JS stacktrace --->

==== JS stack trace =========================================

Security context: 0x1552f98a55e9 <JSObject>
    1: /* anonymous */(aka /* anonymous */) [<HOME_DIR>/<PROJECT_ROOT>/node_modules/webpack/lib/Stats.js:~544] [pc=0xbcb6ffd5750](this=0x1552a82822d1 <undefined>,reason=0x155294bf5431 <ModuleReason map = 0x155242b8eb19>)
    2: arguments adaptor frame: 3->1
    3: map(this=0x155266219dd1 <JSArray[1688]>)
    4: fnModule(aka fnModule) [<HOME_DIR>/<PROJECT_ROOT>/node_modu...

FATAL ERROR: CALL_AND_RETRY_LAST Allocation failed - JavaScript heap out of memory
 1: node::Abort() [<HOME_DIR>/.nvm/versions/node/v9.11.2/bin/node]
 2: node::FatalTryCatch::~FatalTryCatch() [<HOME_DIR>/.nvm/versions/node/v9.11.2/bin/node]
 3: v8::internal::V8::FatalProcessOutOfMemory(char const*, bool) [<HOME_DIR>/.nvm/versions/node/v9.11.2/bin/node]
 4: v8::internal::Factory::NewCodeRaw(int, bool) [<HOME_DIR>/.nvm/versions/node/v9.11.2/bin/node]
 5: v8::internal::Factory::NewCode(v8::internal::CodeDesc const&, unsigned int, v8::internal::Handle<v8::internal::Object>, bool, int) [<HOME_DIR>/.nvm/versions/node/v9.11.2/bin/node]
 6: v8::internal::CodeGenerator::MakeCodeEpilogue(v8::internal::TurboAssembler*, v8::internal::EhFrameWriter*, v8::internal::CompilationInfo*, v8::internal::Handle<v8::internal::Object>) [<HOME_DIR>/.nvm/versions/node/v9.11.2/bin/node]
 7: v8::internal::compiler::CodeGenerator::FinalizeCode() [<HOME_DIR>/.nvm/versions/node/v9.11.2/bin/node]
 8: v8::internal::compiler::PipelineImpl::FinalizeCode() [<HOME_DIR>/.nvm/versions/node/v9.11.2/bin/node]
 9: v8::internal::compiler::PipelineCompilationJob::FinalizeJobImpl() [<HOME_DIR>/.nvm/versions/node/v9.11.2/bin/node]
10: v8::internal::Compiler::FinalizeCompilationJob(v8::internal::CompilationJob*) [<HOME_DIR>/.nvm/versions/node/v9.11.2/bin/node]
11: v8::internal::OptimizingCompileDispatcher::InstallOptimizedFunctions() [<HOME_DIR>/.nvm/versions/node/v9.11.2/bin/node]
12: v8::internal::StackGuard::HandleInterrupts() [<HOME_DIR>/.nvm/versions/node/v9.11.2/bin/node]
13: v8::internal::Runtime_StackGuard(int, v8::internal::Object**, v8::internal::Isolate*) [<HOME_DIR>/.nvm/versions/node/v9.11.2/bin/node]
14: 0xbcb6da842fd
error Command failed with signal "SIGABRT".
 Liooo
on 24 Jul 2018
Liooo
on 24 Jul 2018
i am still having this issue!
 sicksid
on 27 Jul 2018
sicksid
on 27 Jul 2018
I'm still having it:
Child html-webpack-plugin for "index.html":
                                   Asset      Size  Chunks             Chunk Names
    8e6f315e4eb78a143148.hot-update.json  44 bytes          [emitted]
     + 1 hidden asset
    Entrypoint undefined = index.html
       4 modules
Child html-webpack-plugin for "site.html":
                                   Asset      Size  Chunks             Chunk Names
    d0790d6e9c7bc11d778f.hot-update.json  44 bytes          [emitted]
     + 1 hidden asset
    Entrypoint undefined = site.html
       4 modules
ℹ 「wdm」: Compiled successfully.
ℹ 「wdm」: Compiling...

<--- Last few GCs --->

[37612:0x105000600] 119874194 ms: Mark-sweep 4973.5 (5011.1) -> 4973.5 (5012.1) MB, 212.1 / 0.0 ms  (average mu = 0.133, current mu = 0.012) allocation failure scavenge might not succeed
[37612:0x105000600] 119874417 ms: Mark-sweep 4974.1 (5012.1) -> 4974.0 (5012.6) MB, 218.9 / 0.0 ms  (average mu = 0.078, current mu = 0.019) allocation failure GC in old space requested


<--- JS stacktrace --->

==== JS stack trace =========================================

    0: ExitFrame [pc: 0x206144e841bd]
Security context: 0x9c22329e6c9 <JSObject>
    1: update [0x9c2bd62b059] [internal/crypto/hash.js:62] [bytecode=0x9c2c59c6511 offset=106](this=0x9c27b57e719 <Hash map = 0x9c2fdb65201>,data=0x9c27b57e6b1 <Very long string[13223596]>,encoding=0x9c2e95022e1 <undefined>)
    2: update [0x9c25c32cbe9] [/Users/sontek/code/eventray/src/eventray/node_modules/webpack/lib/util/createHash.js:35] [bytecode=0x9c22...

FATAL ERROR: Ineffective mark-compacts near heap limit Allocation failed - JavaScript heap out of memory
 1: 0x1000334aa node::Abort() [/usr/local/Cellar/node/10.5.0_1/bin/node]
 2: 0x100034c4b node::OnFatalError(char const*, char const*) [/usr/local/Cellar/node/10.5.0_1/bin/node]
 3: 0x100179503 v8::Utils::ReportOOMFailure(v8::internal::Isolate*, char const*, bool) [/usr/local/Cellar/node/10.5.0_1/bin/node]
 4: 0x1001794a5 v8::internal::V8::FatalProcessOutOfMemory(v8::internal::Isolate*, char const*, bool) [/usr/local/Cellar/node/10.5.0_1/bin/node]
 5: 0x10045668a v8::internal::Heap::UpdateSurvivalStatistics(int) [/usr/local/Cellar/node/10.5.0_1/bin/node]
 6: 0x100458273 v8::internal::Heap::CheckIneffectiveMarkCompact(unsigned long, double) [/usr/local/Cellar/node/10.5.0_1/bin/node]
 7: 0x100455866 v8::internal::Heap::PerformGarbageCollection(v8::internal::GarbageCollector, v8::GCCallbackFlags) [/usr/local/Cellar/node/10.5.0_1/bin/node]
 8: 0x100454610 v8::internal::Heap::CollectGarbage(v8::internal::AllocationSpace, v8::internal::GarbageCollectionReason, v8::GCCallbackFlags) [/usr/local/Cellar/node/10.5.0_1/bin/node]
 9: 0x10045cac2 v8::internal::Heap::AllocateRawWithRetry(int, v8::internal::AllocationSpace, v8::internal::AllocationAlignment) [/usr/local/Cellar/node/10.5.0_1/bin/node]
10: 0x10043c42e v8::internal::Factory::NewRawTwoByteString(int, v8::internal::PretenureFlag) [/usr/local/Cellar/node/10.5.0_1/bin/node]
11: 0x10051e13c v8::internal::String::SlowFlatten(v8::internal::Handle<v8::internal::ConsString>, v8::internal::PretenureFlag) [/usr/local/Cellar/node/10.5.0_1/bin/node]
12: 0x10018ecf3 v8::String::WriteUtf8(char*, int, int*, int) const [/usr/local/Cellar/node/10.5.0_1/bin/node]
13: 0x1000ac515 node::StringBytes::Write(v8::Isolate*, char*, unsigned long, v8::Local<v8::Value>, node::encoding, int*) [/usr/local/Cellar/node/10.5.0_1/bin/node]
14: 0x1000f18ed node::StringBytes::InlineDecoder::Decode(node::Environment*, v8::Local<v8::String>, v8::Local<v8::Value>, node::encoding) [/usr/local/Cellar/node/10.5.0_1/bin/node]
15: 0x1000f2905 node::crypto::Hash::HashUpdate(v8::FunctionCallbackInfo<v8::Value> const&) [/usr/local/Cellar/node/10.5.0_1/bin/node]
16: 0x1001e53ee v8::internal::FunctionCallbackArguments::Call(v8::internal::CallHandlerInfo*) [/usr/local/Cellar/node/10.5.0_1/bin/node]
17: 0x1001e4a84 v8::internal::MaybeHandle<v8::internal::Object> v8::internal::(anonymous namespace)::HandleApiCallHelper<false>(v8::internal::Isolate*, v8::internal::Handle<v8::internal::HeapObject>, v8::internal::Handle<v8::internal::HeapObject>, v8::internal::Handle<v8::internal::FunctionTemplateInfo>, v8::internal::Handle<v8::internal::Object>, v8::internal::BuiltinArguments) [/usr/local/Cellar/node/10.5.0_1/bin/node]
18: 0x1001e41a5 v8::internal::Builtin_Impl_HandleApiCall(v8::internal::BuiltinArguments, v8::internal::Isolate*) [/usr/local/Cellar/node/10.5.0_1/bin/node]
19: 0x206144e841bd
error Command failed with signal "SIGABRT".
 sontek
on 7 Aug 2018
sontek
on 7 Aug 2018
I'm finding a combination of hot reload with devtool: 'source-map' causes a memory leak that takes down webpack after a handful of code changes.
 fracmak
on 8 Aug 2018
fracmak
on 8 Aug 2018
I'm currently using --max_old_space_size=5000 to give me a couple more saves than I get with the default setting of 1gb. I don't have enough memory to give webpack more than that
sontek
on 8 Aug 2018
@fracmak please create new issue with reproducible test repo
alexander-akait
on 8 Aug 2018
I happens quite often if you include a large library such as Microsoft's monaco-editor.
 blaky
on 14 Aug 2018
blaky
on 14 Aug 2018
worker-loader cause node memory leak
`<--- Last few GCs --->
[2054:0x39e56e0] 54189 ms: Mark-sweep 1373.9 (1460.8) -> 1373.9 (1476.8) MB, 797.7 / 0.0 ms allocation failure GC in old space requested
[2054:0x39e56e0] 55136 ms: Mark-sweep 1373.9 (1476.8) -> 1373.9 (1445.8) MB, 946.1 / 0.0 ms last resort GC in old space requested
[2054:0x39e56e0] 55963 ms: Mark-sweep 1373.9 (1445.8) -> 1373.9 (1445.8) MB, 827.1 / 0.0 ms last resort GC in old space requested
<--- JS stacktrace --->`
 AngusLang
on 23 Aug 2018
AngusLang
on 23 Aug 2018
I made a very small repo that has this memory leak when using react-hot-loader
 sibelius
on 30 Aug 2018
sibelius
on 30 Aug 2018
added snapshot to debug here https://github.com/sibelius/webpack-debug/issues/1
sibelius
on 30 Aug 2018
@sontek can you create minimum reproducible test repo?
alexander-akait
on 30 Aug 2018
@evilebottnawi I'm not sure where to start on creating a minimal reproducible step. All I changed to get the memory link was upgrading to v4. This project was started on v1 and we've migrated as time went on and we've never had issues with memory until now.
I think the only way to easily reproduce minimally is to start a project from scratch and keep adding things until it breaks
sontek
on 30 Aug 2018
I am using react-hot-loader though, so the example from @sibelius might be relevant
sontek
on 30 Aug 2018
I confirm that "devtool: 'source-map' " forces huge memory leak. But it is not the only problem: "devtool: 'none' " helps, but memory still leaks slowly.
 Acionyx
on 30 Aug 2018
Acionyx
on 30 Aug 2018
I made a very small repo that has this memory leak when using react-hot-loader
Ok I investigated into these repro. I made me a bit angry at first because it hook half an hour to npm install it, because the package.json contains many unnecessary dependencies... 😠
I figured:
- The devtools leak memory when attached: https://bugs.chromium.org/p/chromium/issues/detail?id=852746. This is pretty big.
- webpack-dev-server leaks memory when HMR is enabled (already known). Assets are written into the memory filesystem and stay there...
sokra
on 3 Sep 2018
webpack-dev-server leaks memory when HMR is enabled (already known). Assets are written into the memory filesystem and stay there...
Is there a way to prevent or at least mitigate this e.g use [path].hot-update.json (e.g this.resourcePath) instead of [hash].hot-update.json (or another LRU pattern, if possible) to prevent stacking them up over time and leak memory when the server is running for a while? Any issues where I can read more about this in general?
michael-ciniawsky
on 3 Sep 2018
sorry about all the dependencies, it was to reproduce a real project, you can use yarn to install faster.
we have an issue for the leak on webpack-dev-server?
does it leak on webpack-serve as well?
sibelius
on 3 Sep 2018
Anyone figure out a way to avoid this yet?
sontek
on 4 Oct 2018
In my case i tracked it down to stylelint-config-sass-guidelines, but found no other solution than to exclude it :D
 DotCoyote
on 4 Oct 2018
DotCoyote
on 4 Oct 2018
still having this memory leak issue after upgrading from v3.6.0 to v4.23.1
 FranckFreiburger
on 28 Oct 2018
FranckFreiburger
on 28 Oct 2018
One workaround is to increase node's memory allocation. You can do this by setting the node flag --max_old_space_size when calling node, or setting the default node flags environment variable:
export NODE_OPTIONS="--max_old_space_size=4096"
 KurtPreston
on 29 Oct 2018
KurtPreston
on 29 Oct 2018
If anyone is on old babel plugins, you can try upgrading that. I was on babel6 and all the plugins that work with that. After upgrading EVERYTHING (It was too much to try to pinpoint) or memory leaks went away
sontek
on 29 Oct 2018
the problem is not with webpack-dev-server
we used to use another plugin to do the same as webpack-dev-server on this repo https://github.com/sibelius/webpack-debug, and the crash still happened when doing hmr
can we create a custom hmr strategy, and avoid the current one used by webpack?
sibelius
on 2 Nov 2018
@KurtPreston work here, but... its just a workaround, thnks ;)
 rflmyk
on 19 Nov 2018
rflmyk
on 19 Nov 2018
I get same error .it is loader-fs-cache throw error. It's work when I remove large file from entry. may be can help you.
 hxfdarling
on 22 Nov 2018
hxfdarling
on 22 Nov 2018
@sokra
based on this:
webpack-dev-server leaks memory when HMR is enabled (already known). Assets are written into the memory filesystem and stay there...
Can you tell webpack-dev-server or webpack to cache the assets on disk instead of memory?
why can't we remove the assets after the HMR is applied?
sibelius
on 22 Nov 2018
Completing what sibelius said, we had tested this with a different spectrum of servers and, with many modules, the leak persists, even with dev servers that does not write assets to memory-fs, the leak persist and webpack crashes.
 PlayMa256
on 22 Nov 2018
PlayMa256
on 22 Nov 2018
I agree with @PlayMa256 , the memory-fs memory usage is growing much less than the process memory.
FranckFreiburger
on 22 Nov 2018
webpack 4.26.0
node 11.0.0
After dozens of hours of continuous work it crash with this error:
Child html-webpack-plugin for "index.html":
     1 asset
    Entrypoint undefined = index.html
       4 modules
 95% emitting HtmlWebpackPlugin
<--- Last few GCs --->

[65188:0x103800000] 38818979 ms: Mark-sweep 1385.2 (1411.5) -> 1385.2 (1412.0) MB, 536.8 / 0.0 ms  (average mu = 0.124, current mu = 0.010) allocation failure GC in old space requested
[65188:0x103800000] 38819308 ms: Mark-sweep 1385.2 (1412.0) -> 1385.2 (1412.0) MB, 328.8 / 0.0 ms  (average mu = 0.080, current mu = 0.000) allocation failure GC in old space requested


<--- JS stacktrace --->

==== JS stack trace =========================================

    0: ExitFrame [pc: 0xfefa48cfb7d]
    1: ConstructFrame [pc: 0xfefa4889e66]
    2: StubFrame [pc: 0xfefa5724e60]
Security context: 0x32074a41d969 <JSObject>
    3: new Script(aka Script) [0x320794a827d1] [vm.js:80] [bytecode=0x3207ed2ba891 offset=375](this=0x3207a5982691 <the_hole>,0x3207b5482309 <Very long string[565045]>,0x3207b54ac9a9 <Object map = 0x3207613d46e1>)
    4: ConstructFrame [pc: 0xfefa4889d53]
    5: StubFrame [pc: 0xfe...

FATAL ERROR: Ineffective mark-compacts near heap limit Allocation failed - JavaScript heap out of memory
 1: 0x10003a9d9 node::Abort() [/usr/local/bin/node]
 2: 0x10003abe4 node::FatalTryCatch::~FatalTryCatch() [/usr/local/bin/node]
 3: 0x10019ed17 v8::Utils::ReportOOMFailure(v8::internal::Isolate*, char const*, bool) [/usr/local/bin/node]
 4: 0x10019ecb4 v8::internal::V8::FatalProcessOutOfMemory(v8::internal::Isolate*, char const*, bool) [/usr/local/bin/node]
 5: 0x1005a5882 v8::internal::Heap::FatalProcessOutOfMemory(char const*) [/usr/local/bin/node]
 6: 0x1005a4838 v8::internal::Heap::PerformGarbageCollection(v8::internal::GarbageCollector, v8::GCCallbackFlags) [/usr/local/bin/node]
 7: 0x1005a2443 v8::internal::Heap::CollectGarbage(v8::internal::AllocationSpace, v8::internal::GarbageCollectionReason, v8::GCCallbackFlags) [/usr/local/bin/node]
 8: 0x1005a2925 v8::internal::Heap::CollectAllAvailableGarbage(v8::internal::GarbageCollectionReason) [/usr/local/bin/node]
 9: 0x1005aed91 v8::internal::Heap::AllocateRawWithRetryOrFail(int, v8::internal::AllocationSpace, v8::internal::AllocationAlignment) [/usr/local/bin/node]
10: 0x1005814ea v8::internal::Factory::AllocateRawOneByteInternalizedString(int, unsigned int) [/usr/local/bin/node]
11: 0x10058187a v8::internal::Factory::NewOneByteInternalizedString(v8::internal::Vector<unsigned char const>, unsigned int) [/usr/local/bin/node]
12: 0x1006fa8e4 v8::internal::StringTable::AddKeyNoResize(v8::internal::Isolate*, v8::internal::StringTableKey*) [/usr/local/bin/node]
13: 0x1001f2b2b v8::internal::AstValueFactory::Internalize(v8::internal::Isolate*) [/usr/local/bin/node]
14: 0x1002c1fff v8::internal::(anonymous namespace)::FinalizeTopLevel(v8::internal::ParseInfo*, v8::internal::Isolate*, v8::internal::UnoptimizedCompilationJob*, std::__1::forward_list<std::__1::unique_ptr<v8::internal::UnoptimizedCompilationJob, std::__1::default_delete<v8::internal::UnoptimizedCompilationJob> >, std::__1::allocator<std::__1::unique_ptr<v8::internal::UnoptimizedCompilationJob, std::__1::default_delete<v8::internal::UnoptimizedCompilationJob> > > >*) [/usr/local/bin/node]
15: 0x1002bfd4f v8::internal::(anonymous namespace)::CompileToplevel(v8::internal::ParseInfo*, v8::internal::Isolate*) [/usr/local/bin/node]
16: 0x1002c0ed5 v8::internal::Compiler::GetSharedFunctionInfoForScript(v8::internal::Isolate*, v8::internal::Handle<v8::internal::String>, v8::internal::Compiler::ScriptDetails const&, v8::ScriptOriginOptions, v8::Extension*, v8::internal::ScriptData*, v8::ScriptCompiler::CompileOptions, v8::ScriptCompiler::NoCacheReason, v8::internal::NativesFlag) [/usr/local/bin/node]
17: 0x1001a8416 v8::ScriptCompiler::CompileUnboundInternal(v8::Isolate*, v8::ScriptCompiler::Source*, v8::ScriptCompiler::CompileOptions, v8::ScriptCompiler::NoCacheReason) [/usr/local/bin/node]
18: 0x10005ee47 node::contextify::ContextifyScript::New(v8::FunctionCallbackInfo<v8::Value> const&) [/usr/local/bin/node]
19: 0x100226d47 v8::internal::FunctionCallbackArguments::Call(v8::internal::CallHandlerInfo*) [/usr/local/bin/node]
20: 0x100225ff8 v8::internal::MaybeHandle<v8::internal::Object> v8::internal::(anonymous namespace)::HandleApiCallHelper<true>(v8::internal::Isolate*, v8::internal::Handle<v8::internal::HeapObject>, v8::internal::Handle<v8::internal::HeapObject>, v8::internal::Handle<v8::internal::FunctionTemplateInfo>, v8::internal::Handle<v8::internal::Object>, v8::internal::BuiltinArguments) [/usr/local/bin/node]
21: 0x1002259c0 v8::internal::Builtin_Impl_HandleApiCall(v8::internal::BuiltinArguments, v8::internal::Isolate*) [/usr/local/bin/node]
22: 0xfefa48cfb7d
23: 0xfefa4889e66
Abort trap: 6
 inoyakaigor
on 28 Nov 2018
inoyakaigor
on 28 Nov 2018
Hey there guys, I'm not sure, but it seems that I found some kind of solution for somebody. I was faced with the same problem and decide to switch off optimization field inside the development-config. And it was solution for me.
...other 1st-level fields
optimization: {
        minimizer: [
            new UglifyJsPluginInstance({
                parallel: true,
                exclude: ['node_modules'],
            }),
        ],
        runtimeChunk: 'single',
        splitChunks: {
            chunks: 'all',
            maxInitialRequests: Infinity,
            minSize: 0,
            maxSize: 50000,
            minChunks: 2,
            cacheGroups: {
                vendor: {
                    name: 'vendor',
                    test: /\/node_modules\//,
                    name: packagesNamesHandler,
                },
            },
            automaticNameDelimiter: '-',
        },
        noEmitOnErrors: true,
        providedExports: false,
    },
   ...other 1st-level fields
So, I guess some of this code might lead to memory leaks. Note, that there is field which contains instance of uglifyjs-webpack-plugin which was noticed earlier as one of the causes of the leaks. I hope it will useful for somebody.
 Neporotovskiy
on 28 Nov 2018
Neporotovskiy
on 28 Nov 2018
@Neporotovskiy great!
What do you mean by packagesNamesHandler?
Thanks!
 jgcmarins
on 29 Nov 2018
jgcmarins
on 29 Nov 2018
@jgcmarins I glad to be helpful.
@Neporotovskiy great!
What do you mean bypackagesNamesHandler?
Thanks!
This function takes the context of each module allowed by the test field and performs some modulations of it for creating the name of separate chunk for this module. I saw this approach here https://hackernoon.com/the-100-correct-way-to-split-your-chunks-with-webpack-f8a9df5b7758. I'm not sure that it is 100% correct way to bundle splitting, but it was useful for my home-project.
Neporotovskiy
on 29 Nov 2018
Chiming in here that I'm also experiencing this but am unsure how one would create a bare-bones repo to reproduce it because I'm not sure what is causing it. Seems to happen several times a day while rapid re-saving of SCSS files.
Latest versions of webpack, webpack-cli, webpack-dev-server
What can I do to aid in diagnosing this?
 lnorton89
on 30 Nov 2018
lnorton89
on 30 Nov 2018
How are people diagnosing/tracking down where these issues are coming from? I've been directed to blogs like this: https://hacks.mozilla.org/2012/11/tracking-down-memory-leaks-in-node-js-a-node-js-holiday-season/ but it's 6 years out of date now! Others have suggested installing memwatch - I can't even install that, it fails with a bunch of cryptic errors. Running with --inspect or --inspect-brk doesn't seem to do anything at all.
I've inherited a large app, with a very complex build (it uses Java spring boot rather than Angular/webpack dev server). It worked perfectly in Angular 5 with Webpack 3, but now after updating to Angular 6/Webpack 4 running with --watch crashes after 3/4 rebuilds. The app itself works perfectly!
 danwellman
on 3 Dec 2018
danwellman
on 3 Dec 2018
Take a look at https://github.com/Sinewyk/webpack_leak_6929 for a practical example on how to quickly generate heapdumps and OOM errors (you need to reduce your use case to what truly breaks it). Copy/paste your config and check it breaks, and remove everything one by one until it doesn't break anymore, isolate the problem.
Then take a look at https://github.com/webpack/webpack/issues/6929#issuecomment-403441611 for a technical on how to dissect heap dump and help find the leak.
Once you have the heapdumps you can probably also just check out the documentation of the chrome dev tools for further help.
edit: we know (and accept) there's a small leak when using HMR, so this thread is about "unreasonable" (buggy) leaks. Not "known" leaks (like the example after 13 hours of coding, just restart when you go to pee or during lunch break and you're good to go).
Sinewyk
on 3 Dec 2018
Thanks @Sinewyk. The issue for me occurs after just 3/4 rebuilds - I wish it could last 13 hours! Also, I am not using HMR, so it wouldn't seem related to that. The problem with reducing the build until it isolates the problem is that there is only so much I can remove before the build does not work at all - I start disabling things one by one, the problem continues, until so much is removed that the build no longer works at all. I did try installing and using headdumps, as in your minimal repro app, but it took too long to even run a single dev build that I couldn't get to the stage where the watch would crash...
danwellman
on 4 Dec 2018
I could confirm that problem occurs very fast when editing SCSS files.
Acionyx
on 4 Dec 2018
@Acionyx please create minimum reproducible test repo in sass-loader
alexander-akait
on 4 Dec 2018
I've implemented a script that keeps restarting webpack for me: https://twitter.com/jgcmarins/status/1069956634892529664
jgcmarins
on 4 Dec 2018
I returned to a git branch after a two week vacation where I then installed the latest versions of Webpack and css-loader only to experience this error. I was able to prevent it by ensuring that I had this in my config:
optimization: {
    splitChunks: {
        chunks: 'all'
    }
}
I had previously been omitting the entire optimization property when building for karma.
 stevenvachon
on 13 Dec 2018
stevenvachon
on 13 Dec 2018
Thanks @stevenvachon!
Setting the splitChunks optimization stopped the out of memory errors for me.
KurtPreston
on 17 Dec 2018
Have you remove [chunkhash] or [hash] in filename of output option?
like below,
output: {
        path: PATH.build,
        filename: '[name].js'
    },
 Younghun-Jung
on 18 Dec 2018
Younghun-Jung
on 18 Dec 2018
Somebody can create reproducible test repo with splitChunks problem?
alexander-akait
on 18 Dec 2018
@Acionyx please create minimum reproducible test repo in
sass-loader
There is a memory leak .. it saves the entire bundle in memory because of queue.
this happens every rebuild and continues to grow until crash (out of memory).
 xcxooxl
on 31 Dec 2018
xcxooxl
on 31 Dec 2018
I kept having core dumps because node was running out of memory during development, so I digged a bit. With my configuration, the leaks were coming from two sources:
When using favicons-webpack-plugin, for some reason, multiple instances of
Compiler(and all the caches it references) are stored in memory and never destroyed every time a file changes. I'll just remove this plugin during development (or maybe I'll just find a replacement).When using
[hash]substitutions in bundle filenames or chunk filenames, Webpack (without any plugin) is leaking memory because it stores each bundle in memory, indexed by its file name. I created a minimal repository to reproduce, please have a look. Removing[hash]substitutions during development fixed the issue for me.
I hope it can help someone. Cheers.
 BenoitZugmeyer
on 17 Jan 2019
BenoitZugmeyer
on 17 Jan 2019
We have this issue aswell
Changing our optimization from:
optimization: {
        splitChunks: {
            chunks: 'async',
            minSize: 30000,
            maxSize: 0,
            minChunks: 1,
            maxAsyncRequests: 5,
            maxInitialRequests: 3,
            automaticNameDelimiter: '~',
            name: true,
            cacheGroups: {
                vendor: {
                    name: 'vendor',
                    chunks: "all",
                    priority: -10
                },
                polyfills: {
                    name: 'polyfills',
                    chunks: "all",
                    priority: -10
                },
                default: {
                    minChunks: 2,
                    priority: -20,
                    reuseExistingChunk: true
                }
            }
        }
    },
to
optimization: {
        splitChunks: {
            chunks: 'all'
        }
    },
Fixes the issue, not sure what the impact is tho. So i'm still figuring that out.
 SamanthaAdrichem
on 28 Jan 2019
SamanthaAdrichem
on 28 Jan 2019
For us it seems to be in the cacheGroups part. As soon as i disable it all works fine.
The same error occurs when using UglifyJsPlugin.
SamanthaAdrichem
on 29 Jan 2019
In our team, as @Younghun-Jung said the memory leak was caused by using [hash] on the output entry of the webpack file. However, the memory used by the app running on chrome is still growing without limits on every refresh of the dev server (at least webpack does not exit the execution abruptly, the chrome tab kills himself before the system runs out of RAM).
Have you remove [chunkhash] or [hash] in filename of output option?
like below,output: { path: PATH.build, filename: '[name].js' },
 arananegra
on 30 Jan 2019
arananegra
on 30 Jan 2019
We never used [hash] we already append the last commit hash to the deploys ‘manually’ (by creating an env variable APP_VERSION).
I managed to get a working version by increasing the heap memory and removing the cache groups and chunk naming. It now uploads to app.js and vendors~app.js instead of vendors.js
Will look into it more when i’m back at work to prevent it from growing and growing and growing.
As a side note eventough the error occurs during the TerserPlugin. It also occurs with uglify plugin (if we swap em around)
SamanthaAdrichem
on 30 Jan 2019
We were experiencing similar heap out of memory issues after just 5-15 HMR reloads since our upgrade to Webpack 4.
We fixed it by first making sure we upgraded all loaders used by webpack, and switched out one plugin which seemed to have a memory leak when using it with webpack 4: we switched from https://github.com/jantimon/favicons-webpack-plugin to https://github.com/brunocodutra/webapp-webpack-plugin
 DerMika
on 13 Feb 2019
DerMika
on 13 Feb 2019
We made this patch-package https://gist.github.com/sibelius/baf12454c371e9d6c728376c39d9f1e0
this will make just one bundle on development mode, making it much faster and without consuming a lot of memory
we also use WPS https://github.com/shellscape/webpack-plugin-serve
sibelius
on 13 Feb 2019
can confirm, and here's my log:
Security context: 0x1567eeb1e549 <JSObject>
    1: update [0x15679efed5b9] [internal/crypto/hash.js:62] [bytecode=0x1567d6f55cc1 offset=106](this=0x1567b98e25e9 <Hash map = 0x1567ff67ff01>,data=0x1567b98e2551 <Very long string[6514480]>,encoding=0x15672c3826f1 <undefined>)
    2: update [0x1567ae9ec341] [/Users/xx/project/node_modules/webpack/lib/util/createHash.js:35] [bytecode=...

FATAL ERROR: CALL_AND_RETRY_LAST Allocation failed - JavaScript heap out of memory
Version:
- node: 10.9.0
- webpack: 4.29.0
 chuyik
on 6 Mar 2019
chuyik
on 6 Mar 2019
@sibelius why do you use WPS instead official webpack-dev-server? You have some problems with webpack-dev-server?
alexander-akait
on 6 Mar 2019
This helped me with a similar issue (with karma-webpack):
cross-env NODE_OPTIONS=--max_old_space_size=4096 node ...
Also ran into this and setting chunks: 'all' was what fixed it for me. Definitely seems like there is a bug here though.
 chrisnicola
on 15 Mar 2019
chrisnicola
on 15 Mar 2019
@chrisnicola don't think, you can have very big app where you need more memory, anyway can you create minimum reproducible test repo? It happens only with webpack-dev-server?
alexander-akait
on 15 Mar 2019
@evilebottnawi as far as I can tell, though it may also happen with just watch mode enabled. I'll have to test it. I would get that it was a memory issue, but increasing memory doesn't fix the problem, and it always compiles fine the first couple of times.
Not sure I'll have time for a minimal test repo, also I'm not really sure what conditions cause it, other than the fact that chunks: 'all' fixes it.
chrisnicola
on 16 Mar 2019
@chrisdothtml
though it may also happen with just watch mode enabled
Looks problem is not in webpack-dev-server
It is hard to say what is leak without reproducible test repo
alexander-akait
on 16 Mar 2019
For me it was in a build during miniying the source code. Had nothing to do with dev-server because that wasnt used. It happens no matter what minifier we use.
SamanthaAdrichem
on 16 Mar 2019
When i read Source maps are resource heavy and can cause out of memory issue for large source files.
const shouldUseSourceMap = process.env.GENERATE_SOURCEMAP !== 'false'; in react-scripts package, i get sourceMap: false that help me fix it. Hope you can help.
 becarchal
on 25 Mar 2019
becarchal
on 25 Mar 2019
$ make                                                                六  4/13 13:52:40 2019
rm -rf dist/*
node_modules/.bin/webpack-dev-server --config 'webpack/dev.js' --color

● Webpack █████████████████████████ building (69%) 4543/4561 modules 18 active
  ...s-loader › src/components/pages/streaming/components/rule-checker/components/select-template-modal/index.scss

[HPM] Proxy created: /api/gw  ->  http://192.168.21.79:6090
[HPM] Subscribed to http-proxy events:  [ 'proxyRes', 'error', 'close' ]
ℹ 「wds」: Project is running at http://0.0.0.0:4000/
ℹ 「wds」: webpack output is served from /
ℹ 「wds」: 404s will fallback to /index.html
ℹ 「wdm」: wait until bundle finished: /

<--- Last few GCs --->

[5389:0x103ae4000]    55668 ms: Mark-sweep 1378.8 (1456.4) -> 1378.8 (1456.4) MB, 1323.9 / 0.0 ms  (average mu = 0.082, current mu = 0.001) allocation failure GC in old space requested
[5389:0x103ae4000]    56845 ms: Mark-sweep 1378.8 (1456.4) -> 1378.8 (1456.4) MB, 1175.3 / 0.0 ms  (average mu = 0.043, current mu = 0.001) allocation failure GC in old space requested


<--- JS stacktrace --->

==== JS stack trace =========================================

    0: ExitFrame [pc: 0x27116674fc7d]
Security context: 0x22085981d9d1 <JSObject>
    1: visitQueue [0x220824a57029] [/Users/Carter/sharplook/node_modules/@babel/traverse/lib/context.js:~96] [pc=0x271167767a22](this=0x2208c7c33d51 <TraversalContext map = 0x2208009caaa1>,0x2208c7c33db1 <JSArray[1]>)
    2: visitSingle [0x220824a56ec1] [/Users/Carter/sharplook/node_modules/@babel/traverse/lib/context.js:~88] [pc=0x27116776bde7](this=0x2208c...

FATAL ERROR: Ineffective mark-compacts near heap limit Allocation failed - JavaScript heap out of memory
 1: 0x1000664d8 node::Abort() [/usr/local/bin/node]
 2: 0x100066b6d node::OnFatalError(char const*, char const*) [/usr/local/bin/node]
 3: 0x10018059b v8::Utils::ReportOOMFailure(v8::internal::Isolate*, char const*, bool) [/usr/local/bin/node]
 4: 0x10018053c v8::internal::V8::FatalProcessOutOfMemory(v8::internal::Isolate*, char const*, bool) [/usr/local/bin/node]
 5: 0x1004439c4 v8::internal::Heap::UpdateSurvivalStatistics(int) [/usr/local/bin/node]
 6: 0x10044544f v8::internal::Heap::CheckIneffectiveMarkCompact(unsigned long, double) [/usr/local/bin/node]
 7: 0x100442d20 v8::internal::Heap::PerformGarbageCollection(v8::internal::GarbageCollector, v8::GCCallbackFlags) [/usr/local/bin/node]
 8: 0x100441aca v8::internal::Heap::CollectGarbage(v8::internal::AllocationSpace, v8::internal::GarbageCollectionReason, v8::GCCallbackFlags) [/usr/local/bin/node]
 9: 0x100449a38 v8::internal::Heap::AllocateRawWithLightRetry(int, v8::internal::AllocationSpace, v8::internal::AllocationAlignment) [/usr/local/bin/node]
10: 0x100449a84 v8::internal::Heap::AllocateRawWithRetryOrFail(int, v8::internal::AllocationSpace, v8::internal::AllocationAlignment) [/usr/local/bin/node]
11: 0x100429f5e v8::internal::Factory::New(v8::internal::Handle<v8::internal::Map>, v8::internal::PretenureFlag) [/usr/local/bin/node]
12: 0x100438d19 v8::internal::Factory::NewLoadHandler(int) [/usr/local/bin/node]
13: 0x10048c1fe v8::internal::LoadHandler::LoadFullChain(v8::internal::Isolate*, v8::internal::Handle<v8::internal::Map>, v8::internal::MaybeObjectHandle, v8::internal::Handle<v8::internal::Smi>) [/usr/local/bin/node]
14: 0x10048f63f v8::internal::LoadIC::UpdateCaches(v8::internal::LookupIterator*) [/usr/local/bin/node]
15: 0x10048f33c v8::internal::LoadIC::Load(v8::internal::Handle<v8::internal::Object>, v8::internal::Handle<v8::internal::Name>) [/usr/local/bin/node]
16: 0x100491e6a v8::internal::KeyedLoadIC::Load(v8::internal::Handle<v8::internal::Object>, v8::internal::Handle<v8::internal::Object>) [/usr/local/bin/node]
17: 0x100495e34 v8::internal::Runtime_KeyedLoadIC_Miss(int, v8::internal::Object**, v8::internal::Isolate*) [/usr/local/bin/node]
18: 0x27116674fc7d
19: 0x271167767a22
make: *** [Makefile:2: dev] Abort trap: 6
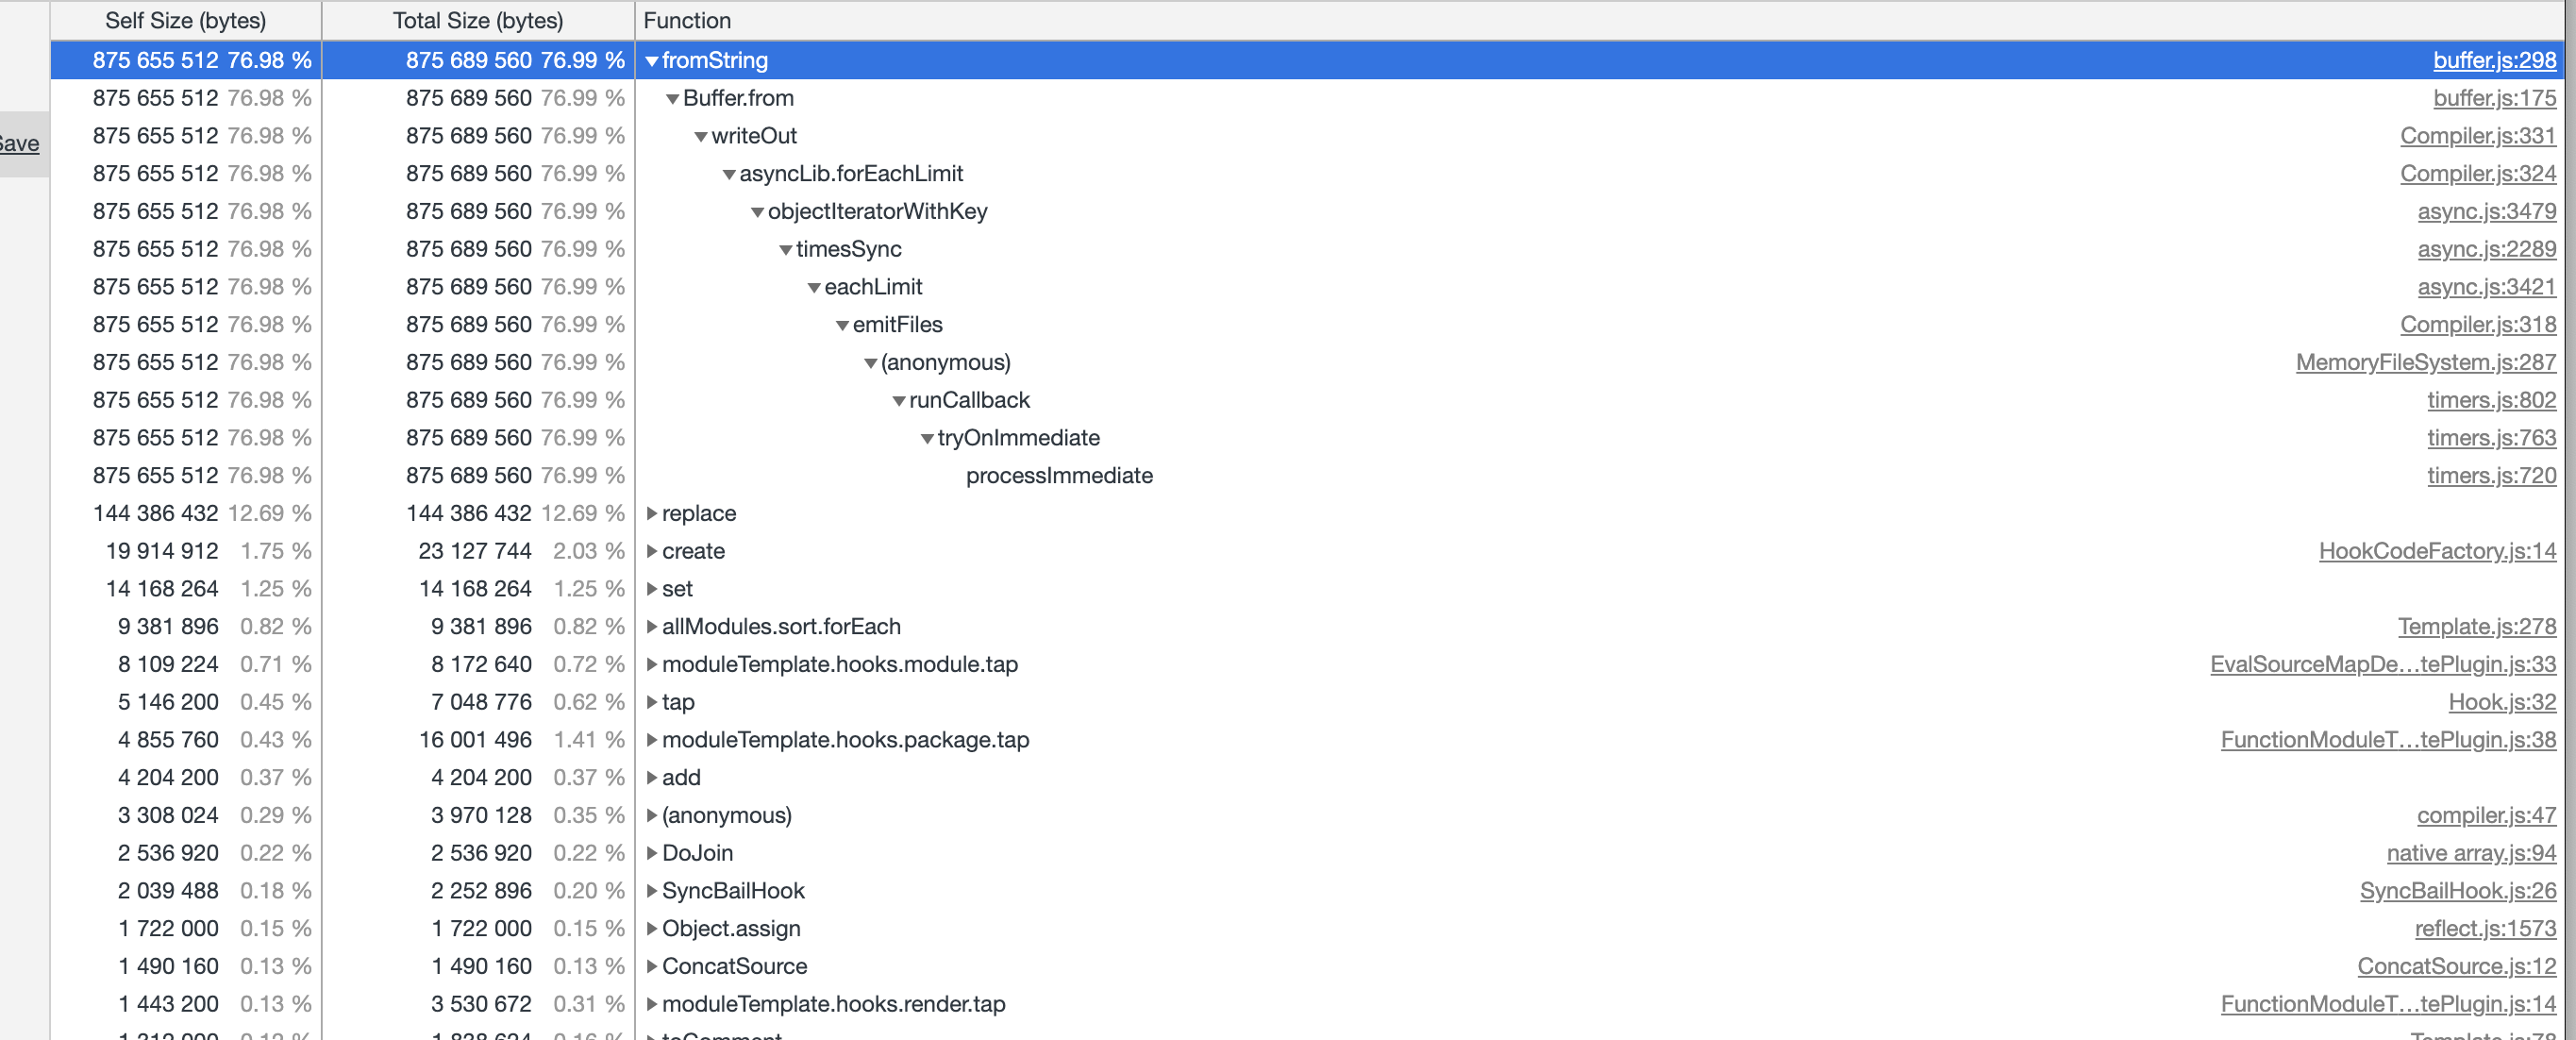
v4.29 here while using dev server. Looking at the memory sample during OOM does not clarify to me what the cause is. Compiler from Webpack along with MemoryFileSystem from memory-fs register with ~800 MB or so. This is after 1 hour or so of development whereas the initial memory footprint is a few MB only.
Obvious suspect would be in-memory file system (MemoryFileSystem) not being cleared during rebuilds, i.e. hanging onto old files that are irrelevant.
Please LMK how I can be of more assistance trapping this leak.

 evictor
on 16 Apr 2019
evictor
on 16 Apr 2019
any progress on this one?
 sh7dm
on 1 Jun 2019
sh7dm
on 1 Jun 2019
Is there a workaround right now or some kind of way to just ignore the problem like using Webpack 3 again?
 mding5692
on 13 Jun 2019
mding5692
on 13 Jun 2019
After i've commented out devtool: 'inline-source-map',
it worked without memory exception, obviously also without source maps and normal debugging.
After i've tried to add TerserPlugin to optimization (or plugins) section, and it fails again, so obvious that there is a problem with source maps library
node_modules\source-map\lib\util.js (Terser)
node_modules\source-map\lib\source-node.js ( devtool: 'inline-source-map' )
so i stick with inline-cheap-source-map option, at least it makes hot reload possible.
 jokerosky
on 30 Jun 2019
jokerosky
on 30 Jun 2019
"dev": "node --max-old-space-size=8192 node_modules/webpack-dev-server/bin/webpack-dev-server.js --config webpack.config.dev.js"
help for me
 ghost
on 2 Jul 2019
ghost
on 2 Jul 2019
Same issue without plugins, just loaders.
@ edit: Exactly what jokerosky mentioned! Thanks mate!
 inkognitro
on 5 Jul 2019
inkognitro
on 5 Jul 2019
Something to note here:
If you are using a watch mode or dev-server, webpack opts to using an in-memory file system. This means, that anything generating a deterministic results [hashed file names] will persist in the memory file system forever until watch mode is killed and started again.
 TheLarkInn
on 8 Jul 2019
TheLarkInn
on 8 Jul 2019
I cloned the ReactJs source code and ran the command
yarn build react/index,react-dom/index --type=UMD --watch.
I am still getting the error
FATAL ERROR: Ineffective mark-compacts near heap limit Allocation failed - JavaScript heap out of memory.
Here's the full log
<--- Last few GCs --->

[73606:0x103800000]    27499 ms: Mark-sweep 1321.0 (1444.7) -> 1315.1 (1447.7) MB, 525.5 / 0.0 ms  (average mu = 0.206, current mu = 0.132) allocation failure scavenge might not succeed
[73606:0x103800000]    28115 ms: Mark-sweep 1326.1 (1447.7) -> 1316.2 (1450.7) MB, 533.2 / 0.0 ms  (average mu = 0.171, current mu = 0.134) allocation failure scavenge might not succeed


<--- JS stacktrace --->

==== JS stack trace =========================================

    0: ExitFrame [pc: 0x1094f435be3d]
    1: StubFrame [pc: 0x1094f435d3c6]
Security context: 0x02100039e6e1 <JSObject>
    2: /* anonymous */(aka /* anonymous */) [0x210f6ab5969] [/Users/300067056/playground/random/react/node_modules/magic-string/dist/magic-string.cjs.js:~375] [pc=0x1094f4e29ea7](this=0x0210990026f1 <undefined>,segment=0x0210c75e6e79 <JSArray[5]>)
    3: arguments adaptor frame: 3->1
    4: map [0x21000386e59](this=0x021...

FATAL ERROR: Ineffective mark-compacts near heap limit Allocation failed - JavaScript heap out of memory
 1: 0x10003b1db node::Abort() [/usr/local/bin/node]
 2: 0x10003b3e5 node::OnFatalError(char const*, char const*) [/usr/local/bin/node]
 3: 0x1001a86b5 v8::internal::V8::FatalProcessOutOfMemory(v8::internal::Isolate*, char const*, bool) [/usr/local/bin/node]
 4: 0x100573ad2 v8::internal::Heap::FatalProcessOutOfMemory(char const*) [/usr/local/bin/node]
 5: 0x1005765a5 v8::internal::Heap::CheckIneffectiveMarkCompact(unsigned long, double) [/usr/local/bin/node]
 6: 0x10057244f v8::internal::Heap::PerformGarbageCollection(v8::internal::GarbageCollector, v8::GCCallbackFlags) [/usr/local/bin/node]
 7: 0x100570624 v8::internal::Heap::CollectGarbage(v8::internal::AllocationSpace, v8::internal::GarbageCollectionReason, v8::GCCallbackFlags) [/usr/local/bin/node]
 8: 0x10057cebc v8::internal::Heap::AllocateRawWithLigthRetry(int, v8::internal::AllocationSpace, v8::internal::AllocationAlignment) [/usr/local/bin/node]
 9: 0x10057cf3f v8::internal::Heap::AllocateRawWithRetryOrFail(int, v8::internal::AllocationSpace, v8::internal::AllocationAlignment) [/usr/local/bin/node]
10: 0x10054c884 v8::internal::Factory::NewFillerObject(int, bool, v8::internal::AllocationSpace) [/usr/local/bin/node]
11: 0x1007d4894 v8::internal::Runtime_AllocateInNewSpace(int, v8::internal::Object**, v8::internal::Isolate*) [/usr/local/bin/node]
12: 0x1094f435be3d
13: 0x1094f435d3c6
error Command failed with signal "SIGABRT".
Can anyone please help me with this? TIA.
 hk-skit
on 10 Jul 2019
hk-skit
on 10 Jul 2019
I'd mention that it's currently not possible to run webpack-dev-middleware without using a memory-based FS, which means that long-running webpack dev servers (or short-running ones in large projects) will have to be restarted regularly, or will need a custom development server. My team ended up doing the latter simply because of the size of our codebase.
https://github.com/webpack/webpack-dev-middleware/issues/239
salemhilal
on 11 Jul 2019
@salemhilal That's not ideal, of course. It is not unreasonable to expect webpack-dev-middleware to prune no longer needed files when their hash changes.
evictor
on 11 Jul 2019
@evictor Potentially, but as I understand it, it can be non-trivial to tell when things like autogenerated bundles containing split chunks are no longer needed, since these modules may _only_ be named by hash. Or, what if your app is loaded in the browser, a file is edited which causes an async bundle to get renamed, but then in the browser, your code requests the old async chunk? It would error out unexpectedly because the requested bundle was pruned, which could seem more like a misconfiguration than expected behavior.
It could be a whole lot more effective to allow users to just opt out of using memory-fs, since disk space is much cheaper to consume than memory. The change is only a couple of lines.
salemhilal
on 11 Jul 2019
@salemhilal That's not ideal, of course. It is not unreasonable to expect webpack-dev-middleware to prune no longer needed files when their hash changes.
I think we can fix this behavior for next major release
alexander-akait
on 11 Jul 2019
Thanks for the well thought out reply, Salem. I think the error in the
browser is preferable to the OOM — error could be caught and tailored to be
informative, too, e.g. suggesting refresh of page.
Disk space also not a bad idea 👌🏻
On Thu, Jul 11, 2019 at 4:51 AM Evilebot Tnawi notifications@github.com
wrote:
@salemhilal https://github.com/salemhilal That's not ideal, of course.
It is not unreasonable to expect webpack-dev-middleware to prune no longer
needed files when their hash changes.I think we can fix this behavior for next major release
—
You are receiving this because you were mentioned.
Reply to this email directly, view it on GitHub
https://github.com/webpack/webpack/issues/6929?email_source=notifications&email_token=AAMLRPFFDDUAF77ARNWNYXLP64NFVA5CNFSM4EYN4HC2YY3PNVWWK3TUL52HS4DFVREXG43VMVBW63LNMVXHJKTDN5WW2ZLOORPWSZGODZWON4Q#issuecomment-510453490,
or mute the thread
https://github.com/notifications/unsubscribe-auth/AAMLRPAUAVWW6OTI6M3LPULP64NFVANCNFSM4EYN4HCQ
.>
- Zeke
evictor
on 11 Jul 2019
Think that issue related only to chunk's splitting interface/plugin, so, we should free old chunks which are not important after recompilation. To reproduce we should just multiplie save diff. changes, for example 5-6 changes in one second, memory gonna be freed by gc, but not at all, for example normal vue app with a lot of components gonna take near ~300mb, if we gonna save changes it's gonna raise to 500(and cleared by gc, to 300mb again), if we gonna make to much changes it's gonna stuck at first on 500mb, then raise to 600mb-1gb, and return to 500mb(not 300mb), so, i think that there's only chunk splitting plugin issue.
 afwn90cj93201nixr2e1re
on 12 Nov 2019
afwn90cj93201nixr2e1re
on 12 Nov 2019
After i've commented out
devtool: 'inline-source-map',
it worked without memory exception, obviously also without source maps and normal debugging.After i've tried to add TerserPlugin to optimization (or plugins) section, and it fails again, so obvious that there is a problem with source maps library
node_modules\source-map\lib\util.js(Terser)
node_modules\source-map\lib\source-node.js( devtool: 'inline-source-map' )so i stick with inline-cheap-source-map option, at least it makes hot reload possible.
👆 since doing this, we had no more memory leaks, developing a whole day on a huge project, with steadily running webpack dev server. just to mention again..
Ps. And all that also without the split chunks plugin
inkognitro
on 12 Nov 2019
so, you suggest disable chunk splitting on dev server? But that's also not nice for recompile everything everytime.
afwn90cj93201nixr2e1re
on 12 Nov 2019
No. This is not what I wrote. Should only be a hint to find out the root of the problem. And it seems to be with the source maps library.
inkognitro
on 13 Nov 2019
i guess it is the Watching.close() (that is an async method) causes the memory leak...
in my electronjs project, each browser window has a Watching instance, so i need to call the close before the window closed to void the memory leaking, but the electron main process will crash randomly when i close windows, and if i remove the close code the crash will not happen(that's bad the watching can not be closed)
 ije
on 13 Nov 2019
ije
on 13 Nov 2019
Same problem here. webpack version 4.39.2
FATAL ERROR: Ineffective mark-compacts near heap limit Allocation failed - JavaScript heap out of memory
 PritiMaurya
on 26 Nov 2019
PritiMaurya
on 26 Nov 2019
I am also getting this issue:
webpack 3.8.1
webpack-dev-server 2.11.3
When adding --max-old-space-size=8192 the issue transforms into:
/Users/.../Documents/.../staging/node_modules/webpack/lib/Stats.js:221
text += `\n @ ${current.readableIdentifier(requestShortener)}`;
                                                                ^
RangeError: Invalid string length
This has progressively got worse over the last few days to the point now that I cannot work.
 jmcgrory
on 18 Mar 2020
jmcgrory
on 18 Mar 2020
I close the issue because there are many different problems and it is not possible to track them, many problems have been fixed, if you encounter a problem please create a new issue with a reproducible test repo, thanks
alexander-akait
on 25 Mar 2020
Отличное решение. Так держать.
afwn90cj93201nixr2e1re
on 25 Mar 2020
@afwn90cj93201nixr2e1re Нет ничего сложного открыть новую проблему с воспроизводимым примером ошибки/зависания/утечки и тд. Используйте только анлийский язык в будущем.
alexander-akait
on 25 Mar 2020
Мда, то есть тебе не достаточно этих репортов? 90% которых ссылаются на неверно реализованное кеширование дев сервера...
И да, это видимо главная проблема, которая до сих пор не исправлена, but issue closed, np,
afwn90cj93201nixr2e1re
on 25 Mar 2020
@afwn90cj93201nixr2e1re Я настоятельнр рекомендую использовать анлийский для общения. Проблемы с переполнением памяти dev сервера известна при долгой работе и открыта в репозитории dev сервера, нет никакого смысла в дубликате и ее не возможно исправить на стороне webpack. Репортов недостаточно? Половина из них просто спам без какой-либо информации, я не могу починить что-то где-то не зная в чем проблема, извините я не джин или маг. Остальная половина или уже не актулально и устарело, или в сторонних плагинах, который мы тоже не можем исправить. Хочешь быстрого решения - создай хорошо описанную проблему с примером, хочешь еще быстрее - помоги в решении, это открое программное обеспечение.
alexander-akait
on 25 Mar 2020
ее не возможно исправить на стороне webpack
So, i think it's better to close this issue with that note, instead I close the issue because there are many different problems and it is not possible to track them, many problems have been fixed, if you encounter a problem please create a new issue with a reproducible test repo, thanks.
afwn90cj93201nixr2e1re
on 25 Mar 2020
Here not only bug(s) with webpack-dev-server
alexander-akait
on 25 Mar 2020
btw most of them (90%) related to cache issue's...
5% - to old version, 4% - to old plugins, 1% - other stuff.
afwn90cj93201nixr2e1re
on 25 Mar 2020
Related issues
 unindented
·
3Comments
unindented
·
3Comments
 yannispanousis
·
3Comments
yannispanousis
·
3Comments
 Mithras
·
3Comments
Mithras
·
3Comments
 sairion
·
3Comments
sairion
·
3Comments
 nicksparks
·
3Comments
nicksparks
·
3Comments
Most helpful comment
Got the same issue when developing with hot reload.