Webapi: Memory leak when using OData 7.3.0 and EF Core 3.1.2
I forked this sample to add the EF Core support. It is configured to use in-memory DB, but the effect is the same with MySQL for example.
When doing OData requests the memory keeps growing and is never released.
Here is the forked version with the memory leak problem.
Assemblies affected
AspNetCore OData 7.3.0 and EF Core 3.1.2
Reproduce steps
- Run the demo project.
- Make several hundred GET requests to: localhost:3509/odata/persons?$filter=Name+in+('some name')&$orderby=Date+asc
Expected result
Memory to stop increasing and get released at some point.
Actual result
Memory consumption keeps growing and is never released.

 vladimir-kanev
All 15 comments
I think the problem might be that the OData query is not parameterized. This leads to adding every single query to the cache and hence huge memory usage.
The question is is there some way to make the OData query parameterized?
vladimir-kanev
on 17 Mar 2020
FYI. Potentially, it's related to this PR: https://github.com/OData/WebApi/pull/1506
 xuzhg
on 17 Mar 2020
xuzhg
on 17 Mar 2020
Hi @vladimir-kanev I am curious to know whether the 3 GC collections that appear on the screenshot were triggered automatically or whether you forced them with GC.Collect(). If they were triggered automatically, it's possible that the GC did not perform an exhaustive collection since your system was not under a lot of memory pressure.
I tried your demo app and I was able to reproduce the behaviour. When the automatic GC ran, I did not observe a memory reduction. I then added an endpoint that class GC.Collect(), which performs garbage collection across all generations. When I called this endpoint, I did see the memory usage decreasing as you can see in the attached screenshot.
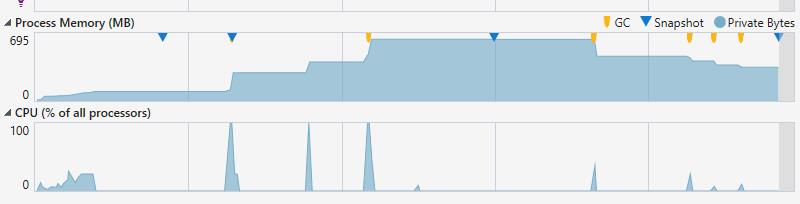
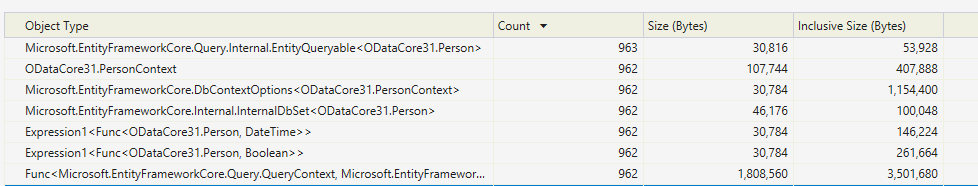
However, memory seems to reduce up to a point. And looking at the objects in the managed heap after GC, there's still 100's of instances of classes like PersonContext and EntityQueryable
Just a few more clarifying questions:
- How much free memory did you have on your system
- Did your memory continue to grow as a result of making additional calls to the endpoint, or was there any other activity running on your server? In my case there were memory spikes when I hit the endpoint multiple times then curve remained flat until I flood the endpoint again.
 habbes
on 14 Apr 2020
habbes
on 14 Apr 2020
Hi @habbes , thanks for checking this!
The GC collections were triggered automatically, I haven’t forced GC.Collect(). Even if I try it now, there is no difference for me, memory usage doesn’t drop.
I am running similar scenarios (OData queries) with Docker containers limited to 512 MB memory, when limit is reached there is a crash because of ‘Out of memory’.
When debugging on my PC the memory usage flattens at around 1.4 GB.
In my case the memory gets high only when calls with OData queries are made.
vladimir-kanev
on 14 Apr 2020
About the query parametrization, currently the the EF Core query looks like this with OData:
Microsoft.EntityFrameworkCore.Infrastructure: Information: Entity Framework Core 3.1.2 initialized 'PersonContext' using provider 'Microsoft.EntityFrameworkCore.InMemory' with options: StoreName=person
Microsoft.EntityFrameworkCore.Query: Debug: queryContext => new QueryingEnumerable<Person>(
    queryContext,
    InMemoryShapedQueryCompilingExpressionVisitor.Table(
        queryContext: queryContext,
        entityType: EntityType: Person)
        .Where(valueBuffer => List<string> { "john doe", }
            .Contains(EntityMaterializerSource.TryReadValue<string>(valueBuffer, 2, Property: Person.Name (string))))
        .OrderBy(valueBuffer => EntityMaterializerSource.TryReadValue<DateTime>(valueBuffer, 1, Property: Person.Date (DateTime) Required))
        .Select(valueBuffer => new ValueBuffer(new object[]
        {
            (object)EntityMaterializerSource.TryReadValue<int>(valueBuffer, 0, Property: Person.Id (int) Required PK AfterSave:Throw ValueGenerated.OnAdd),
            (object)EntityMaterializerSource.TryReadValue<DateTime>(valueBuffer, 1, Property: Person.Date (DateTime) Required),
            EntityMaterializerSource.TryReadValue<string>(valueBuffer, 2, Property: Person.Name (string))
        })),
    Func<QueryContext, ValueBuffer, Person>,
    ODataCore31.PersonContext,
    DiagnosticsLogger<Query>
)
Microsoft.EntityFrameworkCore.Infrastructure: Debug: 'PersonContext' disposed.
Notice how the name parameter value is hardcoded in the query: .Where(valueBuffer => List<string> { "john doe", }. On every request this query is generated again and again.
If I change the controller endpoint implementation to this:
        [HttpGet]
        public IEnumerable<Person> Get(string name)
        {
            return _personContext.People.Where(p => p.Name == name);
        }
Then the query looks like this:
Microsoft.EntityFrameworkCore.Infrastructure: Information: Entity Framework Core 3.1.2 initialized 'PersonContext' using provider 'Microsoft.EntityFrameworkCore.InMemory' with options: StoreName=person
Microsoft.EntityFrameworkCore.Query: Debug: queryContext => new QueryingEnumerable<Person>(
    queryContext,
    InMemoryShapedQueryCompilingExpressionVisitor.Table(
        queryContext: queryContext,
        entityType: EntityType: Person)
        .Where(valueBuffer => EntityMaterializerSource.TryReadValue<string>(valueBuffer, 2, Property: Person.Name (string)) == InMemoryExpressionTranslatingExpressionVisitor.GetParameterValue<string>(
            queryContext: queryContext,
            parameterName: "__name_0"))
        .Select(valueBuffer => new ValueBuffer(new object[]
        {
            (object)EntityMaterializerSource.TryReadValue<int>(valueBuffer, 0, Property: Person.Id (int) Required PK AfterSave:Throw ValueGenerated.OnAdd),
            (object)EntityMaterializerSource.TryReadValue<DateTime>(valueBuffer, 1, Property: Person.Date (DateTime) Required),
            EntityMaterializerSource.TryReadValue<string>(valueBuffer, 2, Property: Person.Name (string))
        })),
    Func<QueryContext, ValueBuffer, Person>,
    ODataCore31.PersonContext,
    DiagnosticsLogger<Query>
)
Microsoft.EntityFrameworkCore.Infrastructure: Debug: 'PersonContext' disposed.
Then we have a parameter parameterName: "__name_0") and this query is reused, it is created only once. Also in this case the memory consumption remains flat at around 250 MB.
That's why I think that the problem is that OData queries are not parameterized.
vladimir-kanev
on 14 Apr 2020
@vladimir-kanev thanks for the explanation and samples regarding query parameterization. I think that explains the query being generated on every request. I'll take a look into this. I does not explain they are not getting deallocated though, does EFCore cache the queries, even when they are not parameterized?
habbes
on 7 May 2020
Yes, I think EFCore caches too many queries, while it should cache only 1 if parameterized. I don't know for how long EFCore keeps the cached queries.
vladimir-kanev
on 7 May 2020
I found this section on the EFCore docs which mentions that EFcore caches queries and usually generates parameters for client-evaluated inputs so that they can reuse the cached query. But in cases where it can't generate parameters for them, this could lead to a memory leak. It gives broad examples of situation in which this could happen: https://docs.microsoft.com/en-us/ef/core/querying/client-eval#potential-memory-leak-in-client-evaluation
habbes
on 11 May 2020
When OData WebAPI gets a query like you had initially localhost:3509/odata/persons?$filter=Name+in+('some name')&$orderby=Date+asc, the ('some name') part gets parsed into a CollectionConstantNode by the OData UriParser. When the query is being transformed into a LINQ query, this node is transformed into Expression.Constant node: https://github.com/OData/WebApi/blob/master/src/Microsoft.AspNet.OData.Shared/Query/Expressions/ExpressionBinderBase.cs#L1205-L1226
And the entire filter clause is transformed into a Lambda expression: https://github.com/OData/WebApi/blob/master/src/Microsoft.AspNet.OData.Shared/Query/Expressions/FilterBinder.cs#L158-L170
Well according to this thread, (specifically this comment), constants used inside lambdas are not parameterized by EF Core.
According to this article, wrapping the constant inside a lambda call, might address the problem. Since it's not a constant being passed to EF Core filter, but a variable from a closure, then it gets parameterized.
This explains why the queries were not parameterized. But I'm still not sure I understand why the query was not re-used. Since we were issuing the same exact OData query, I assume this would produce the same exact EF Core query since the inputs did not change, and therefore should reuse the existing query in the cache.
habbes
on 12 May 2020
But I'm still not sure I understand why the query was not re-used. Since we were issuing the same exact OData query,
Probable cause since it is a constant expression of type list, when we look for query cache to find same tree, the constant values do not match (since it is a new list instance). Therefore generating a cache miss every time.
 smitpatel
on 14 May 2020
smitpatel
on 14 May 2020
Hi @smitpatel @vladimir-kanev it appears that WebAPI already handles constant parameterization, but that feature was not enabled for collection constants, this PR #2172 fixes it.
I did notice some strange behaviour related to the number of cached entries before my PR. When I flooded the server with 1000 queries, then took a snapshot of the memory (using VS's studio diagnostic tools) I would find that the number of entries in Microsoft.Extensions.Caching.Memory.MemoryCache has increased by about 1000 (from 2 to 1002). But when I flooded it with subsequent queries, the entries do not increase, in fact they decreased to about 964. At this point I cannot explain this behaviour, but then again I'm not very well versed with the internal mechanisms of EF Core caching and what the expected behaviour should be. After I implemented the fix, the number of entries only increase by 1 (from 2 to 3).
Do you know what explains this behaviour @smitpatel ?
habbes
on 22 May 2020
As I explained earlier, without the fix, it is a new constant expression every time which generates a different expression tree hence query cache miss. So in order to execute query EF Core will compile the query and store the delegate in the cache hence you see rise in cache by the same amount number of queries. The decrease could possibly be something causing IMemoryCache to release some entries, I am not sure when that would happen, we don't do that in EF Core explicitly.
smitpatel
on 22 May 2020
Thanks @smitpatel I got the reason why it increased. What puzzled me is why it stopped increasing and why it decreased. Thanks for the hint. I will research more about the eviction policies.
habbes
on 22 May 2020
Probably upper limit on the cache size. This specifies upper limit on cache size when EF Core registers it internally (unless provided by the user) https://github.com/dotnet/efcore/blob/85b57af827aa71b77d673e813e046d081c8027ed/src/EFCore/Infrastructure/EntityFrameworkServicesBuilder.cs#L262
smitpatel
on 22 May 2020
Thanks @habbes! The problem is fixed in v7.4.1
vladimir-kanev
on 4 Jun 2020
Related issues
 johnhzhu
·
4Comments
johnhzhu
·
4Comments
 ilya-chumakov
·
5Comments
ilya-chumakov
·
5Comments
 MDzyga
·
5Comments
MDzyga
·
5Comments
 christiannagel
·
4Comments
christiannagel
·
4Comments
 LianwMS
·
5Comments
LianwMS
·
5Comments