Web: Revert gas price vs confirmation time
https://gitcoin.co/gas right now looks like this:
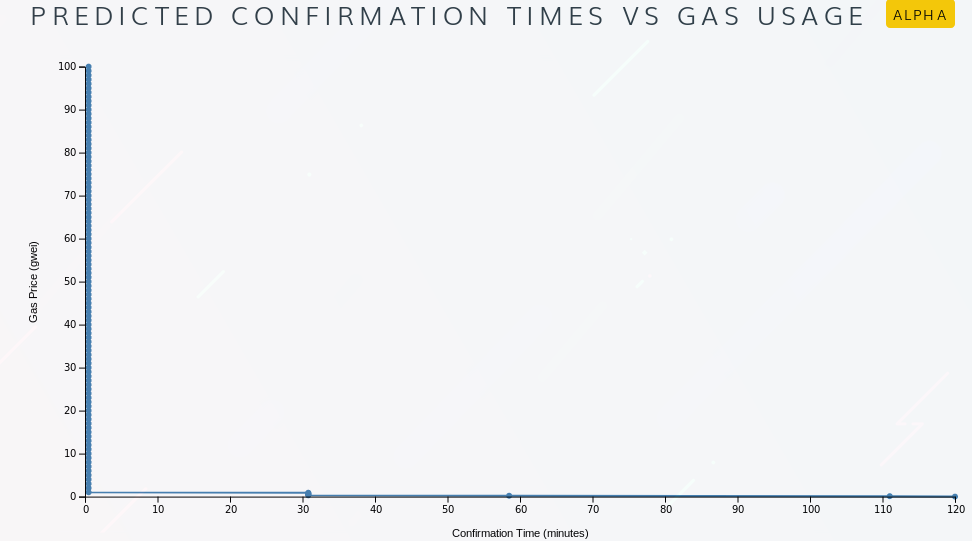
Which doesn't seem too informative to me. How about switching axis?
(as a bonus points)
- make graph scale
- use historical data to measure realistic max gas price on axis
 abitrolly
All 14 comments
hehehe.. when the ethereum network is doing really really well (operating fast and effectively), then the gitcoin.co/gas graph looks bad..
i'd almost advocate for not showing the graph if conditions are such that you can confirm a tx for < 1 gwei in < 1 minute. just say "the ethereum network is operating at peak performnance" then a subtitle "there is no tradeoff between speed and price right now. please use 1gwei for a cheap, fast, tx"
 owocki
on 9 Apr 2018
owocki
on 9 Apr 2018
Placing a button to rotate the axis would solve the problem for me. The price can also be < 1gwei, right?
abitrolly
on 9 Apr 2018
@abitrolly I don't think so, I thought 1 gwei was the atom that couldn't be split for a tx? 🤔
 mkosowsk
on 9 Apr 2018
mkosowsk
on 9 Apr 2018
We could use a charting library that renders the scale dynamically based on the values ! Might solve the problem
 thelostone-mc
on 9 Apr 2018
thelostone-mc
on 9 Apr 2018
@abitrolly I don't think so, I thought 1 gwei was the atom that couldn't be split for a tx? 🤔
you can def do 0.1 or 0.2 gwei gas in metamask. not sure about other clients
the data is gathered from here https://ethgasstation.info/predictionTable.php
owocki
on 9 Apr 2018
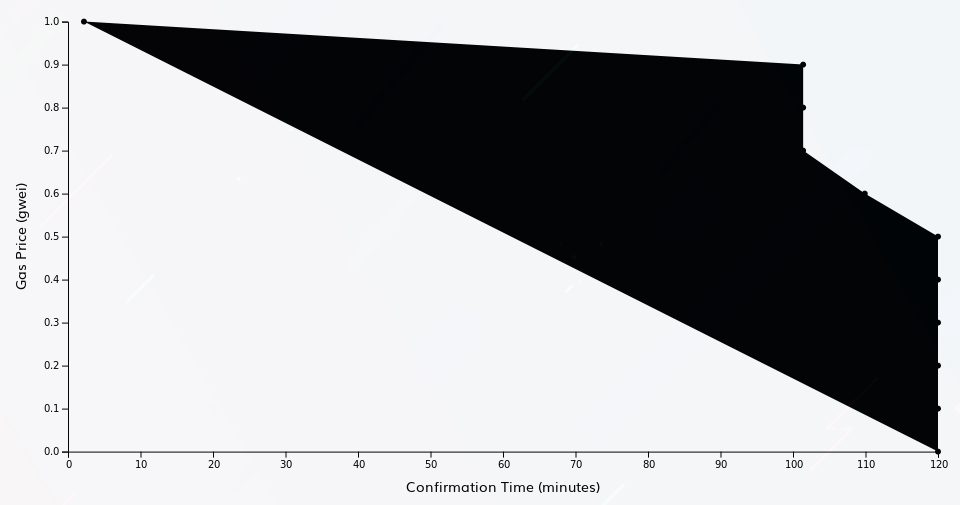
would something like this help? 90ca798c19a58b2fb8b47176739c269b99d0b4b9
owocki
on 9 Apr 2018
@owocki -- Any ideas about using this or working on top of it maybe? -- https://eswarasai.github.io/gasprice/
 eswarasai
on 10 Apr 2018
eswarasai
on 10 Apr 2018
i think that once your work goes into metamask (i think that is the goal, no?) we wont have any need for the gitcoin.co/gas page any longer
owocki
on 10 Apr 2018

I can read this graph much easier.
abitrolly
on 10 Apr 2018
@abitrolly I think that does help make it clearer. Would be great if the chart knew how to scale based on the data available. I do think it's helpful to have values on x and y axis for the points in between.
 PixelantDesign
on 10 Apr 2018
PixelantDesign
on 10 Apr 2018
Would be great if the chart knew how to scale based on the data available.
we can do this! in fact, its what https://github.com/gitcoinco/web/commit/90ca798c19a58b2fb8b47176739c269b99d0b4b9 was meant to do
owocki
on 10 Apr 2018
example of the above commit at work (gas chart scaling) https://gitcoin.co/gas
owocki
on 10 Apr 2018
Graph is strange on Firefox.
abitrolly
on 22 Apr 2018
@owocki you played around but never commit this, no? :-)
 kuhnchris
on 1 Aug 2019
kuhnchris
on 1 Aug 2019
Related issues
 jasonrhaas
·
4Comments
thelostone-mc
·
4Comments
jasonrhaas
·
4Comments
thelostone-mc
·
4Comments
 NukeManDan
·
3Comments
NukeManDan
·
3Comments
 uluhonolulu
·
3Comments
uluhonolulu
·
3Comments
 Skyge
·
3Comments
Skyge
·
3Comments