Wavesurfer.js: New Graphing Plugin
Hi all,
I think I'm going to be writing a new graphing plugin for Wavesurfer next week and wanted to give you all a heads up to see if it's something you'd be interested in adding to the project. If so, I can make a pull request when I'm all done. Also, I wanted to make sure I'm not redoing work someone else has already done and also check that what I want to do makes sense and is doable as a plugin in the first place.
I need to be able to overlay various styles of line graph overtop of the regular audio waveform. I'm going to be graphing various time-based analytics that are associated with the recording and want to support a couple different ways to graph them, as shown in the following mock-ups:
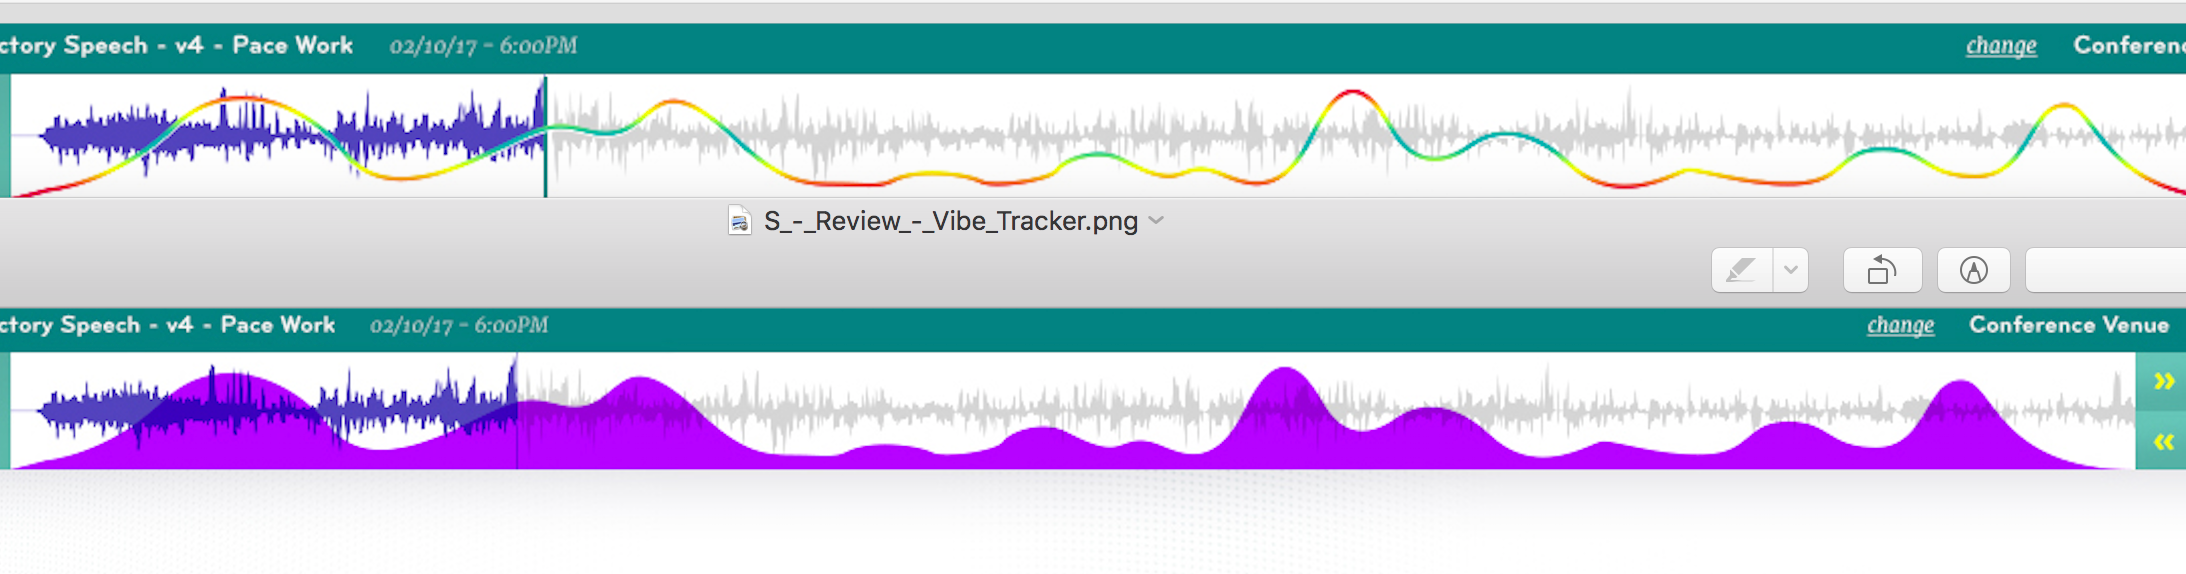
The first graph is a weird one -- it has an ideal range in the middle where the line is colored green then as the data gets further away from the ideal, either too high or too low, the line turns yellow and eventually red. The second graph style is essentially just a regular line graph but the area underneath is shaded. I expect I'll also need to add a legend and a scale on the left.
I took a look at the Regions plugin, which seems like a good starting point for me. I intend to start with that plugin and then just replace the "regions" with a variety of graphing options that are drawn on the canvas.
I'm probably starting this tomorrow so if anyone has any advice or feedback, please let me know. I'll follow up again when I've made progress and maybe this will end up being useful to others.
 DrLongGhost
All 11 comments
Looks nice! Does this line represent the pitch contour?
 katspaugh
on 20 Nov 2017
katspaugh
on 20 Nov 2017
Pitch is a good example of what it can be used for. The plugin will only have the logic to draw the graph, not calculate anything, so you'll need to feed it the coordinates of what it is you want graphed. If someone wanted to graph pitch in a recording, they would need to write their own code to extract the pitch values but they could then feed those values into the new plugin to render a graph.
I'm starting on it right now, so we'll see how it goes.
DrLongGhost
on 20 Nov 2017
Awesome!
I recommend you also check out the multi canvas renderer to check out how you can split your rendering into multiple canvases (to be able to render overlays larger than the canvas maximum dimensions (different per browser) – when scrolling/zooming is enabled)
 mspae
on 20 Nov 2017
mspae
on 20 Nov 2017
Quick update... I started on this and realized it would likely be too time consuming to write my own graphing logic, so I decided to use http://www.chartjs.org/. I'm not sure if having ChartJS as an external dependency for the new plugin makes it less appealing/eligible for inclusion in Wavesurfer itself.
I have a very rough proof-of-concept that draws a ChartJS line graph inside a canvas element generated from my new plugin:

One interesting thing about this approach is it eliminates the need for the timeline plugin when using this, because ChartJS can also populate the time tick marks on the x-axis if desired.
Although I still have a lot of work ahead of me, the main part that I'm still unclear on is the impact of scrolling/zooming on this and, as @mspae noted, how I may need to split stuff out into multiple canvases. I think that's still the big unknown for me, but assuming I can work my way through supporting zooming, then all the rest should be easy.
DrLongGhost
on 22 Nov 2017
How about creating your own repository for this plugin and adding a link on our homepage?
katspaugh
on 22 Nov 2017
@katspaugh -- I'll definitely host it myself if you don't think it's a good fit for Wavesurfer.
Ugh.. I figured out what @mspae meant by spanning multiple canvas elements. Unfortunately, I think this will be prohibitively difficult for me. In my screenshot above, to seamlessly split the graph into 2 canvas elements at the cursor point would entail:
- Render 2 graphs -- the first with data points 1 - 6 and the second with data points 5 - 9. You need the overlap of the last data point to ensure the intersected curve renders and matches in both graph fragments.
- I'd then need to clip the end of the first graph and the beginning of the second, since overlapping the 2 might make a visible stripe due to the canvases being transparent. This means I can't simply place the canvases side by side but would need each canvas inside its own container so I could clip them.
So I might simply roll the dice and accept the graph breaking if you zoom in too close. I assume it would simply disappear at that point then reappear when you zoom back out. If I can make it work that way, I'll probably just roll with that for now.
I'm working my way through supporting zooming with a single canvas now. Trying to figure out the best way to get the new, wider width when you zoom in.
DrLongGhost
on 22 Nov 2017
@DrLongGhost any news? looks cool.
 thijstriemstra
on 24 Jan 2018
thijstriemstra
on 24 Jan 2018
@DrLongGhost is there any good news? I'm looking forward to your plugin.
 quanengineering
on 24 Dec 2018
quanengineering
on 24 Dec 2018
Unfortunately, while I did get the plugin working, I'm not in a position anymore to release the code. Sorry. I'll go ahead and close the ticket but will reopen if anything changes.
DrLongGhost
on 2 Jan 2019
Thanks @DrLongGhost. Amazing!!!
Can I see know the branch that contains your work? I want to use that plugin even it hasn't released yet.
quanengineering
on 7 Jan 2019
@toolowner - Unfortunately I can't release the code, which I feel badly about. I can offer up the following though:
- It should only take a day or so to reproduce. It's a simple plug-in written in a style similar to the regions plugin but it simply overlays Chart.js
- See https://github.com/chartjs/Chart.js/issues/4997 for some advice I got from that project around removing the margins
That's really all I can say.
DrLongGhost
on 7 Jan 2019
Related issues
 frumbert
·
4Comments
frumbert
·
4Comments
 matixmatix
·
5Comments
thijstriemstra
·
5Comments
matixmatix
·
5Comments
thijstriemstra
·
5Comments
 ghost
·
6Comments
ghost
·
6Comments
 Mamadou99
·
3Comments
Mamadou99
·
3Comments
Most helpful comment
Pitch is a good example of what it can be used for. The plugin will only have the logic to draw the graph, not calculate anything, so you'll need to feed it the coordinates of what it is you want graphed. If someone wanted to graph pitch in a recording, they would need to write their own code to extract the pitch values but they could then feed those values into the new plugin to render a graph.
I'm starting on it right now, so we'll see how it goes.