Wasmtime: Debug a wasm application with reasonable amount of RAM
I'm trying to run a large (~15 MB) wasm application that crashes on ud2. Is there any way to determine which function the crash address corresponds to?
 whitequark
All 28 comments
Run wasmtime in a debugger and pass -d to wasmtime to generate debuginfo for the debugger.
Edit: it is actually -g. -d just prints extra debug messages to stdout.
 bjorn3
on 11 Nov 2019
bjorn3
on 11 Nov 2019
I'm doing that (gdb --args wasmtime -g foo.wasm) and it changes absolutely nothing.
whitequark
on 11 Nov 2019
Ugh that's annoying, sorry!
Is there any way you could give us a way to reproduce the crash? Ideally based on source code, but a Wasm binary would be great, too.
 tschneidereit
on 11 Nov 2019
tschneidereit
on 11 Nov 2019
I'm not actually sure if the crash is caused by a bug in wasmtime, but sure. This issue has complete build instructions. The non-stripped binary wasm files are around 300 MB, which is a bit of a pain, so if you're willing to build from source, that seems ideal. Running the resulting wasm file through binaryen wasm-opt results in a different, even more exciting crash involving __cxa_guard_acquire.
whitequark
on 11 Nov 2019
Oh yeah and here are inputs for Yosys. You can either use picorv32.v like in the issue, or boneless.il to get a different, potentially more interesting crash as it exercises different code paths.
whitequark
on 11 Nov 2019
Semi-offtopic: my end goal for this project would be to use wasm2obj (or maybe lucetc or another equivalent tool) to produce self-contained binaries for many platforms (x86 Windows, x86 and ARM Linux, x86 macOS, to start with) using a single wasm artifact and ideally nothing more than cargo/rustup (although it seems likely that I'll need per-platform binutils at least).
It looks like none of the WASI runtimes are currently up to task, but I'll be happy to do the work required to make this happen, provided that I can actually run the software I need of course...
whitequark
on 11 Nov 2019
If I build wasmtime from master, it crashes here, which I can probably fix myself.
whitequark
on 11 Nov 2019
OK, https://github.com/CraneStation/wasmtime/pull/538 fixes the crash, but I still don't get any debug info in gdb.
whitequark
on 11 Nov 2019
I still don't get any debug info in gdb.
Can you try in lldb? Emitting DWARF debug info is tricky, because what's there in terms of a specification is really more a rough estimate for more corner-case-y aspects :( gdb is more discerning in its tastest than lldb in some situations, so we're not quite there yet for making it work as well.
@yurydelendik that's still the situation, right?
tschneidereit
on 11 Nov 2019
@tschneidereit OK so it looks like debug info works in lldb. I'm saying "looks like" because
there is (uninformative) debug info for stripped wasm binaries, but unfortunately right now the transform is so slow as to be impractical for non-stripped binaries. I've spent 10 minutes so far waiting for a non-stripped binary to be transformed. Is there perhaps a way to only transform line number info? Even just function names would greatly help.
whitequark
on 11 Nov 2019
Is there perhaps a way to only transform line number info? Even just function names would greatly help.
I don't think there is, but that sounds like a good idea! It also sounds like we have some optimization potential :) In fact, I wonder if it might be possible to lazify some of the transformation. @yurydelendik, do you think that's a possibility?
tschneidereit
on 11 Nov 2019
Running the resulting wasm file through binaryen wasm-opt results in a different,
Running wasm-opt invalidates DWARF information at this moment, see https://github.com/WebAssembly/binaryen/issues/2400
538 fixes the crash
Thank you!
but I still don't get any debug info in gdb.
gdb is more discerning in its tastest than lldb in some situations,
I did not spent much time with GDB, but found that JIT debugging involves creating of "perfect" ELF image to be use with GDB JIT interface. At this moment only LLDB was tested with wasmtime -g.
but unfortunately right now the transform is so slow as to be impractical for non-stripped binaries
Eventually, I would like to profile the performance of for large binaries/DWARF sections; the debug/non-release wasmtime takes even more time. Are you using release version of wasmtime?
Is there perhaps a way to only transform line number info?
Normally .debug_line and .debug_info transforms take the same time, so speed up will be at best a half of the time.
If DWARF sections are missing, wasmtime generate artificial wasm-level debug information by using name section. This might help with finding the problem.
 yurydelendik
on 11 Nov 2019
yurydelendik
on 11 Nov 2019
Are you using release version of wasmtime?
Yes.
Eventually, I would like to profile the performance of for large binaries/DWARF sections
I profiled it, running my testcase for 10 minutes. 84% of the total time is spent in append_vmctx_info, and ultimately in ValueLabelRangesBuilder::process_label.
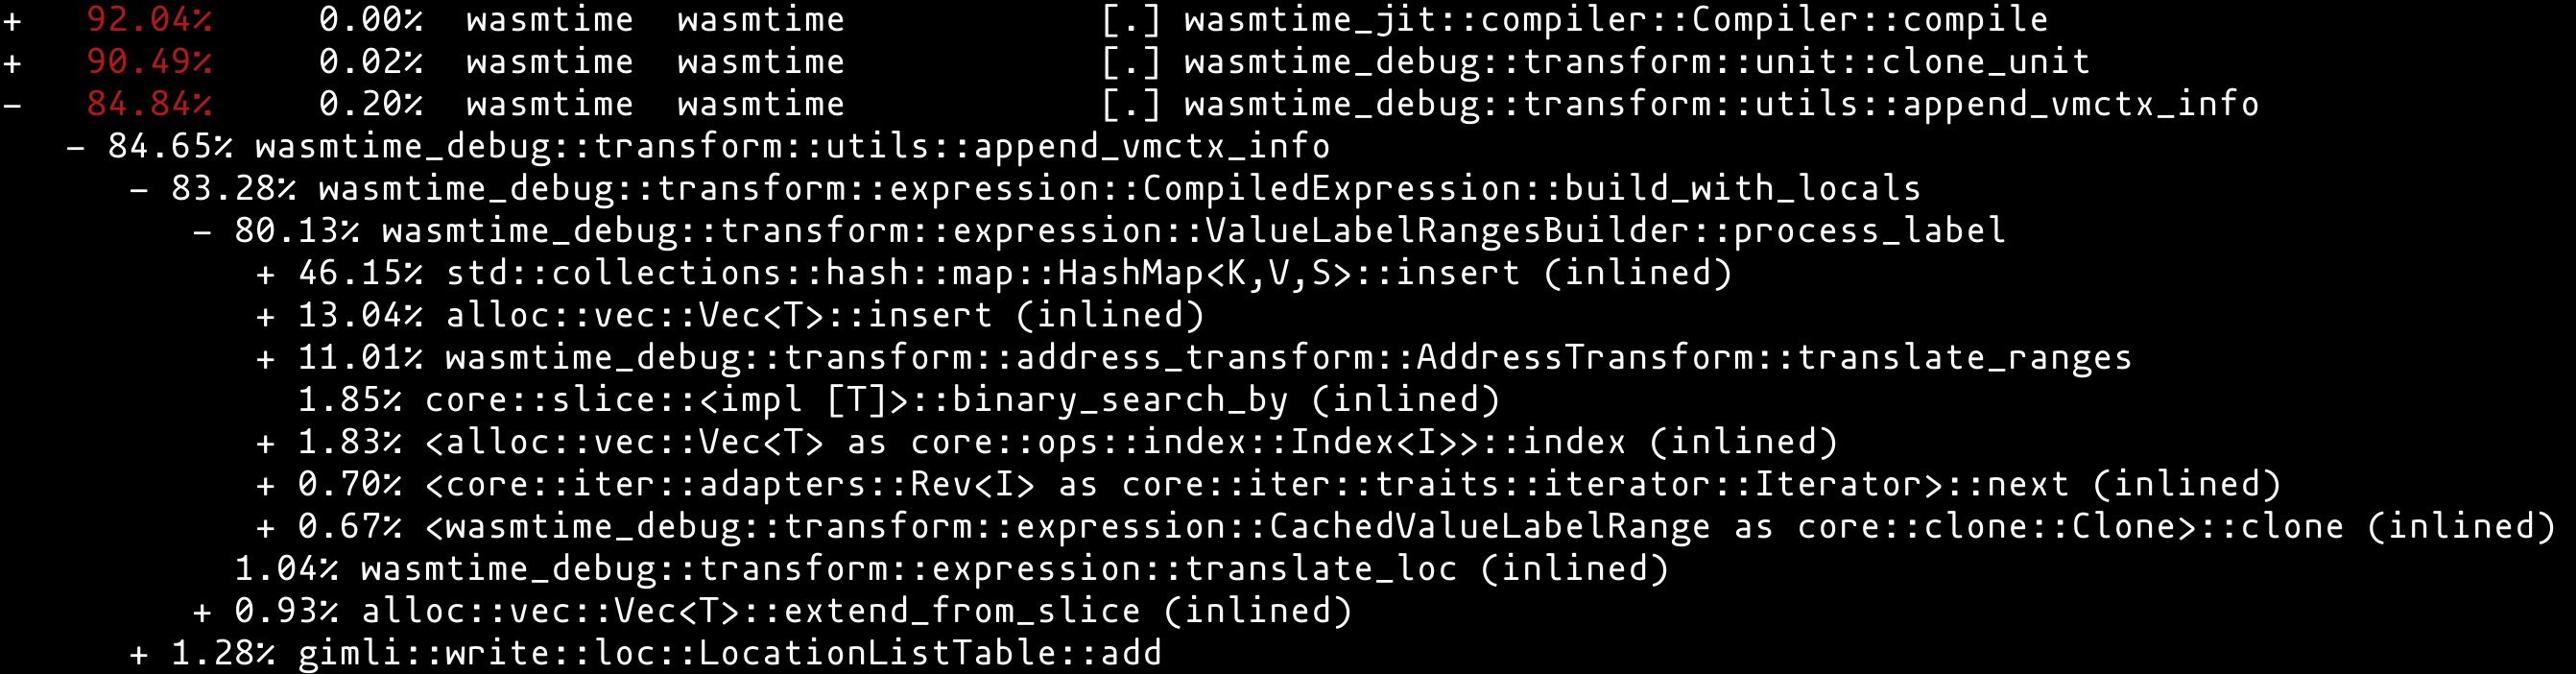
I tried to fix it but unfortunately that part of the code is very hard to understand and almost completely undocumented and I got nowhere after spending a few hours on it.
whitequark
on 11 Nov 2019
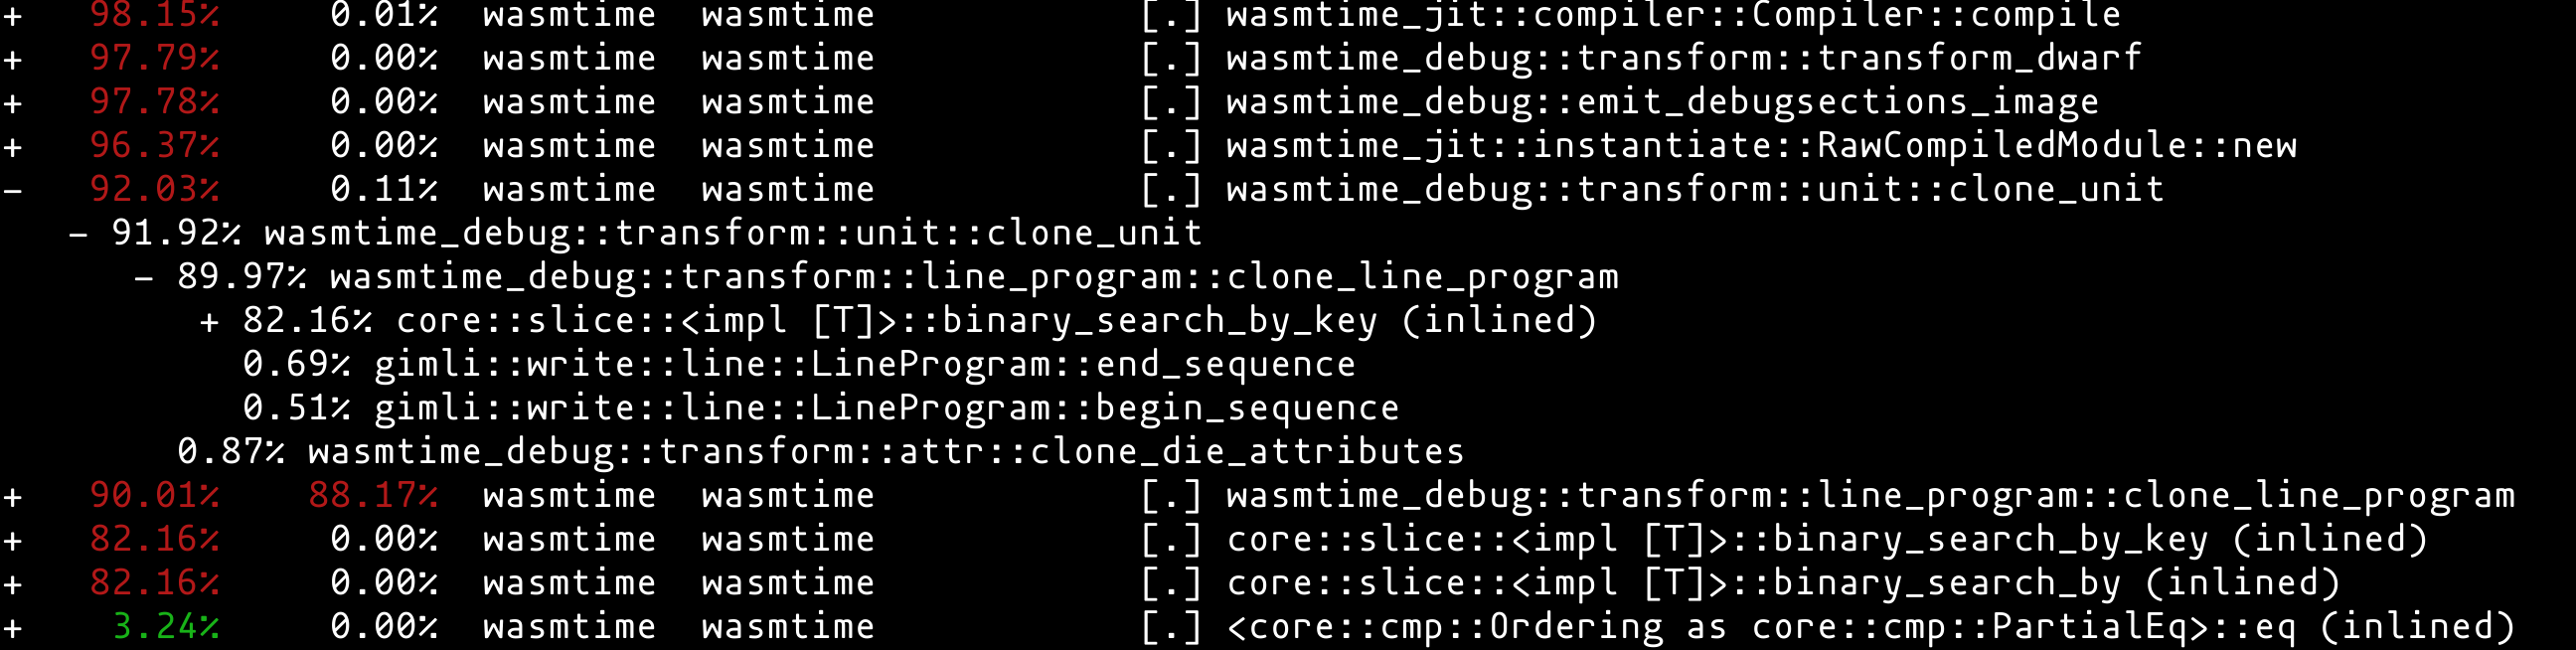
If I terminate wasmtime after it transforms the debug info, then 90% of the total time (about 3m40s!) is spent in clone_line_program.
whitequark
on 11 Nov 2019
Actually, the previous comment isn't right. I accidentally ran wasmtime on a wasm file that I ran through binaryen's wasm-opt, which indeed had debug information that lldb loaded, and which indeed made no sense. If I run wasmtime on a wasm file with non-corrupted debug information, it consumes more than 12 GB of memory after 10 minutes, spent almost entirely in clone_line_program, and I don't really know if it will ever finish because my machine grinds to a halt due to memory pressure.
whitequark
on 11 Nov 2019
Is there perhaps a way to only transform line number info?
spent almost entirely in clone_line_program
That .debug_line table, which is line numbers info. I'll be looking into using different data structures.
ran wasmtime on a wasm file that I ran through binaryen's wasm-opt
Did you try to ran wasmtime on a wasm file, with stripped DWARF sections but with -g flag?
yurydelendik
on 11 Nov 2019
Did you try to ran wasmtime on a wasm file, with stripped DWARF sections but with
-gflag?
Specifically the file that I ran through wasm-opt, or any of them? I did run wasmtime on stripped wasm files with the -g flag and I could see backtraces in lldb. However, they aren't actually useful for figuring out what went wrong because this is a large application and an obscure bug.
whitequark
on 11 Nov 2019
it consumes more than 12 GB of memory after 10 minutes
By observing perf top and htop, it looks like cranelift consumes about 8 GB of that (which rules out using wasmtime as a JIT for my use case, including unfortunately the Python packages; I'll probably look into improving wasmtime as AOT) and then 4+ GB on top is consumed by the debug info conversion process.
whitequark
on 11 Nov 2019
Specifically the file that I ran through wasm-opt, or any of them?
Any. The wasmtime, if DWARF sections are not found, emits JIT image with DWARF anyway but using wasm bytecode/function as "sources", so you may get wasm-y stack, which is one step better than native back trace.
yurydelendik
on 11 Nov 2019
it looks like cranelift consumes about 8 GB of that (which rules out using wasmtime as a JIT for my use case, including unfortunately the Python packages
Is this with debug info, and with using -g? We should of course improve memory usage for that usage, but more importantly, we should have much better memory usage for release use.
tschneidereit
on 11 Nov 2019
so you may get wasm-y stack, which is one step better than native back trace.
Yes, I got a bunch of wasm-function-\d+ or something like that.
Is this with debug info, and with using
-g?
Yes and yes. Without -g it looks like memory usage tops out at about 1 GB.
whitequark
on 11 Nov 2019
@whitequark I'm trying to improve the performance of wasmtime-debug crate. I would like to check if the your test case performance was improved (e.g. via https://github.com/bytecodealliance/wasmtime/pull/1260) .
Is there something else needs to be done to resolve this issue?
yurydelendik
on 11 Mar 2020
Is there something else needs to be done to resolve this issue?
If it's actually possible to debug the application I mentioned earlier on a machine with reasonable amount of RAM (~8 GB) then this issue can be certainly closed.
whitequark
on 11 Mar 2020
If it's actually possible to debug the application I mentioned earlier on a machine with reasonable amount of RAM (~8 GB) then this issue can be certainly closed.
If possible, can you provide the detailed instructions for me to reproduce the issue locally? (I have a hard time to gather this info from the comments above)
yurydelendik
on 11 Mar 2020
@yurydelendik Are the build instructions here sufficient?
whitequark
on 11 Mar 2020
@whitequark it was not trivial but I was able to produce "yosys.wasm".
I added another commit to #1260. With this PR, per Activity Monitor and Instruments on my computer, the DWARF transform does not take more than 50 sec and memory is not growing past 2.4Gb. If you have time, can you confirm that it is the case on your side?
yurydelendik
on 11 Mar 2020
I greatly appreciate your work here. Unfortunately right now I'm not in a position to reproduce those results for personal reasons. The numbers you mention seem like they would allow me to proceed with my original work on wasm-ing Yosys; I won't get around to that for a while, so I'm closing the issue, because it seems like you've pretty much solved it. I'll make sure to report my results once I get around to it.
whitequark
on 15 Mar 2020
@yurydelendik I just got around reproducing these results. Unfortunately, it seems that I hit a snag; on freshly compiled Yosys with WASI SDK 10, I get this if I pass -g after something like a minute of high CPU load:
Error: failed to run main module `yosys.wasm`

Caused by:
    0: Debug information error
    1: Hit the end of input before it was expected
Here's the problematic wasm file.
However, I'd like to say that even if you never fix this, y'all are still totally awesome. That's because I don't need debug information anymore! Almost everything in Yosys (except for a bizarre argv-related bug I have no idea what to make of) that I tested so far not only works perfectly well, but also with amazingly low startup latency and incredible speed.
whitequark
on 25 Apr 2020
Related issues
 alexcrichton
·
5Comments
alexcrichton
·
5Comments
 itowlson
·
5Comments
itowlson
·
5Comments
 rrichardson
·
5Comments
rrichardson
·
5Comments
 moderation
·
4Comments
moderation
·
4Comments
 abbec
·
4Comments
abbec
·
4Comments