Vue-storefront: Sever Memory Leak Issues on Production
Current behavior
1. Images — only requests to image resources
Very high cpu and memory usage when requesting images to the server, it manages to serve 239 req/s and response time skyrockets to 2000ms.
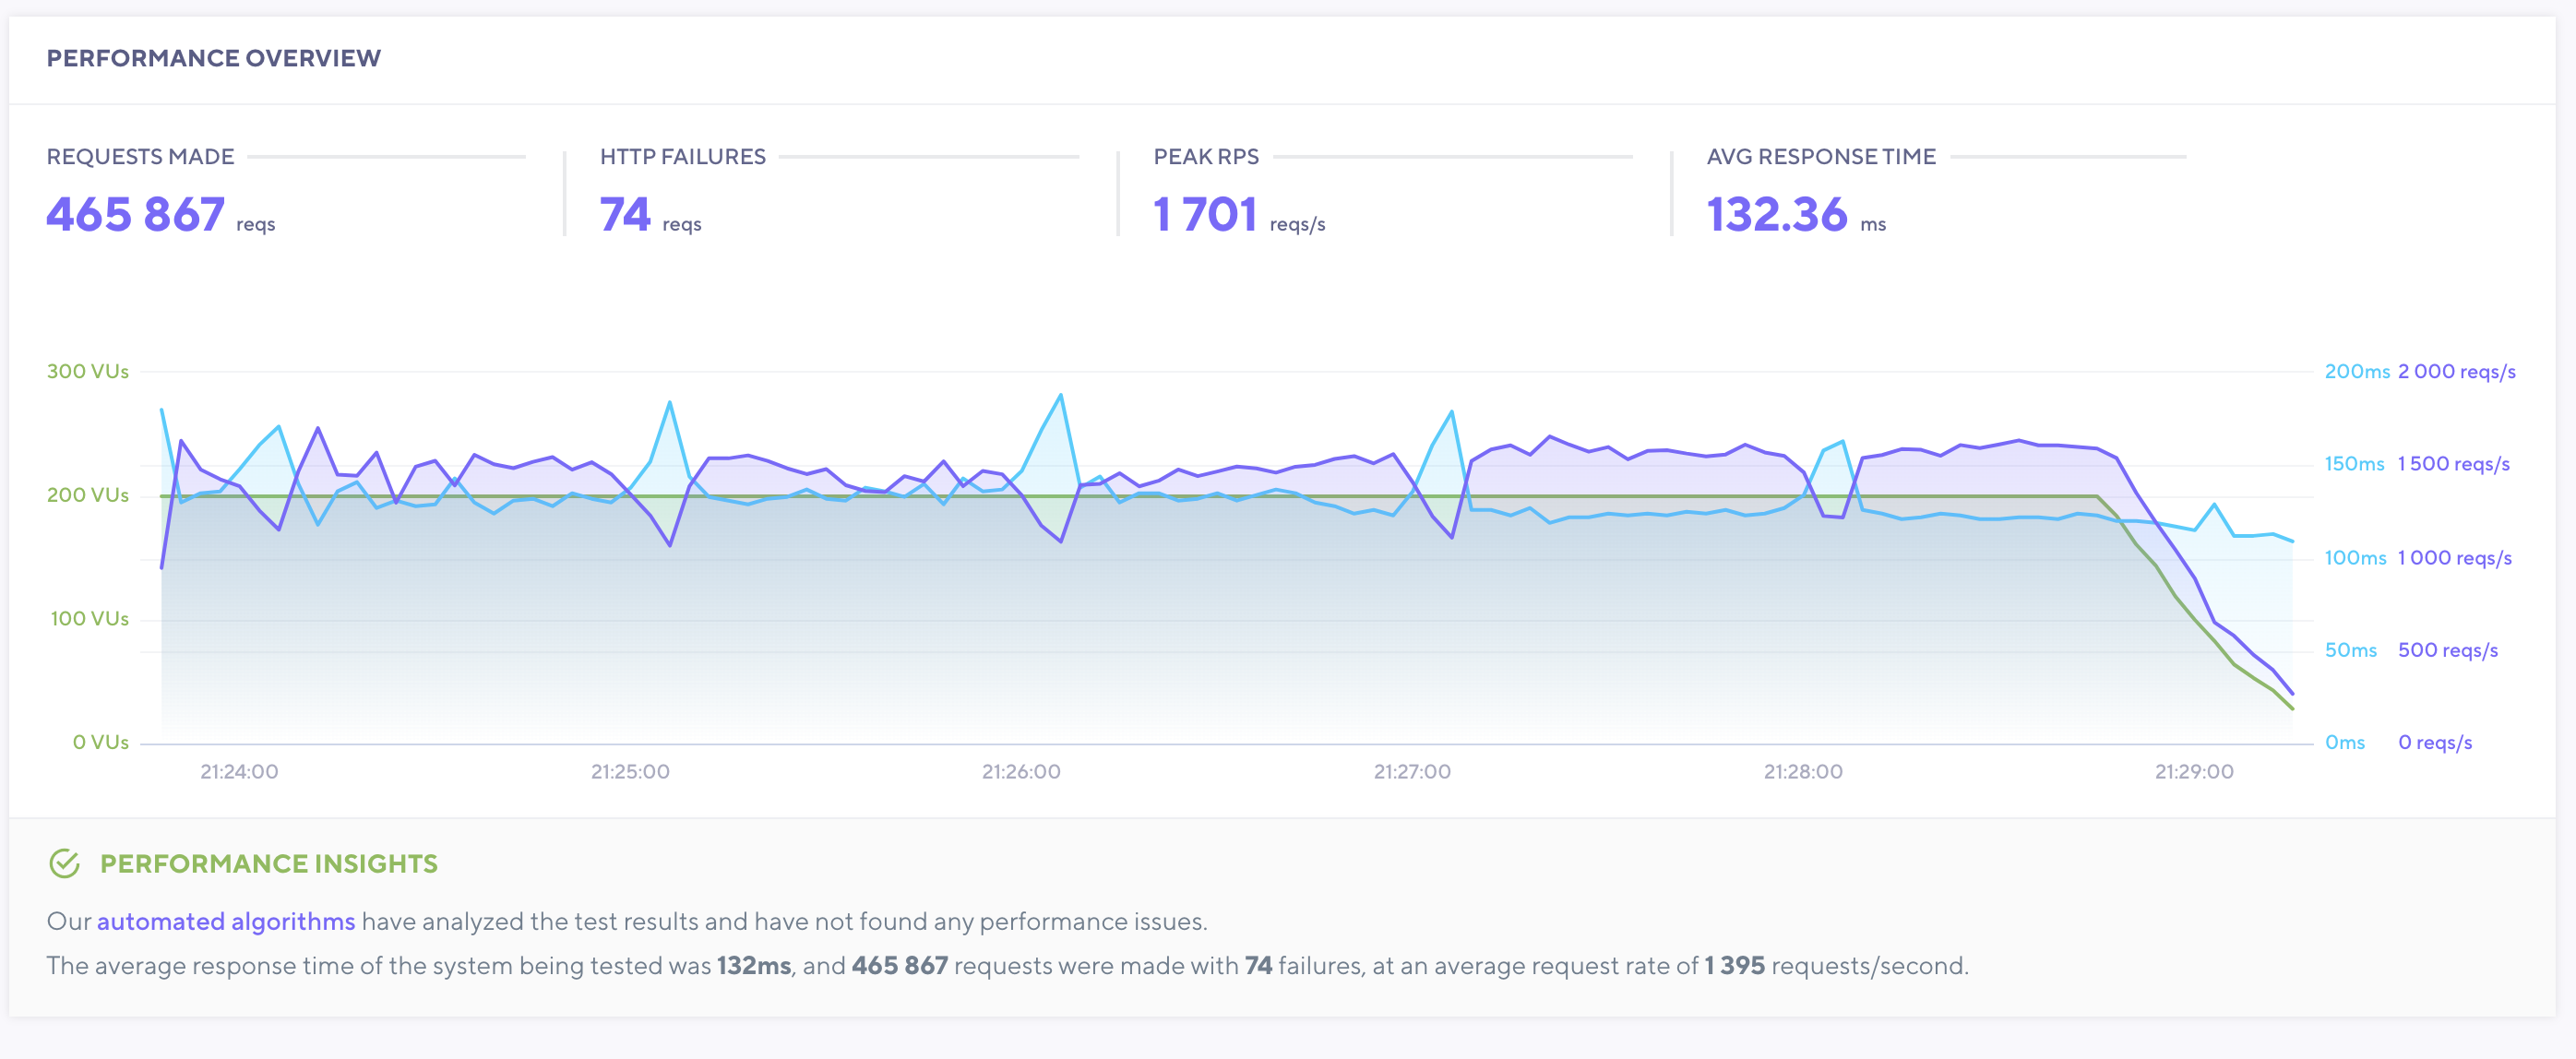
2. PWA — only requests to urls
This test only made requests to urls like /es or /modelo-mahou-bears.html?color=azul. Basically homepage, category views and product views very high cpu and memory usage and server struggles to serve a very low number of requests. Response time of curl to homepage url is about 2.3s after clearing cache and about 0.7s with cache hit.
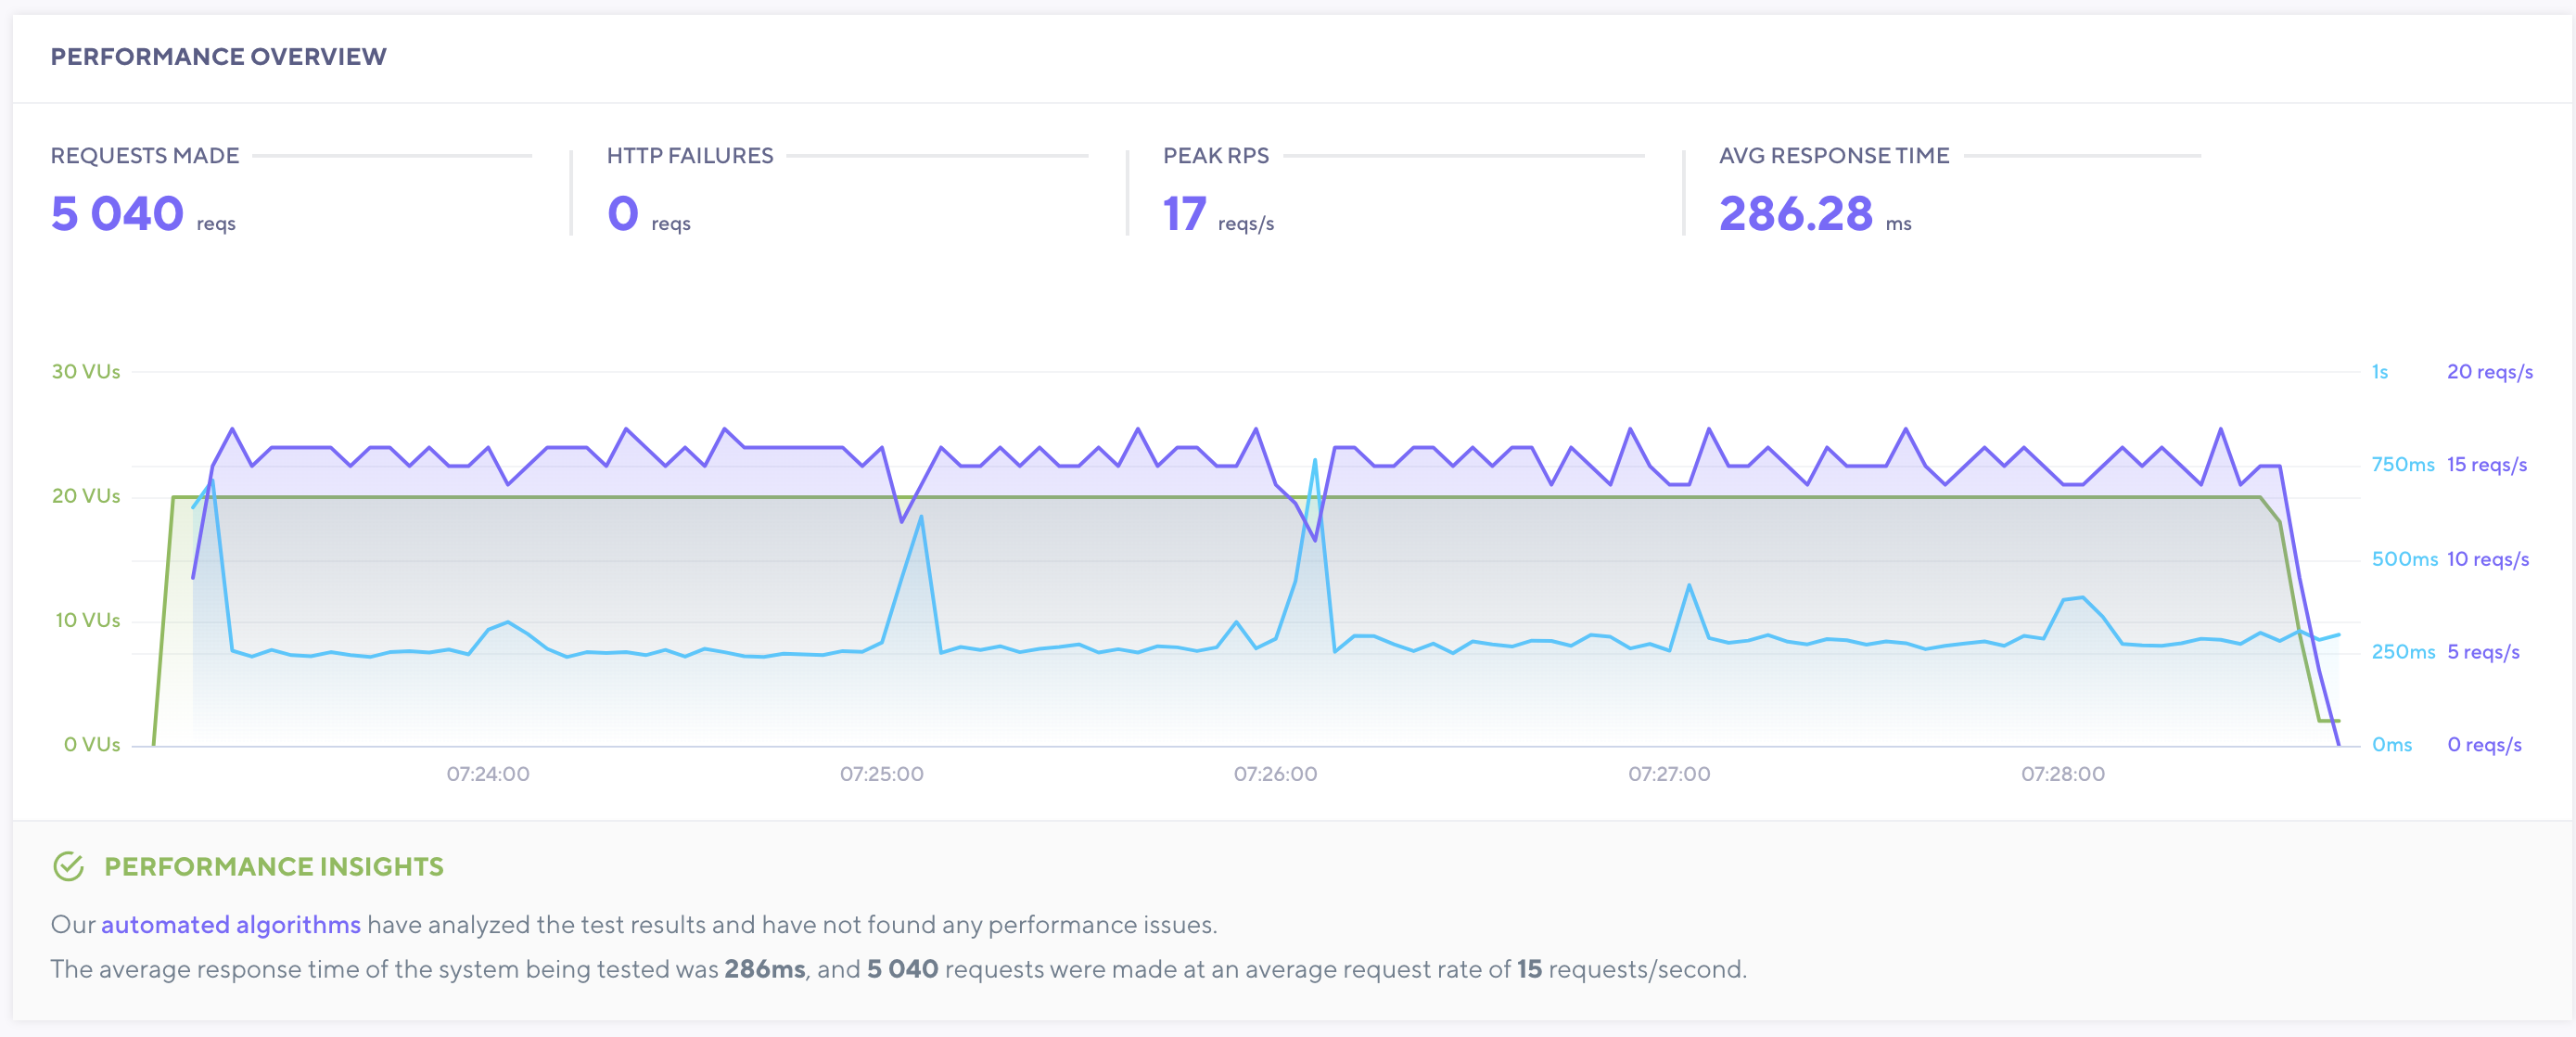
First test was made with 20 Virtual users, and the server just managed to cope with the traffic. Server managed to serve 17req/s with an average res. time of 286.28ms
Second test was made with 50 virtual users and server was struggling and finally run out of resources.
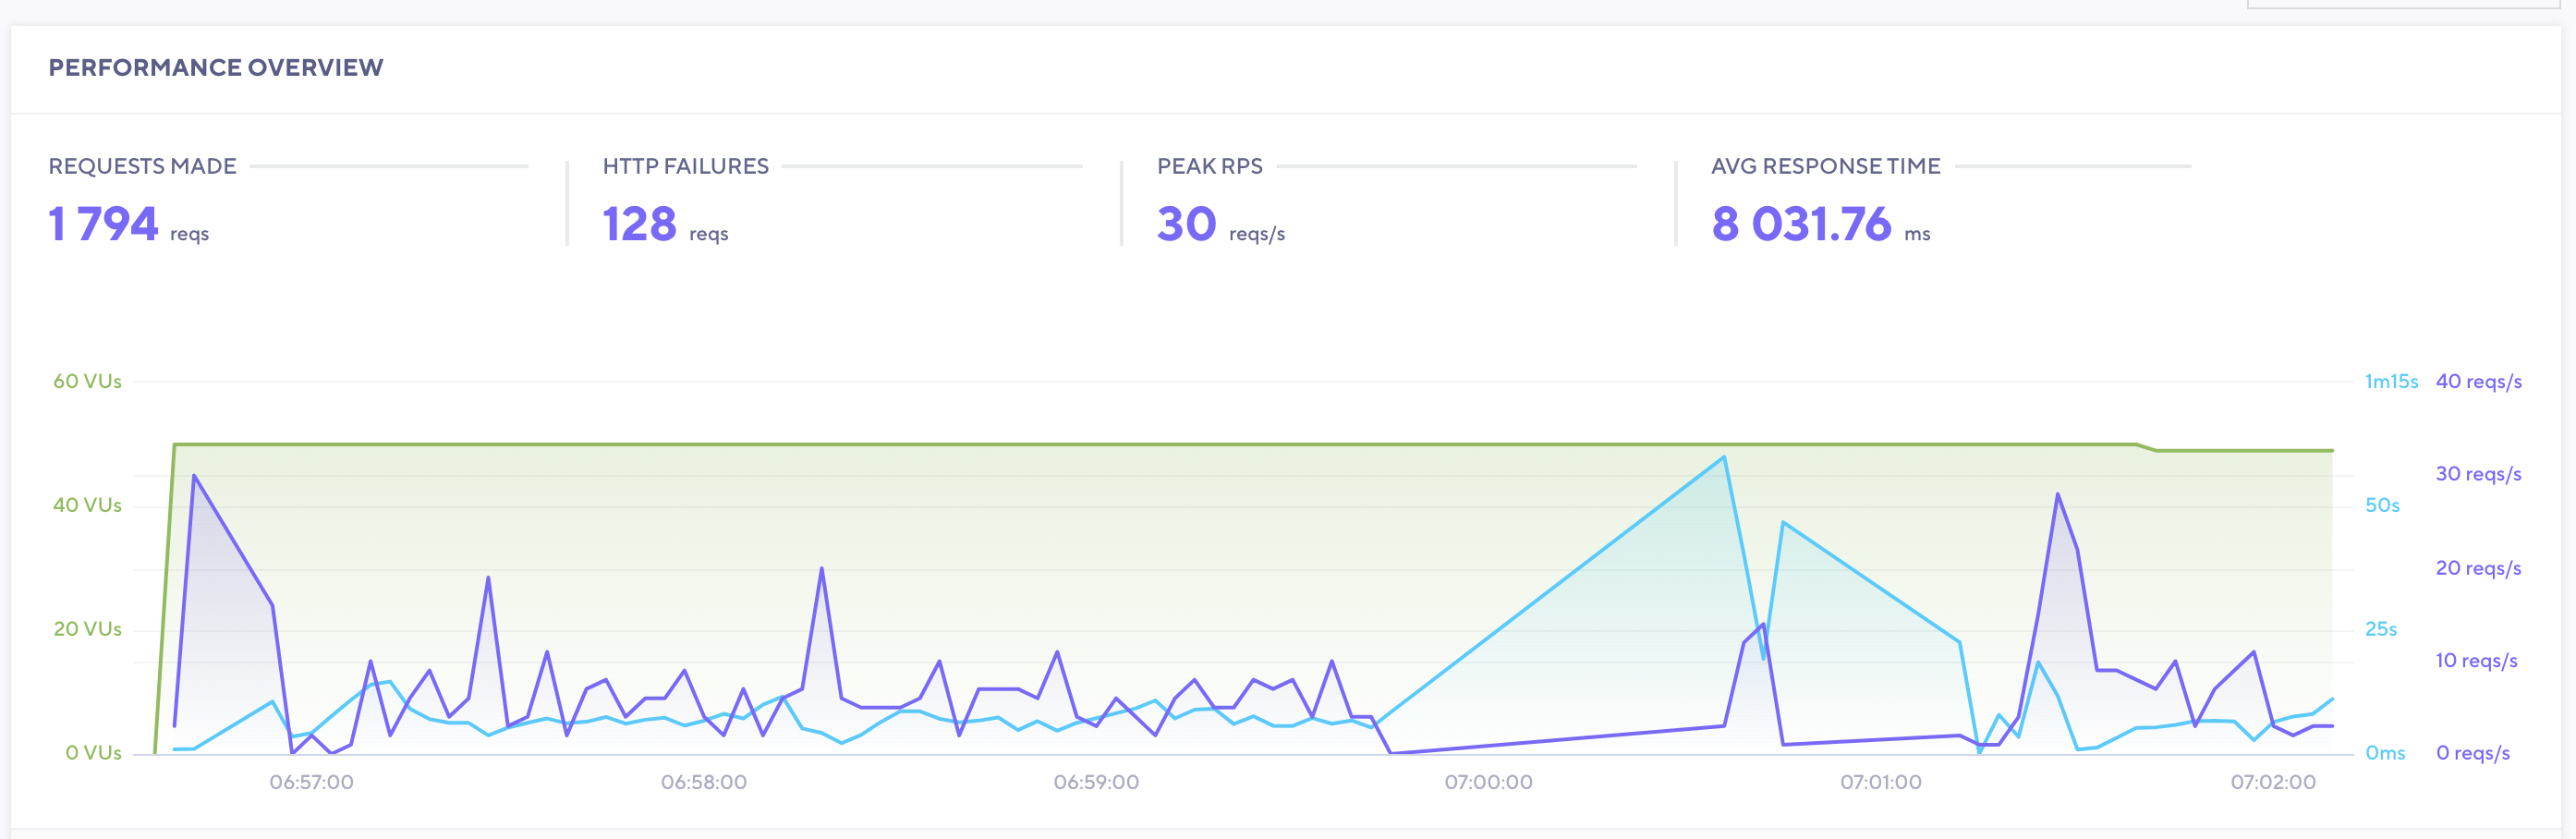
Also, memory is leaking as node processes increase in memory usage with each request (to 1-1.5GB quickly). This was initially causing our servers to run out of memory and restart
We have mitigated this by configuration in our process manager (Phusion Passenger), by setting up the min and max node processes and also using the passenger_max_requests which shuts down processes when they reach X number of requests, which we have configured to 2000 requests/process.
This has prevented servers running out of memory and now usage is stable as processes are continuously recycled. However, we know this is a workaround and we should find the source of the memory leak/s.
This is 2 tests compared — 1 with 30 Virtual Users and another with 100 Virtual Users
Expected behavior
We'd expect the PWA to perform as described here https://medium.com/the-vue-storefront-journal/vue-storefront-performance-tests-and-architecture-ready-for-traffic-peaks-279c4c783412
Steps to reproduce the issue
We used http://k6.io/ for stress tests.
Repository
Can you handle fixing this bug by yourself?
- [ ] YES
- [x] NO
Which Release Cycle state this refers to? Info for developer.
Pick one option.
- [ ] This is a bug report for test version on https://test.storefrontcloud.io - In this case Developer should create branch from
developbranch and create Pull Request2. Feature / Improvementback todevelop. - [ ] This is a bug report for current Release Candidate version on https://next.storefrontcloud.io - In this case Developer should create branch from
releasebranch and create Pull Request3. Stabilisation fixback torelease. - [x] This is a bug report for current Stable version on https://demo.storefrontcloud.io and should be placed in next stable version hotfix - In this case Developer should create branch from
hotfixormasterbranch and create Pull Request4. Hotfixback tohotfix.
Environment details
- Browser: Irrelevant
- OS: Ubuntu
- Node: 10.x
- Code Version: 1.10
Staging server
Staging server where the tests above have been performed has 8 CPUs / 16GB RAM and it is used for M2 + VSF PWA + VSF API + ElasticSearch.
Production server
Similar tests have been done in production with only slightly better results.
W1/W2: 8 cpus + 12GB RAM — each in charge of pwa + vsf api + magento api

 allozaur
All 15 comments
Hi @allozaur. I'm not sure if this is a bug. The memory leaks usually came from the theme/custom modules and VSF1.10/1.11/1.12 don't have the known memory leaks in the default theme at the moment. Check the mixins and other features commonly known for making our life harder with the memory leaks, please.
Please make sure you're running a sufficient number of concurrent processes as Node.js is threadless and too heavy concurrent traffic can lead to deadlocks.
Another option is to use [Varnish Cache])(https://docs.vuestorefront.io/guide/cookbook/checklist.html#_17-vsf-cache-varnish), Fastly or OpenResty with LuaProxy with SSR cache enabled - for both VSF-API and VSF.
Then you might want to disable SSR at all (as it's the main reason for slow responses): https://github.com/DivanteLtd/vue-storefront/issues/4089
 pkarw
on 6 Jul 2020
pkarw
on 6 Jul 2020
Hi all, I am from the Jimmy Lion team. First of all thanks for your help!
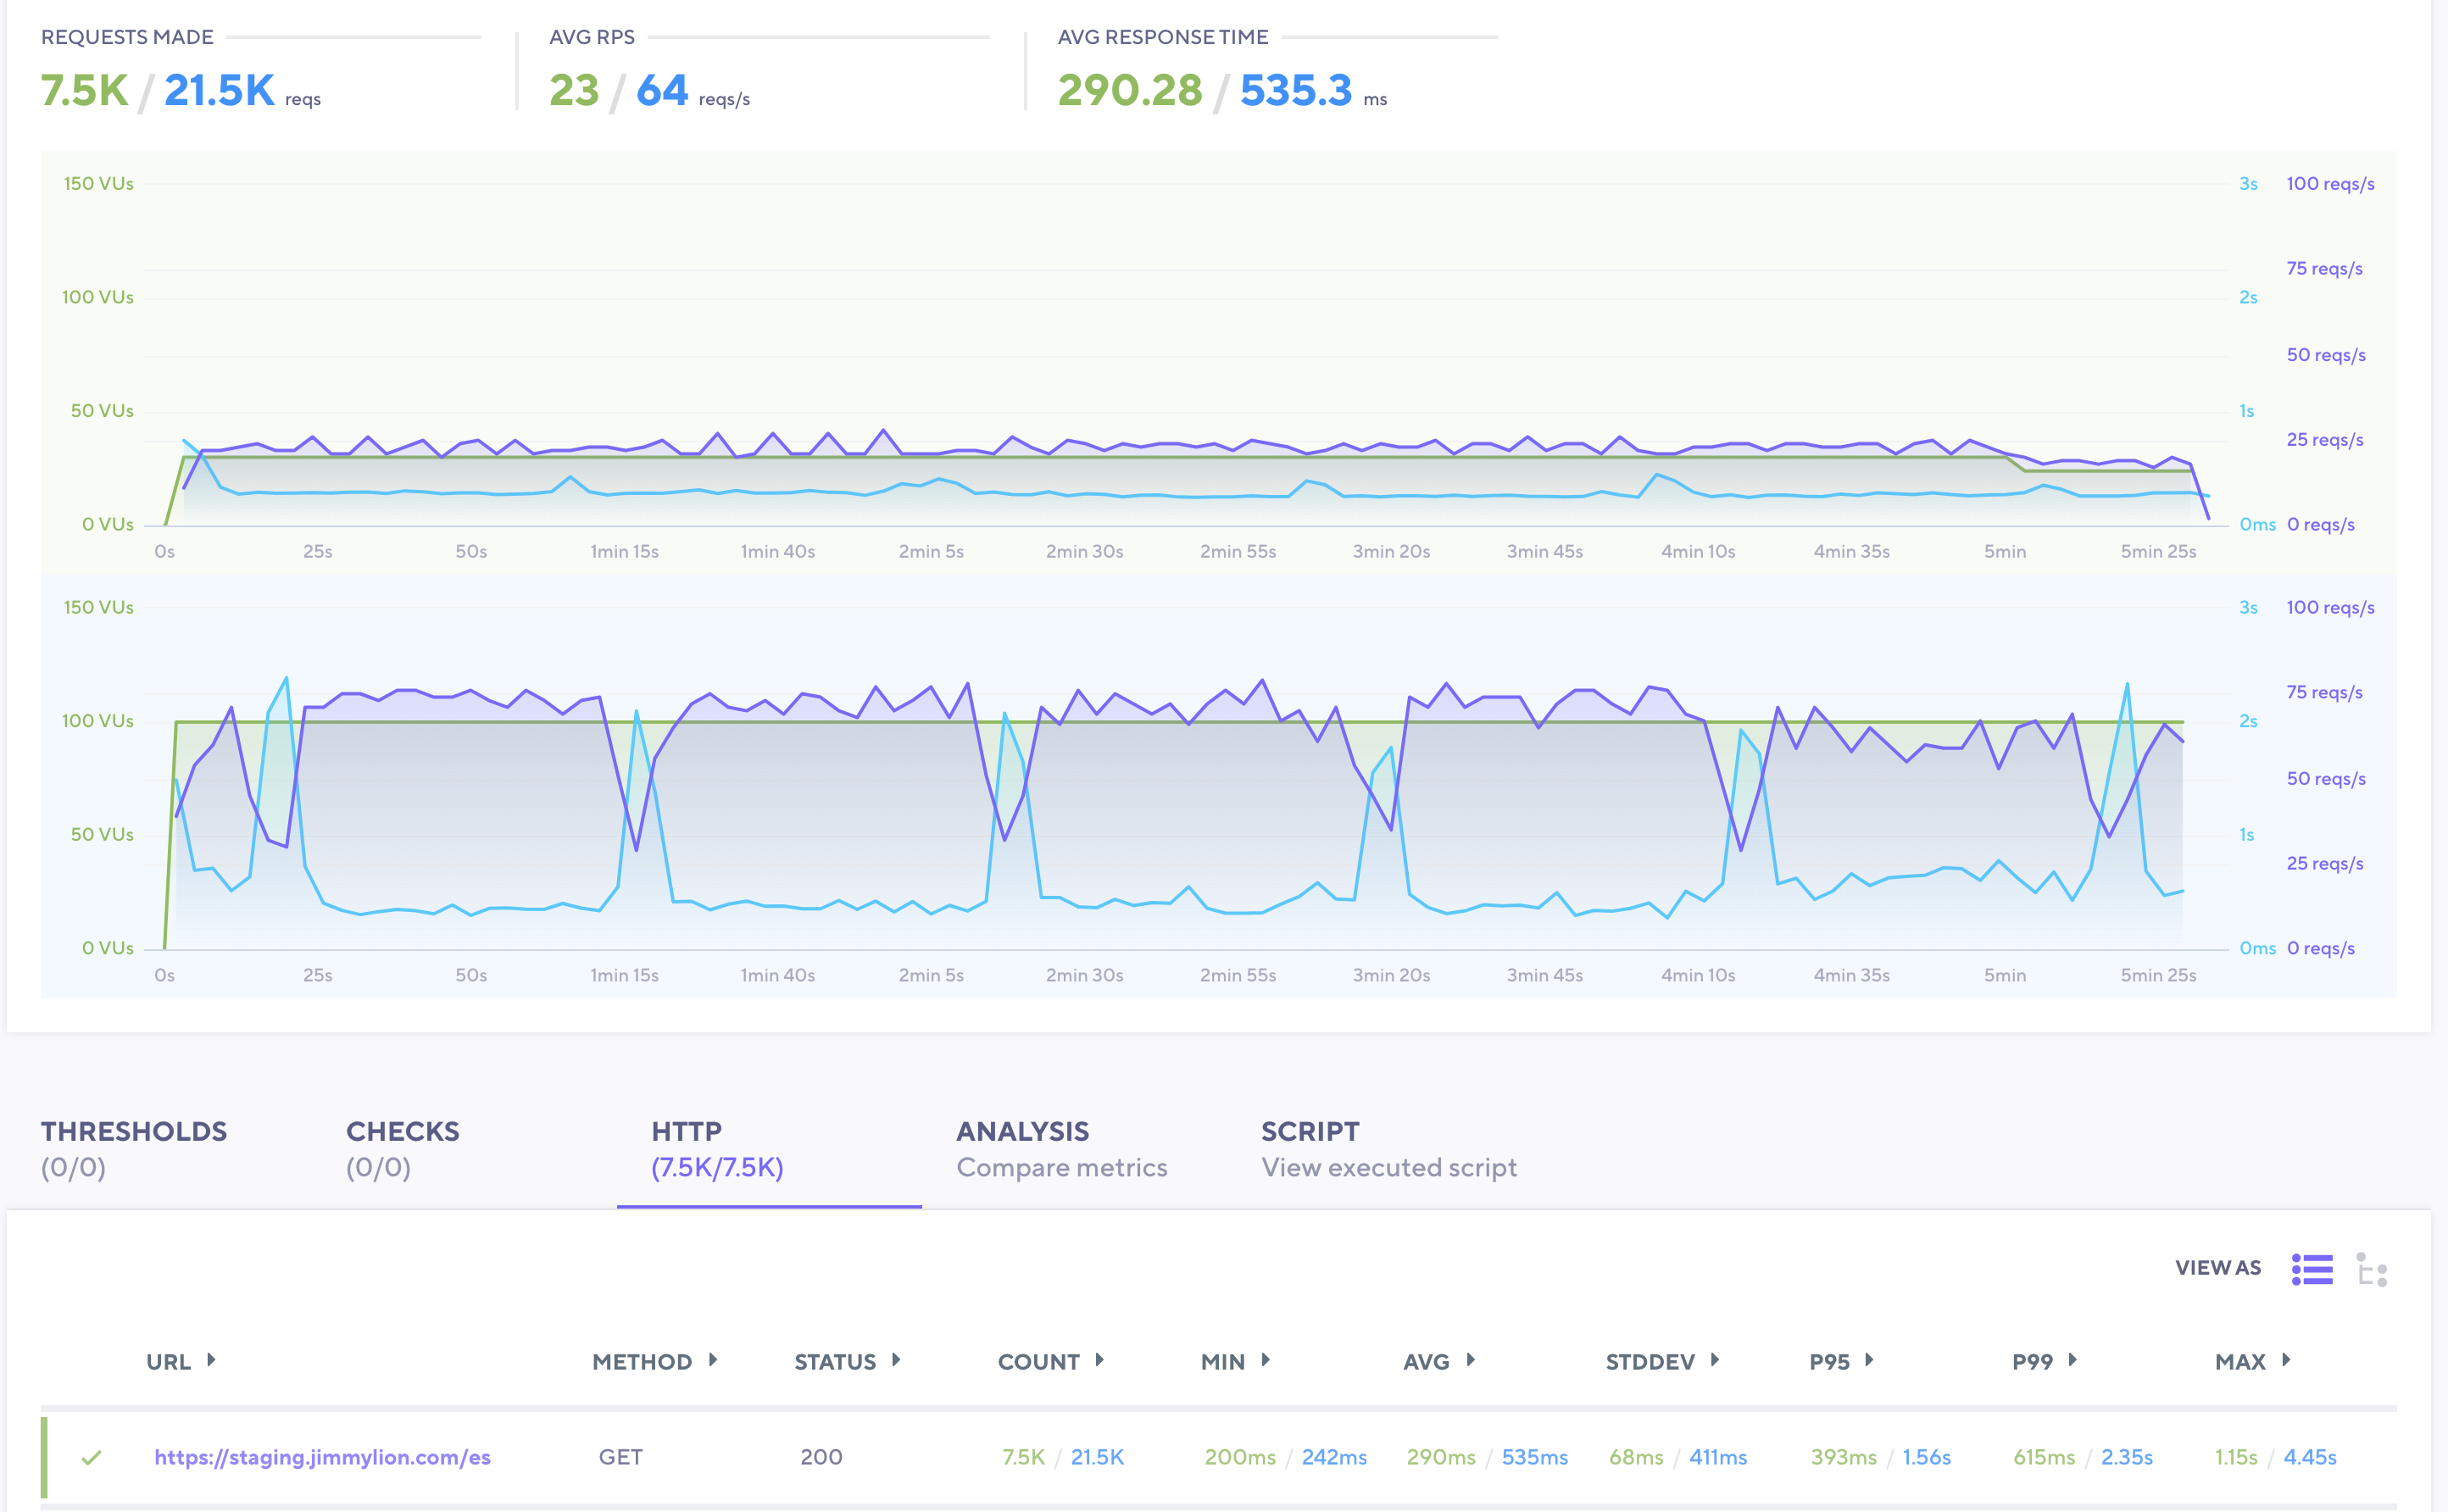
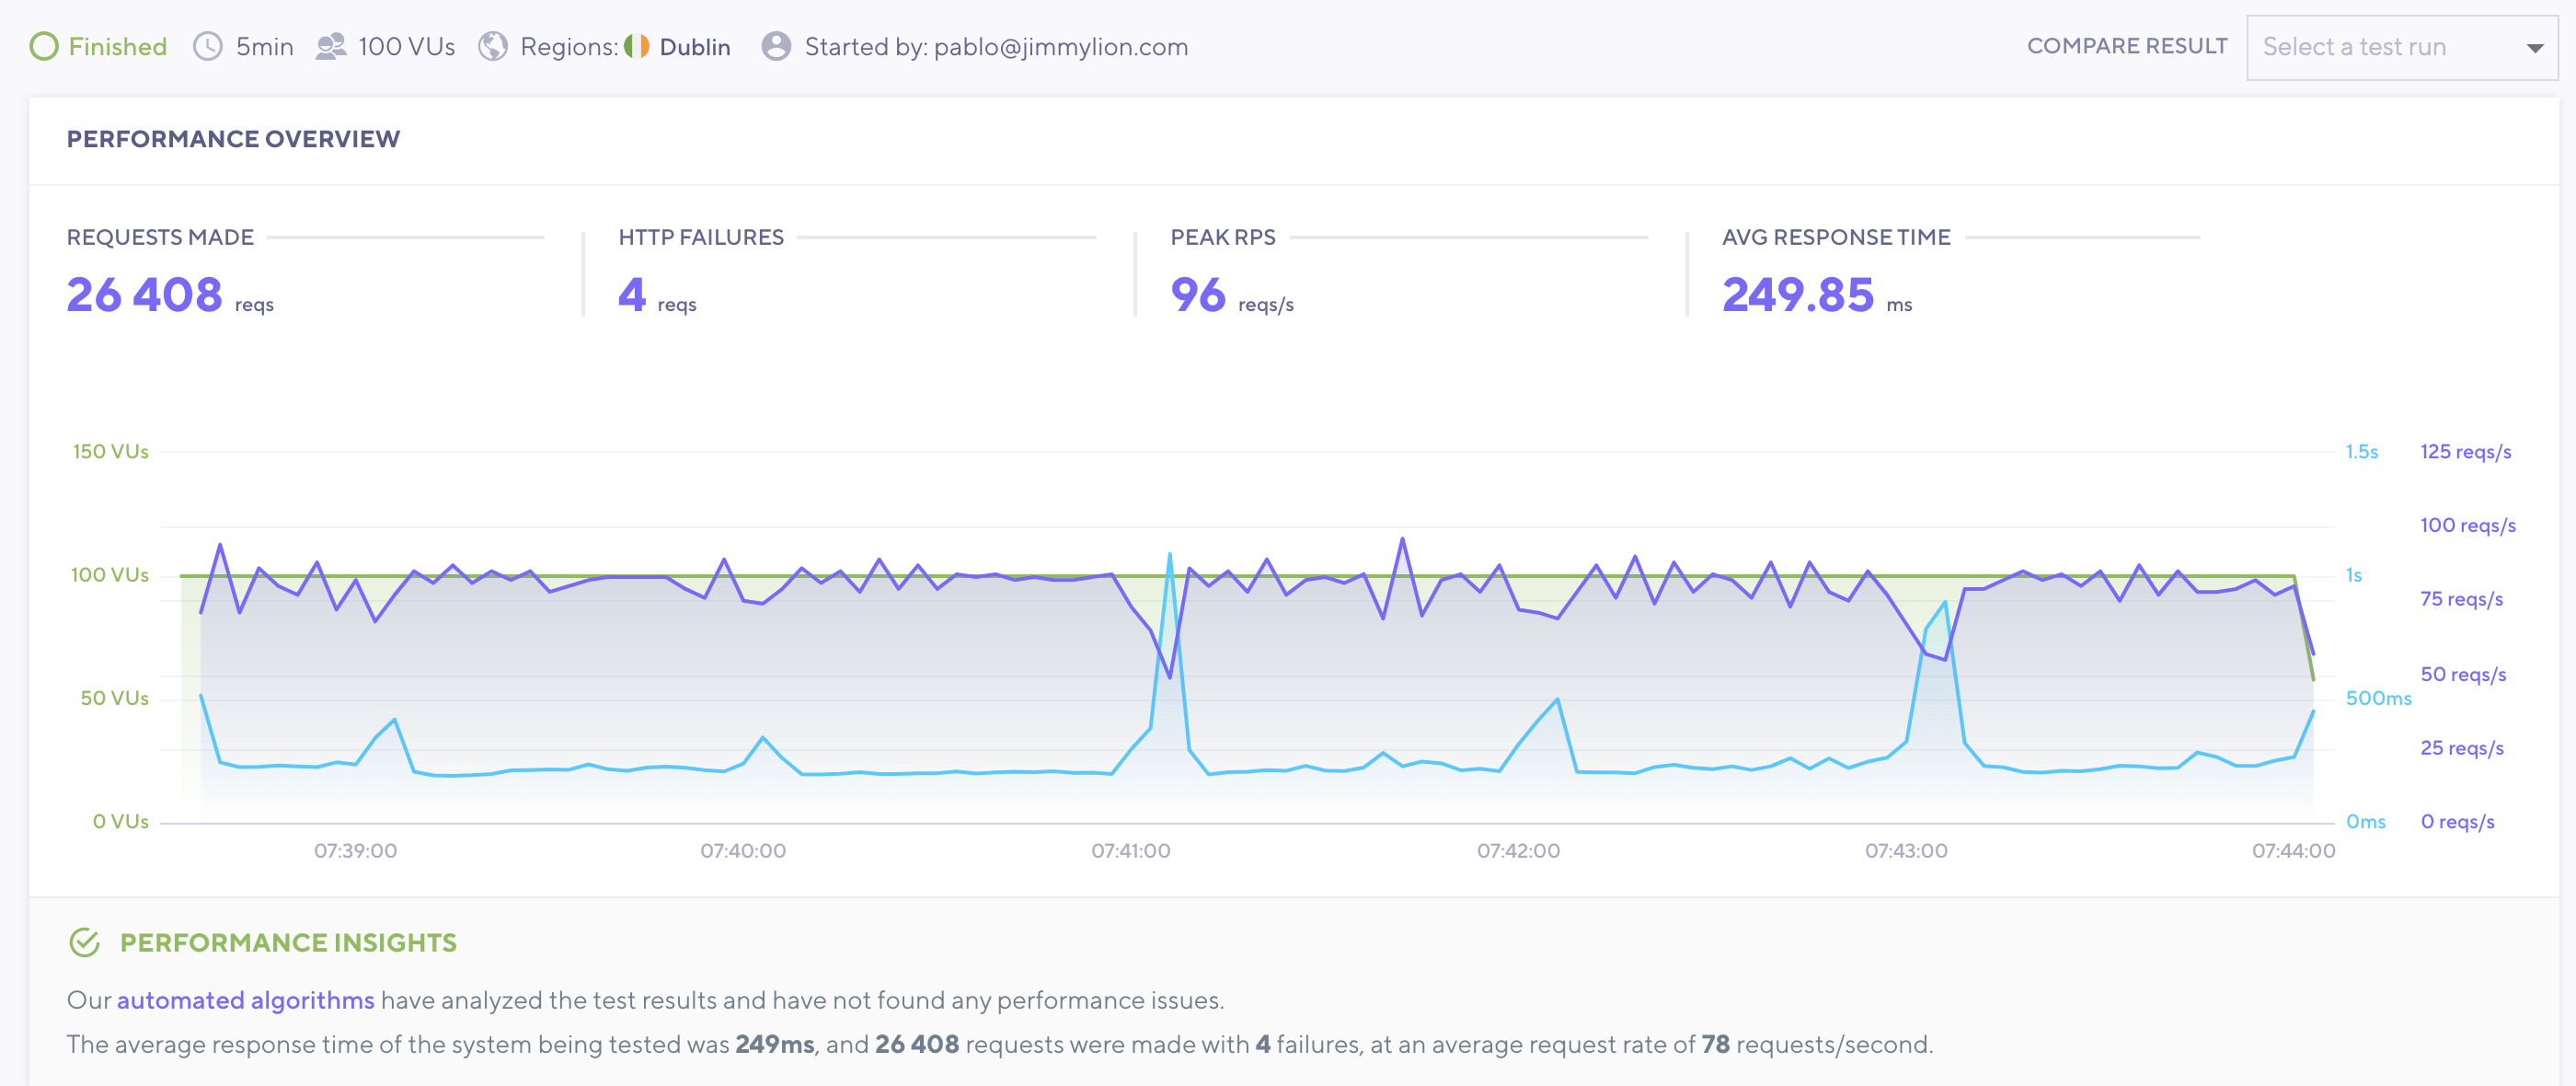
I just performed a tests with default vsf 1.10.0 code with default theme in our test server.
Test made concurrent requests to this url https://staging.jimmylion.com/es
This are the results:
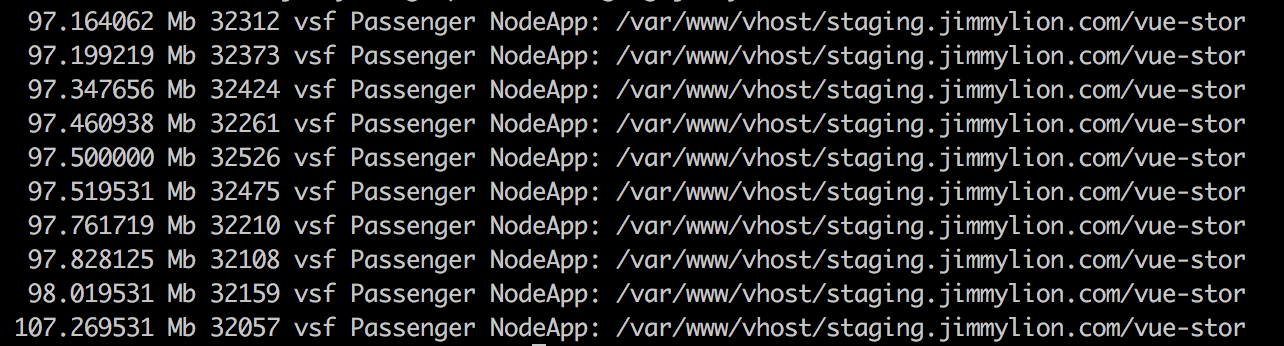
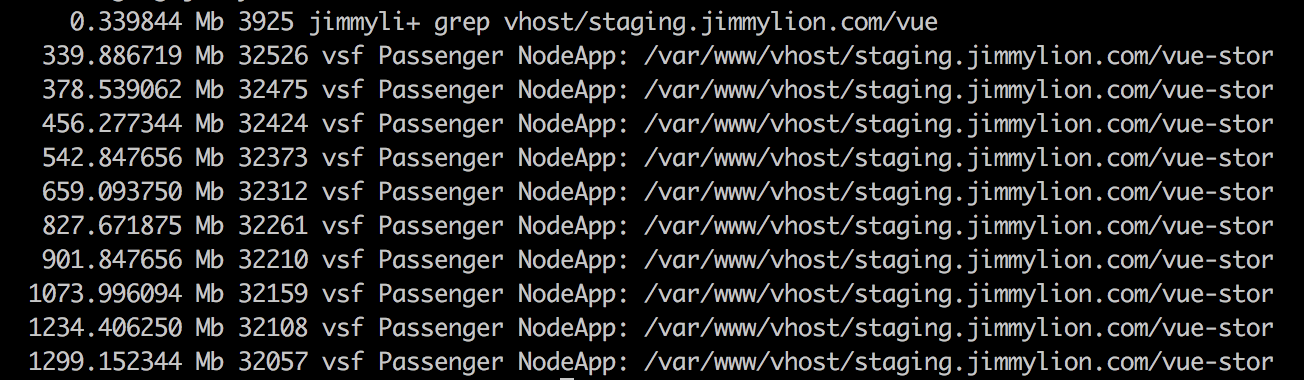
This is the evolution of the memory consumption by the node processes in charge of the pwa:
before test started
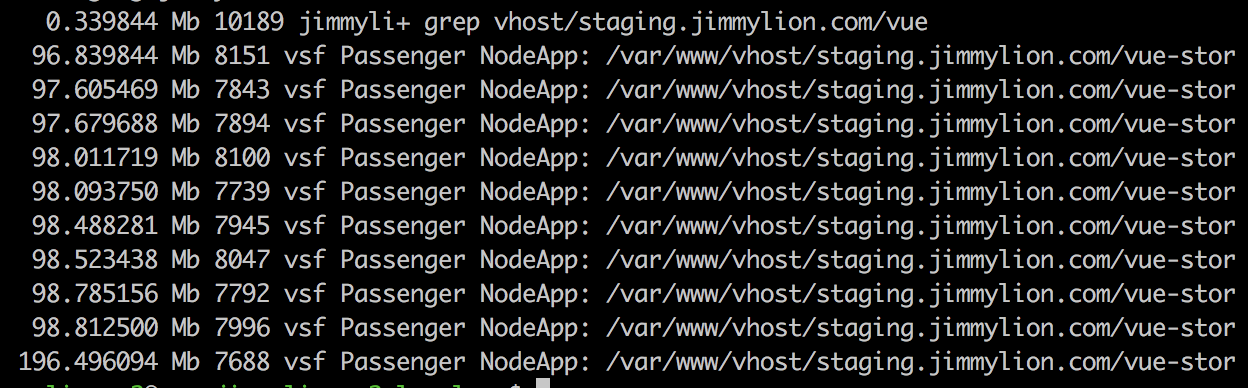
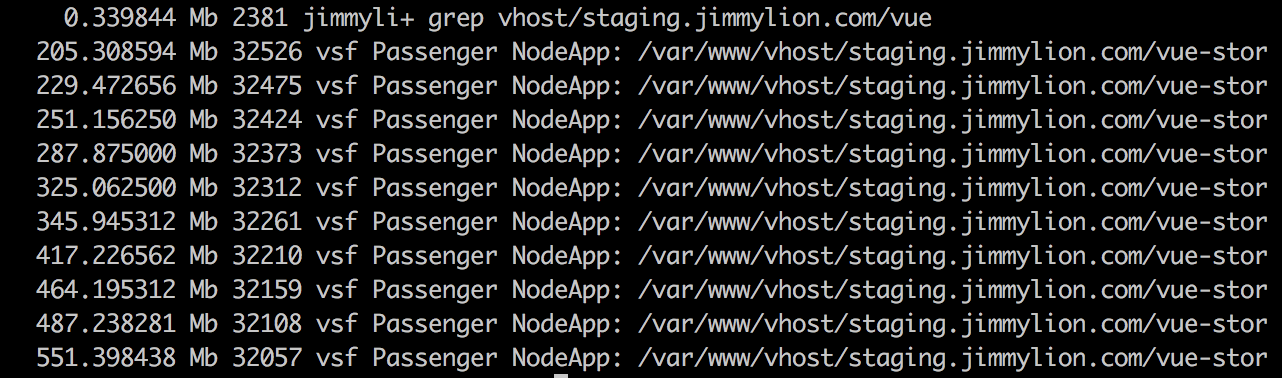
1 minute into test
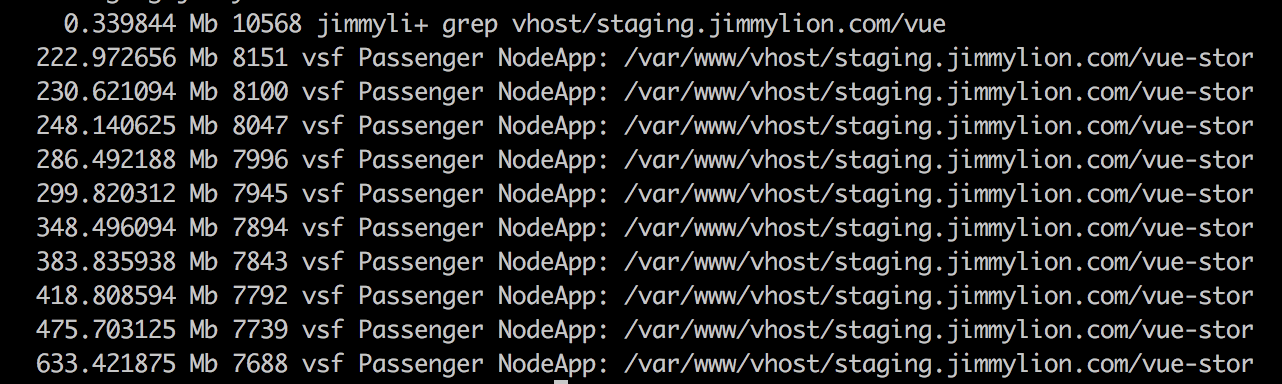
2 minutes into test
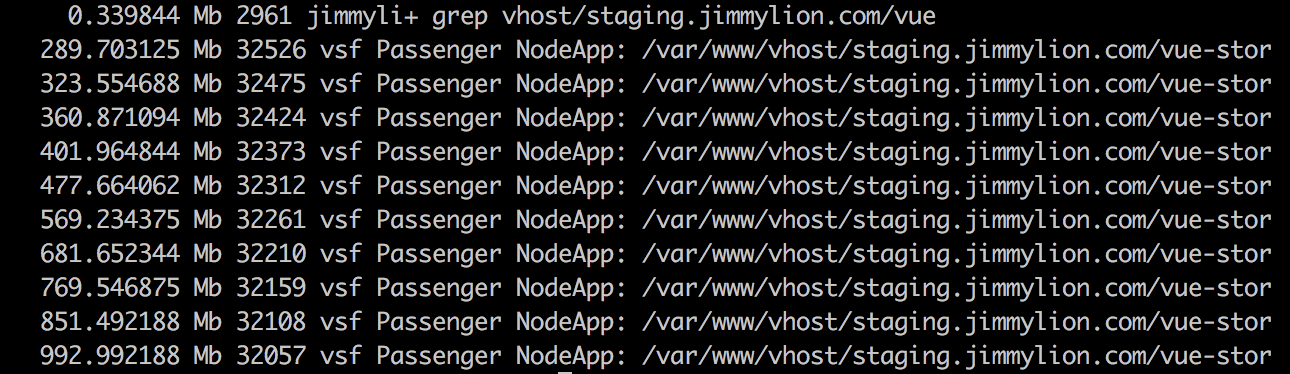
3 minutes into test
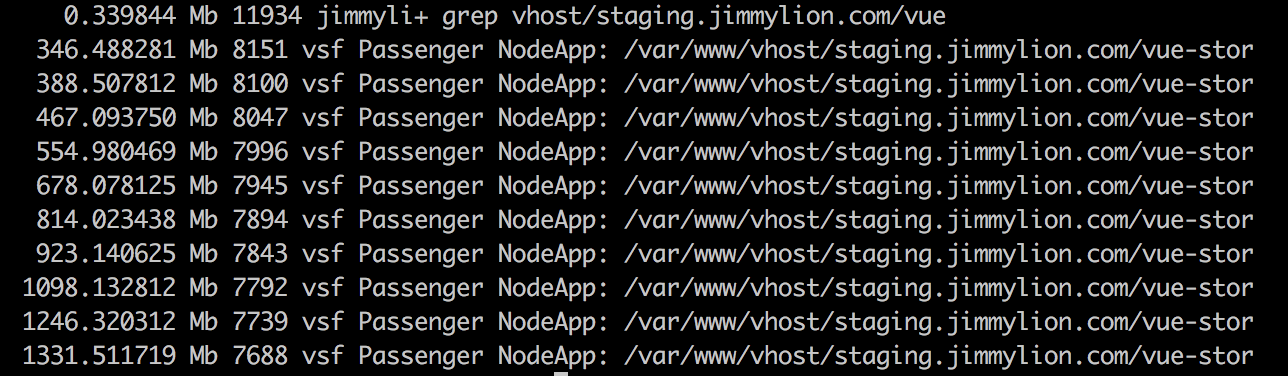
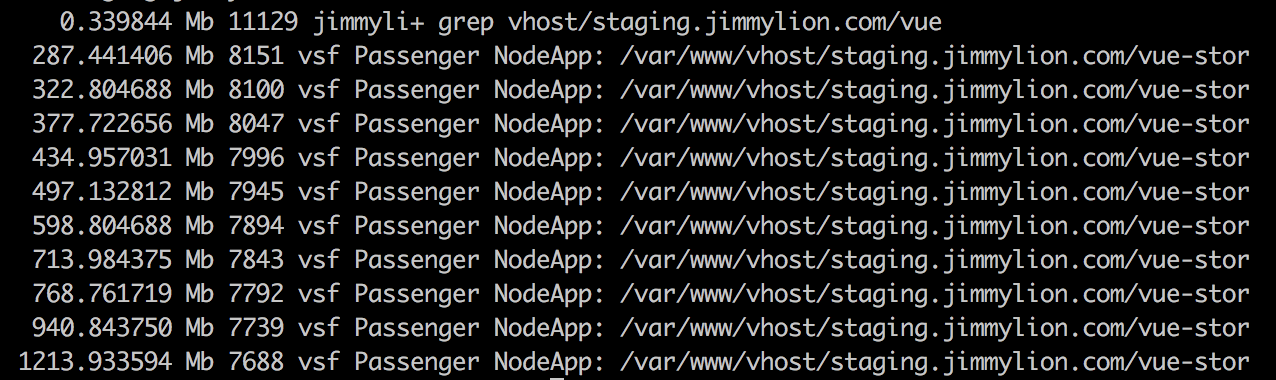
4 minutes into test
5 minutes into test
a few seconds after test ended:
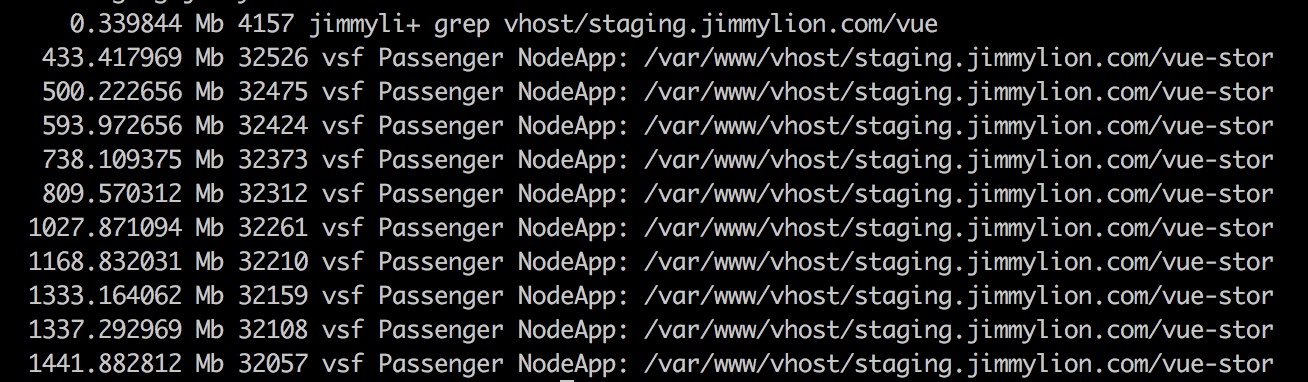
As you can see, memory keeps building up in processes and seems that it is not liberated
If I keep the test running 1-2 minutes more the server runs out of memory and restarts
This tests have been made disabling the passenger_max_requests (per process) which we have set in production to control the memory usage
@pkarw what do you thing about this results?
I will. repeat tests with 1.10.6 now
 pablogiralt
on 8 Jul 2020
pablogiralt
on 8 Jul 2020
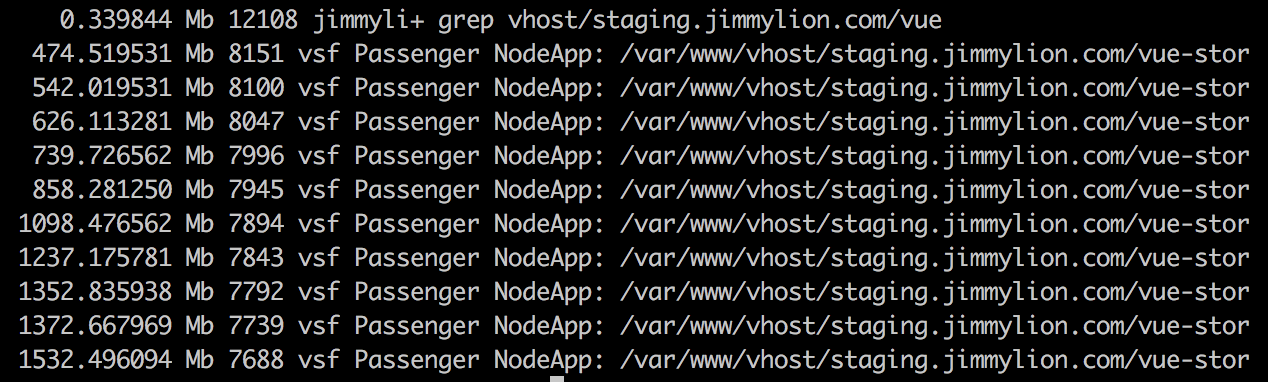
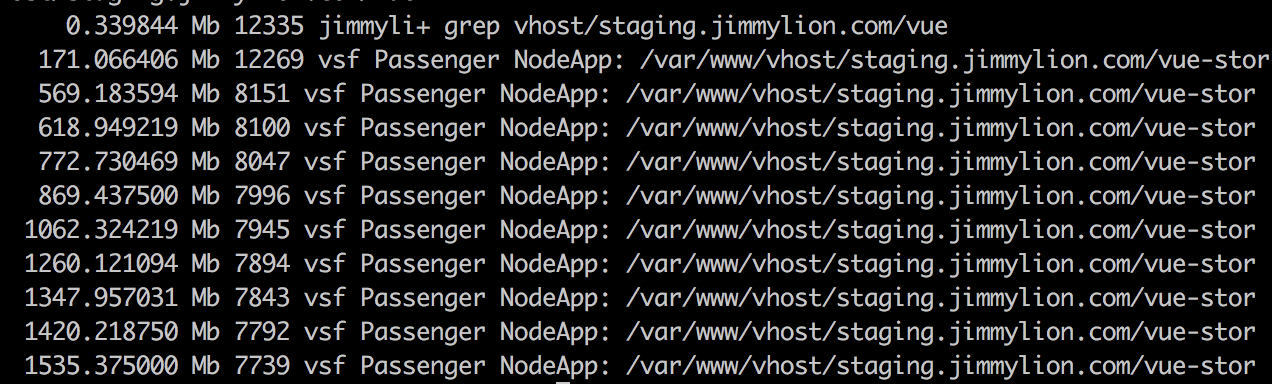
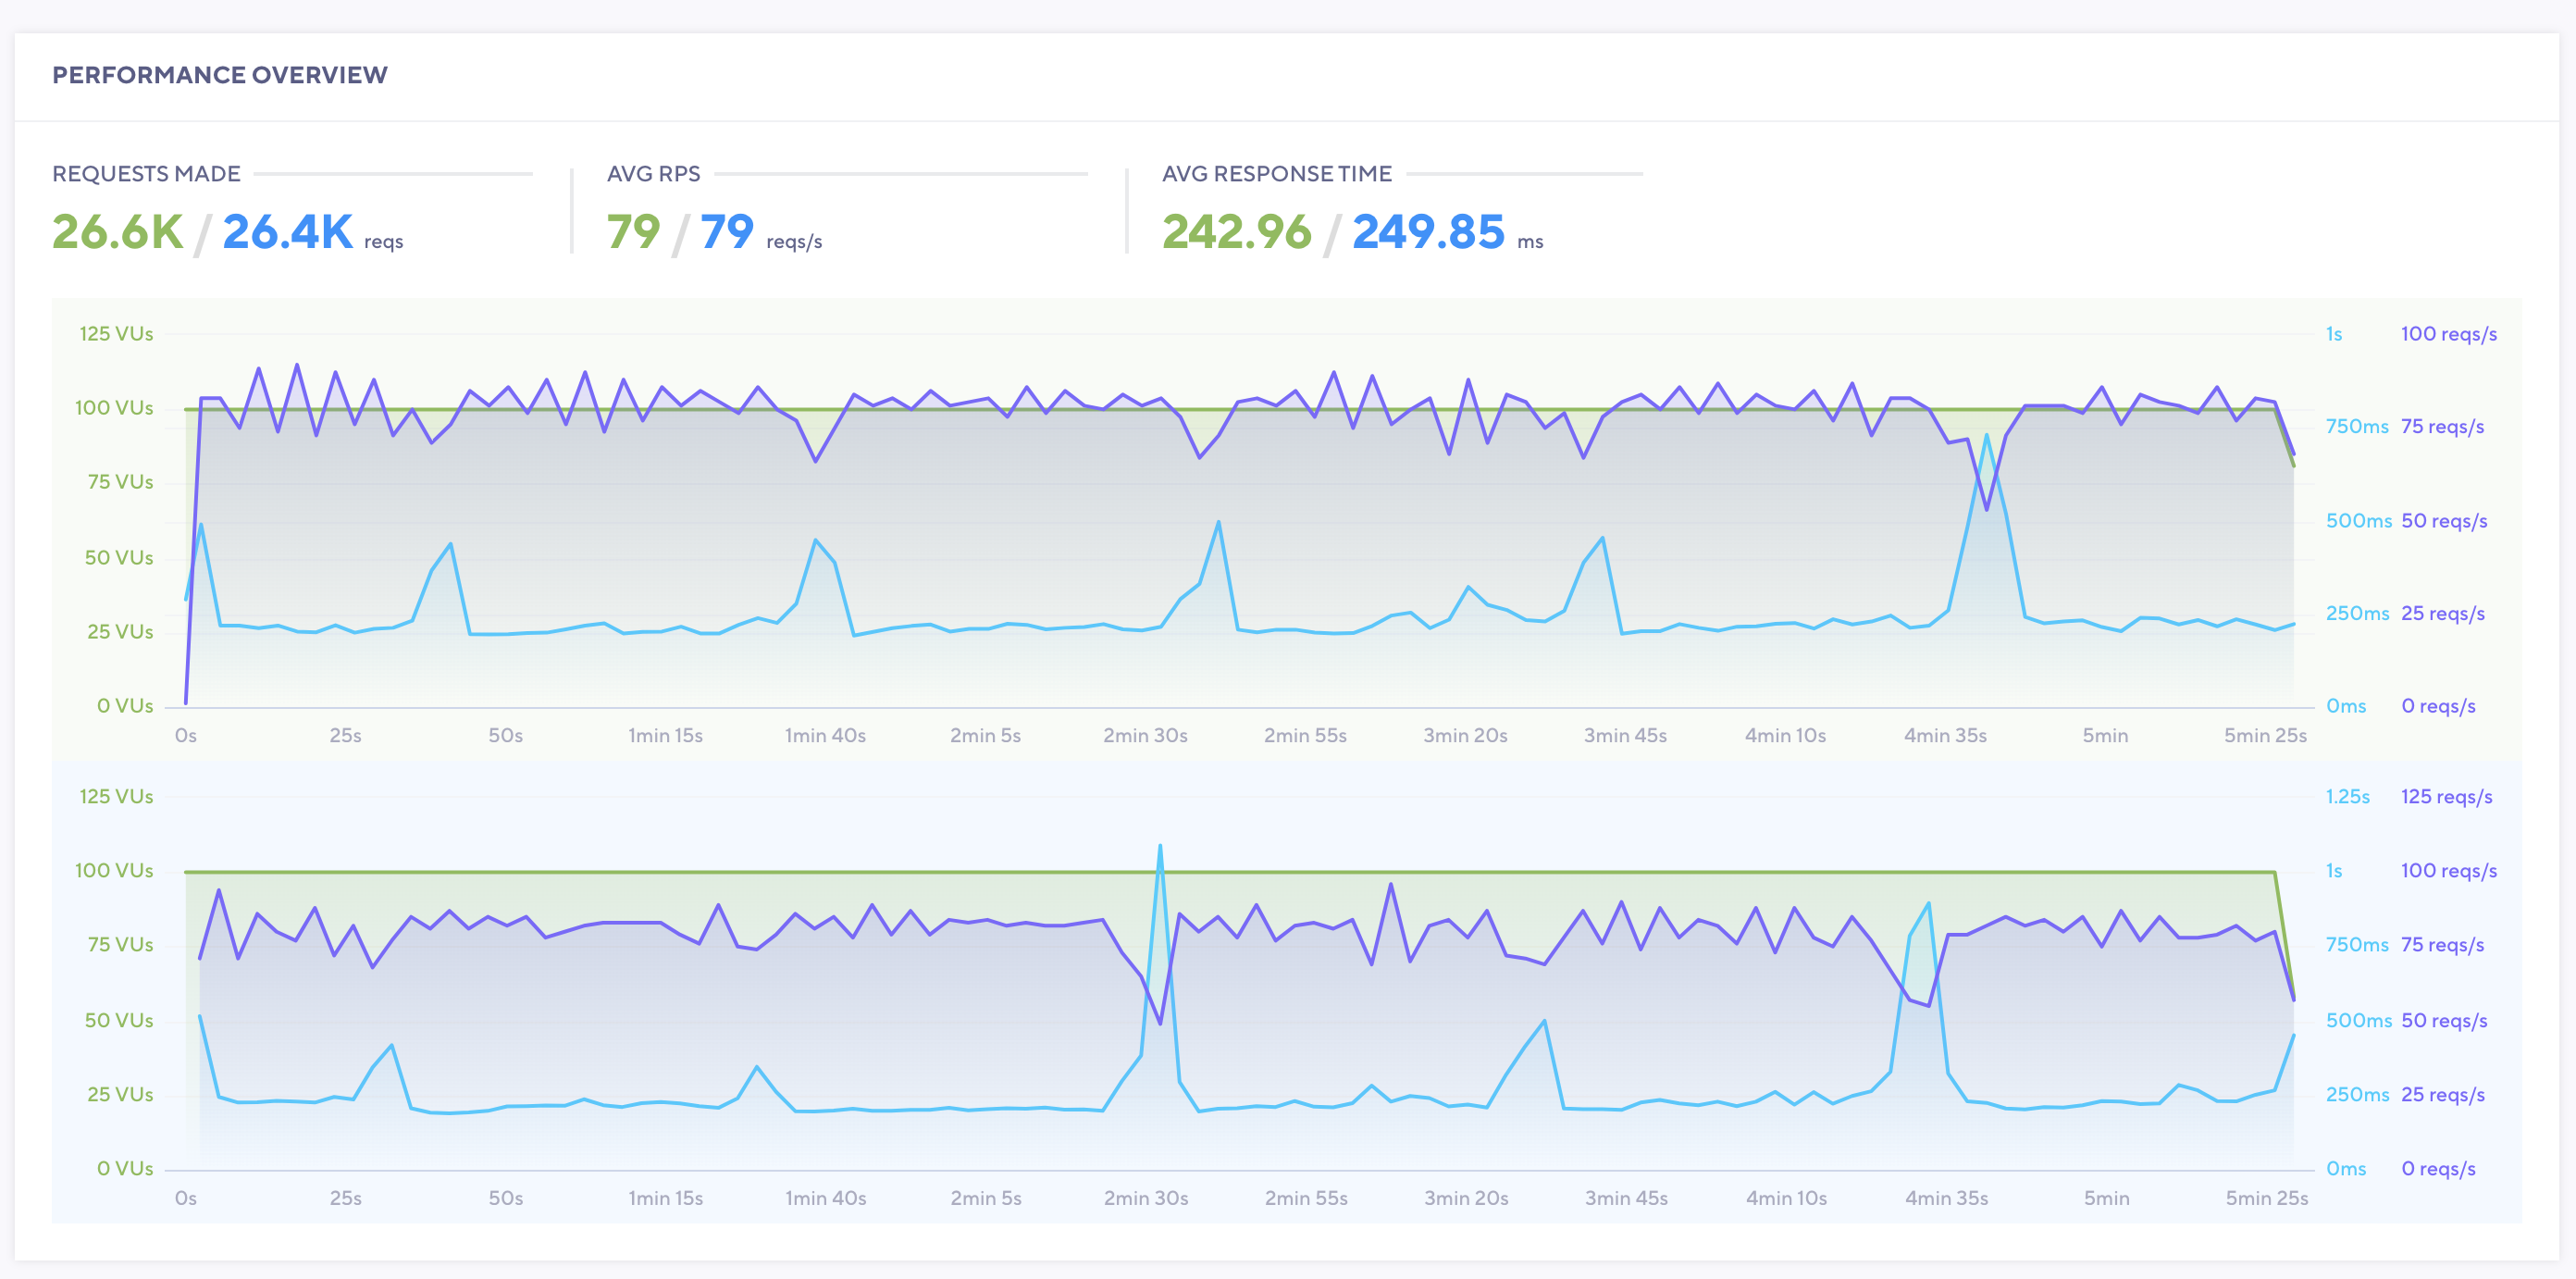
Repeated test with vsf 1.10.6 and got very similar results. Did not appreciate a performance boost and memory still gets accumulated in node processes
test with 1.10.0 (blue) and 1.10.6 (green) compared:
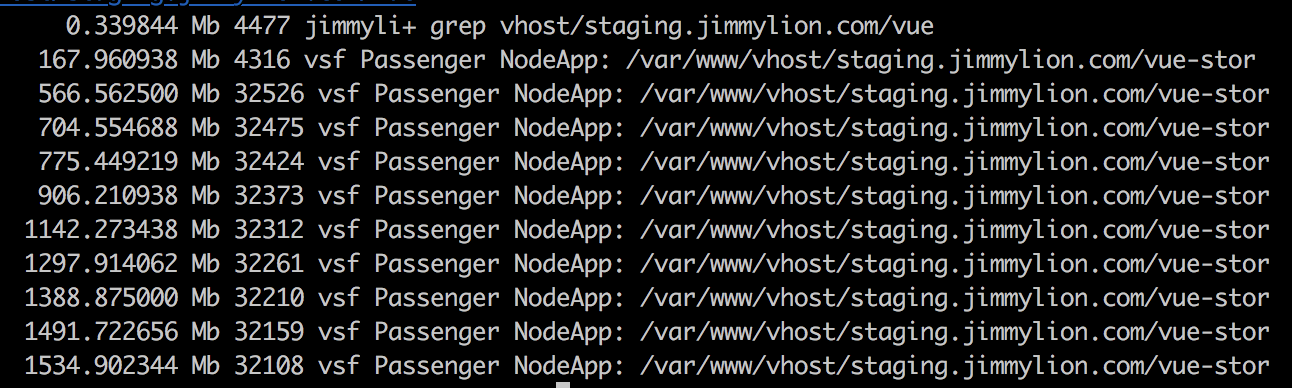
This is the evolution of the memory consumption by the node processes in charge of the pwa:
before test started
1 minute into test
2 minutes into test
3 minutes into test
4 minutes into test
5 minutes into test
pablogiralt
on 8 Jul 2020
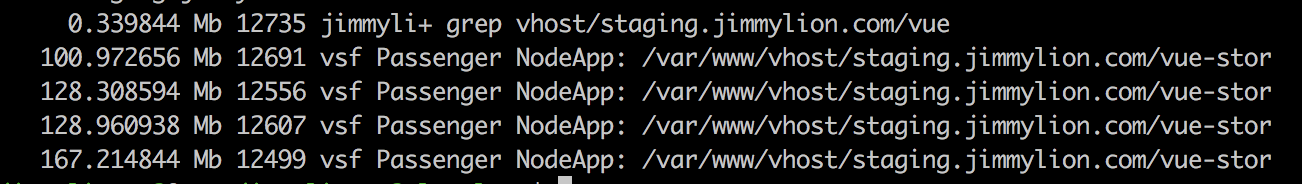
So we did a last test using pm2 as a process manager (instead of Phusion Passenger) and results were very similar (actually a little worst)
This was the memory per process about 4 minutes after the test, when the server restarted because it run out of memory:
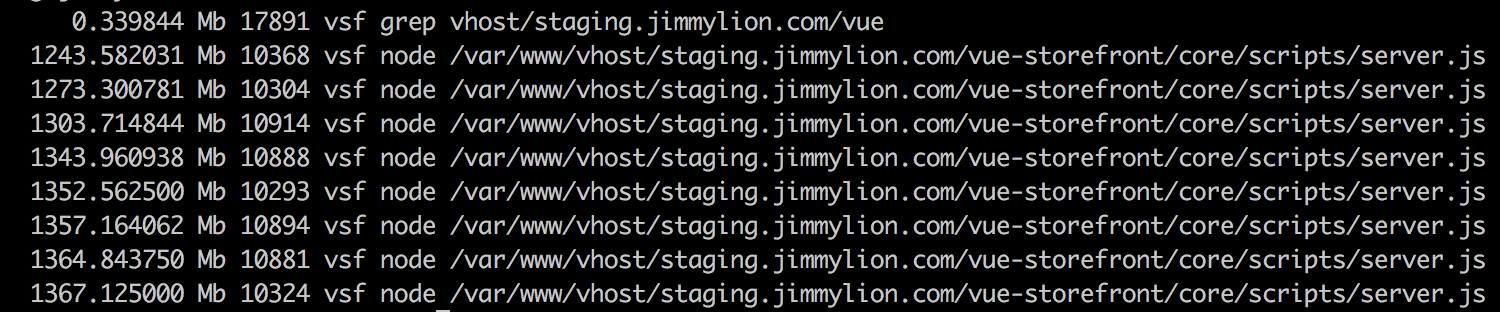
We increased the max_memory_restart in. ecosystem.json to 2G so we could test the memory leak
pablogiralt
on 8 Jul 2020
We're experiencing the same issue in production using Vue storefront with the Capybara theme, elasticsearch and Magento. We currently have a restart policy set for the storefront container as workaround.
I will keep an eye on this thread and will add to it if I have new insights.
 one1note
on 8 Jul 2020
one1note
on 8 Jul 2020
Guys, thanks for the research. We're always doing our best to not have any memory leaks in the core (and the default themes).
These charts and memory consumption is per vsf frontend app and not the vue-storefront-api, correct?
@lukeromanowicz can we do a leak-testing on 1.10 and then 1.11, 1.12 on the default-theme first and then 1.12 with Capybara?
pkarw
on 9 Jul 2020
From 1.10 we've got some fixes in regards to memory leaks already applied - not sure if this would be helpfull here but I'm just pasting it for a reference: https://github.com/DivanteLtd/vue-storefront/pulls?q=is%3Apr+memory+is%3Aclosed
pkarw
on 9 Jul 2020
@pkarw found the cause, it was the dynamicConfigReload setting. By setting it to false, memory leak disappears
This setting is causing memory leaking both in 1.10.0 and 1.10.6 with default theme
pablogiralt
on 9 Jul 2020
@pablogiralt thanks for your insight on this issue. I think we should rethink implementation of dynamicConfigReload. We use hacky way to reload config
    const cachedConfigModule = require.cache[require.resolve('config')]
    if (cachedConfigModule) {
      delete cachedConfigModule.parent.children
      delete require.cache[require.resolve('config')]
    }
    config = require('config') // reload config
Maybe we should pass updated config into request context https://github.com/DivanteLtd/vue-storefront/blob/lts-1.10/core/scripts/server.js#L173 and then updated config will be only in vuex state :thinking: But config module will be untouched.
 gibkigonzo
on 10 Jul 2020
gibkigonzo
on 10 Jul 2020
@gibkigonzo you are welcome. Thanks for your help too
pablogiralt
on 10 Jul 2020
In addition to the above for Capybara users, the following also helped in resolving our memory leak issue:
https://github.com/DivanteLtd/vsf-capybara/pull/420
one1note
on 11 Jul 2020
@gibkigonzo thats not a bad idea however most of users custom code use “import config from “config”” and this hack was imposed to keep the dynamic config reload compatible with this old semantic. I’m wondering if we could somehow maybe return just a Vuex state config reference from the “config” module in order to implement what you suggested?
pkarw
on 18 Jul 2020
There was one more issue reported by @pablogiralt in regarding to that
Seemingly when the dynamic config is off the cacheInvalidationHandler (core/scripts/server.ts) doesn’t have access to the invalidation key config variable.
There was suggestion on slack to turn the dybamicConfigRelod off by default so we just need to make sure this cache invalidation works fine when it’s disabled ok?
pkarw
on 18 Jul 2020
@gibkigonzo I’ve looked at it a little bit and I think the problem is cause because we’re using require clause for re-loading the config https://github.com/DivanteLtd/vue-storefront/blob/4f74dc61e0c96e799ea8fbc81fb786c2a2d0828c/core/scripts/server.ts#L292
I mean it’s being passed via context as you suggested and the is merged into config used by the fronted day app in here (assign): https://github.com/DivanteLtd/vue-storefront/blob/4f74dc61e0c96e799ea8fbc81fb786c2a2d0828c/core/client-entry.ts#L20
After this asssign, because “import config from config” returns just a singleton (for the frontend app the config is generated as json file by webpack: ) all subsequent imports from config returns this, modified object
This assignment is in the clien-entry so it’s rather not the reason of the leak. It must be the way we re-load config in server.ts
The thing is that while in the client layer the config is just json file (it’s generated here: https://github.com/DivanteLtd/vue-storefront/blob/c80a1351c7d5c9e35434b1ed89fff2fc24084871/core/scripts/generate-files.ts) in the server.ta we are using node-config module with all its logic to process configs: https://github.com/lorenwest/node-config
Probably we can change the way we load config from:
https://github.com/DivanteLtd/vue-storefront/blob/lts-1.10/core/scripts/server.js#L173
To: https://github.com/lorenwest/node-config/wiki/Using-Config-Utilities#loadfileconfigsdirectory
Or jus reading just the configs as raw json, merging them together (at least: default->local->production in this sequence) and then merging back into node-config
Please try out this way guys and if it solves the issue prepare a PR
pkarw
on 18 Jul 2020
Seems #4655 fixes the issue for us.
Not sure if changing config in runtime still works with this change, as we do not use this at the moment
pablogiralt
on 22 Jul 2020
Related issues
 jorkvist
·
5Comments
jorkvist
·
5Comments
 talalus
·
4Comments
talalus
·
4Comments
 jonashrem
·
3Comments
jonashrem
·
3Comments
 Jensderond
·
5Comments
Jensderond
·
5Comments
 vishal-7037
·
5Comments
vishal-7037
·
5Comments
Most helpful comment
@pkarw found the cause, it was the
dynamicConfigReloadsetting. By setting it to false, memory leak disappearsThis setting is causing memory leaking both in 1.10.0 and 1.10.6 with default theme