Vue-devtools: Reduce verbose "flush" message when using standalone tool
Version
5.3.3
Browser and OS info
Firefox 72.0.1 / Windows 10
Steps to reproduce
- Install standalone version of vue-devtools.
- Create an empty vue project and install Element-ui.
- Follow the instructions in https://element.eleme.cn/#/en-US/component/table to create a <el-table> element and fill in some data.
- Connect the Vue.js application to dev tools, and open browser's dev console.
- When the mouse enters the table and triggers the mouseover & mouseenter event, a lot of "flush" messages flush into dev console.
What is expected?
The output "flush" message can be reduced if I change some setting while the application still running in development mode.
What is actually happening?
The "flush" messages flush the console output and make the useful information becomes relatively difficult to find.
The most obvious case is when using element-ui and build some tables that contains transition animation, most time it's ok but sometimes the messages become so much that make it a little annoying.
The https://github.com/vuejs/vue-devtools/blob/30f15164aabf216b4fcd4b147c2377e598380912/packages/app-backend/src/index.js#L297 line should be change to console.debug() instead of console.log() so people can turn it off by change dev console's filter settings.
 Zhwt
Zhwt
All 15 comments
I have the same issue. My use case is building a Chrome extension.
Version
5.3.3
Browser and OS info
Chrome 79 / OSX 10.12.6 (Sierra)
Steps to reproduce
Set up the Vue application to connect to Devtools and run in development mode:
if (process.env.NODE_ENV === 'development') {
require('@vue/devtools').connect()
}
What is expected?
Devtools should connect and do its thing.
What is actually happening?
Devtools connects, but then fills my application console with a slew of continuous debugging information, which masks my own console logs:
backend.js:23177 You are running Vue in development mode.
Make sure to turn on production mode when deploying for production.
See more tips at https://vuejs.org/guide/deployment.html
backend.js:2189 vue-devtools Remote Devtools Connected
backend.js:3201 [shared data] Slave init in progress...
log.js:24 [HMR] Waiting for update signal from WDS...
hook.js:214 early register module ["recent"] {namespaced: true, actions: {…}, state: {…}, getters: {…}, mutations: {…}} undefined
hook.js:214 early register module ["tools"] {namespaced: true, state: {…}, actions: {…}, mutations: {…}} undefined
main.ts:40 loaded: app
main.ts:30 running: app
backend.js:3203 [shared data] Slave loading data...
backend.js:3207 [shared data] Slave init complete
backend.js:1196 [flush] serialized 0 instances, took 0.9250000002793968ms..
services.js:41 {dateAdded: null, title: "New Workspace", windows: Array(4)}
backend.js:1196 [flush] serialized 0 instances, took 0.06500000017695129ms..
backend.js:1196 [flush] serialized 188 instances, took 18.985000002430752ms..
services.js:41 {dateAdded: null, title: "New Workspace", windows: Array(4)}
backend.js:1196 [flush] serialized 188 instances, took 2.0249999943189323ms..
backend.js:1067 vue-devtools Detected Vue v2.6.10
backend.js:1196 [flush] serialized 192 instances, took 15.285000001313165ms..
backend.js:1196 [flush] serialized 192 instances, took 3.4700000105658546ms..
backend.js:1196 [flush] serialized 192 instances, took 13.219999993452802ms..
backend.js:1196 [flush] serialized 192 instances, took 3.8849999982630834ms..
backend.js:1196 [flush] serialized 192 instances, took 4.935000004479662ms..
backend.js:1196 [flush] serialized 192 instances, took 8.115000004181638ms..
main.js:4 page loaded!
backend.js:1196 [flush] serialized 192 instances, took 3.8700000004610047ms..
backend.js:1196 [flush] serialized 192 instances, took 15.32500000030268ms..
backend.js:1196 [flush] serialized 192 instances, took 8.409999994910322ms..
backend.js:1196 [flush] serialized 192 instances, took 4.520000002230518ms..
...
Looking through most of the source code where Devtools spits out stats, it seems that these conditionals should be referencing some kind of option, not whether the host app is in development mode:
// rather than...
if (process.env.NODE_ENV !== 'production') {
console.log(`[flush] serialized ${captureCount} instances${isBrowser ? `, took ${window.performance.now() - start}ms.` : ''}.`)
}
// something like...
if (options.debug) {
console.debug(...)
}
https://github.com/vuejs/vue-devtools/blob/dev/packages/app-backend/src/index.js#L296-L298
The if (process.env.NODE_ENV !== 'production') code is all over the app.
 davestewart
on 12 Feb 2020
davestewart
on 12 Feb 2020
Indeed there should be an option rather than writing environment judging if statements everywhere.
Zhwt
on 12 Feb 2020
I'm pulling together a PR right now.
Hopefully the team will be able to review it promptly and suggest changes if my suggestions are not to their taste.
EDIT: Hmmm. The code changes are straightforward, but I can't get the build to run to test them.
davestewart
on 12 Feb 2020
I've solved it for now by doing a find and replace on the package folder from .log to .debug as you suggested @Zhwt
davestewart
on 12 Feb 2020
Any movement on this update? Do you need any help?
 matsieftw
on 20 Mar 2020
matsieftw
on 20 Mar 2020
Getting never ending log messages... I'm developing in a twitch extension environment, where my app is loaded in a nested iframe.
I think something is busted too, since it seems like "Slave loading data" and "Slave init complete" should only be logged once.
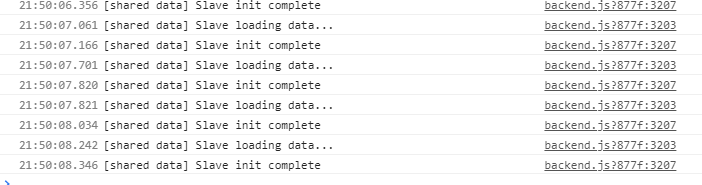
Other than that, everything works! <3
 guanzo
on 11 Apr 2020
guanzo
on 11 Apr 2020
+1
 aolsx
on 12 Apr 2020
aolsx
on 12 Apr 2020
Hi @Akryum, no updates to the lib since last year.
Are there any updates on this?
davestewart
on 17 Jun 2020
Hey @Zhwt @aolsx @guanzo @matsieftw ...
I suspect this won't get patched, so I solved it by adding a postinstall script to my package setup.
Install:
npm i --save-dev replace-in-file
Update package.json:
"scripts": {
  ...
  "postinstall": "node postinstall.js"
}
Add postinstall.js script:
const replace = require('replace-in-file')
replace({
  files: 'node_modules/@vue/devtools/build/backend.js',
  from: /console\.log/g,
  to: 'console.debug',
})
Run if already installed:
npm run postinstall
This modifies the installed background script to filter all verbose debug messages from the console as @Zhwt suggested in his original post.
Obviously, you need to be running the local install configuration for this to work, but I suspect you will be in your associated extension / electron projects, etc...
davestewart
on 23 Jun 2020
i have the same problem wit vue-devtools standalone i work also in an iframe
 cannap
on 8 Jul 2020
cannap
on 8 Jul 2020
It was at 6000 a moment ago before the page reloaded:

@cannap use the fix I posted above and you'll be good.
davestewart
on 8 Jul 2020
@davestewart this is working like a charm! tx. This should be the "standard" for devtools and not a postinstall plugin, though. I'm wondering why this isn't included yet!
 dariopalladino
on 28 Jul 2020
dariopalladino
on 28 Jul 2020
This never happened to me before until now. I didn't even change my code, nor did I update the vue-devtools package. It's really unproductive!
 truefusion
on 5 Aug 2020
truefusion
on 5 Aug 2020
A quick and dirty fix in devtools (Chrome devtools, at least), is to just filter out the lines with a Filter expression. This seems to work:

Multiple negations seem to work, too:

 deisner
on 16 Jan 2021
deisner
on 16 Jan 2021
A quick and dirty fix in devtools (Chrome devtools, at least), is to just filter out the lines with a Filter expression. This seems to work:
Multiple negations seem to work, too:
I would actually call this a more sensible solution. Since you're basically looking at logs, filtering out makes sense. It's true whether it's on a browser console or tailing server logs.
 ch4dwick
on 23 Jan 2021
ch4dwick
on 23 Jan 2021
Related issues
 ispal
·
4Comments
ispal
·
4Comments
 yyx990803
·
3Comments
yyx990803
·
3Comments
 matthewsunrise
·
3Comments
matthewsunrise
·
3Comments
 phromo
·
4Comments
phromo
·
4Comments
 sithuaung
·
4Comments
sithuaung
·
4Comments
Most helpful comment
Hey @Zhwt @aolsx @guanzo @matsieftw ...
I suspect this won't get patched, so I solved it by adding a
postinstallscript to my package setup.Install:
Update
package.json:Add
postinstall.jsscript:Run if already installed:
This modifies the installed background script to filter all verbose debug messages from the console as @Zhwt suggested in his original post.
Obviously, you need to be running the local install configuration for this to work, but I suspect you will be in your associated extension / electron projects, etc...