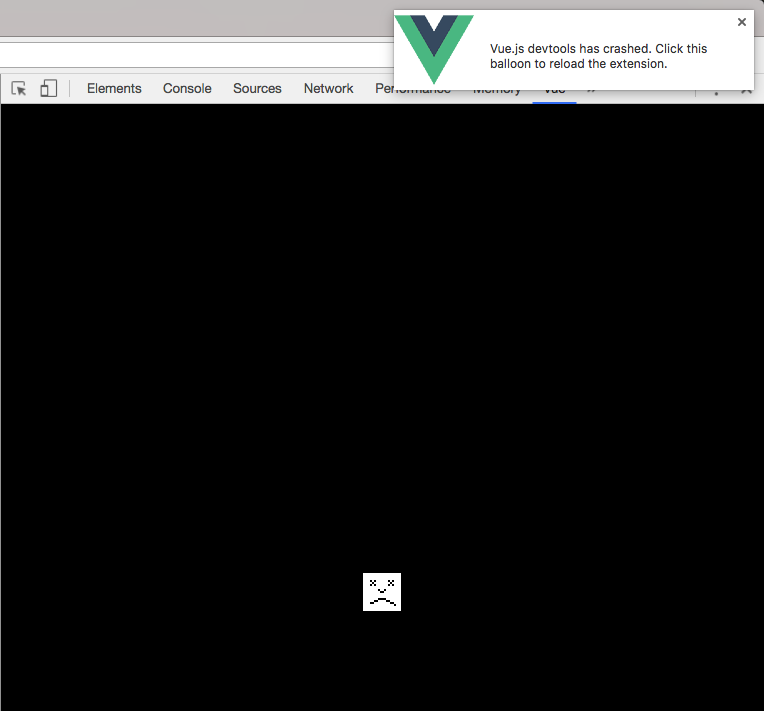
vue-devtools Chrome plugin crashing after reload
Version
4.1.3
Browser and OS info
Chrome Version 64.0.3282.186 (Official Build) (64-bit) / Windows 10 (1709, 16299.248)
Steps to reproduce
Sometimes it happens when I reload the page once, and other times it happens after a couple of refreshes.
Edit:
I'm thinking now that it did crash (in a way) on every reload, but I failed to see it, because before crashing, Vue Devtools becomes unresponsive, but doesn't crash fully for short but varying period of time. (end edit)
I know you require clear and concise steps to reproduce, but I am unable to provide that because it happens simply when I reload the page, on a complex page with hundreds of components.
Though I am willing to try to get you any debug information that may be of use, if you're willing to help do that.
I also quickly installed Vue Devtools and opened the app up in a colleagues computer (same browser version, same vue devtools version), except this time I reloaded it about five or six times, and vue devtools become unresponsive, and then appeared to right itself, it was just a little sluggish on reload. So I give up and closed the tab on my colleagues computer, and I turn back to my desk. Even still, a few minutes after, I got a tap on the shoulder, and the Vue Devtools extension had crashed eventually.
What is expected?
For Vue Devtools not to crash.
What is actually happening?
Vue Devtools crashes.
I thought perhaps there was some infinitely recursing event loop that might be causing it, however after running the following tests, I can rule that out.
I created an event, which when fired, emits another event, and upon reception of the other event, the first event is triggered, to cause a loop. This caused the maximum call stack length to be exceeded almost as soon as I ran the code.
I also tried creating an asynchronous version of the above event loop, delaying the emission of the second event using Vue.nextTick, due to each event emission not being on the same call stack it didn't cause a max call stack error, it just pushed my CPU usage up to about 15% (according to Task Manager).
However, after interacting with the page in the same way as I was when Vue devtools crashed (but without Vue Devtools loaded), my CPU remained pretty much idle, except on initial loading of page, and when I trigger something computationally taxing on the page in quick succession. But CPU usage always stablises an returns to a near idle state after interaction.
Lo and behold, if I open up Vue Devtools again, it crashes as soon as I reload.
If you have any ideas of ways I can deduce a simple list of reproduction instructions, please let me know and I'd be happy to do it.
 CaelanStewart
All 12 comments
This happens a lot and right before crashing extension starts using CPU intensively. I am using Chrome Version 64.0.3282.186 and macOS High Sierra.
 fatihacet
on 2 Mar 2018
fatihacet
on 2 Mar 2018
This happens for me with an OpenLayers 3 map application using a couple dozen components and it's very frustrating.
Any guidance on ways to help debug this issue would welcome - I'm more than happy to help, just don't know how
 Burstaholic
on 5 Mar 2018
Burstaholic
on 5 Mar 2018
This seems to be some kind of emergent bug.
Vue in my case is being used for a document editing system, with different kinds of field, fieldsets and repeatable fieldsets, validation etc.
The document template in the system that causes the crash is about 30 pages, with hundreds of fields.
So there's a lot going on there, but just a lot of the same thing, really. Making it exceedingly difficult to deduce (without knowing how Vue Devtools works) what exactly causes this to happen.
Even with only the fields for the current page and the current page itself being mounted (using v-if) on the editor screen, and another instance of the document template component (with all 30 pages rendered and visible) in a sidebar for the filmstrip, it causes Vue DevTools to crash.
However, a document template I had neglected, which i was using for playground when building the system, loaded into the editor screen, does not cause Vue DevTools to crash, no matter how rigorously I interact with the page and hit the reload button.
CaelanStewart
on 6 Mar 2018
Actually, a possibility may be the number of events being emitted on the page on initial page load.
In my case, a lot of cross component communication is required, for validation of input data, and validation of the resulting output, line count limits, checking the provided content fits within the designated bounds on the page.
So there's an equiv component for each field that is wrapped around the output of the field that deals with this.
On initial load, each field emits an event requesting validation from the field's display component.
And there's a bunch of other stuff that uses an event bus to trigger certain actions.
The small test document, with two pages, emits about 50 events on page load.
The count of events on the bigger document before becoming completely unresponsive passes 250.
Could the number of events that Vue Devtools is trying to collect data on be causing the crash?
(sorry about closing the issue, accidentally click close and comment)
CaelanStewart
on 6 Mar 2018
This happens a lot and it's very annoying. Please fix this in the next release 🙏
fatihacet
on 7 Mar 2018
Thank you for building an excellent tool which hugely improves the debugging experience with Vue, but...
It would be really good to have some feedback, and that you are aware of the issue, and something is being done about it.
CaelanStewart
on 13 Mar 2018
Hi! We are aware that having too many components or too big Vuex stores can lead to performance issues or even crashes. We have planned to work on this (and many related performance issues) as our bandwidth permits. 😉
I you have a very big Vuex store or lots of events, you can disable recording in the related tabs which should help improve performances.
 Akryum
on 13 Mar 2018
Akryum
on 13 Mar 2018
@Akryum thank you for responding!
I understand, good to hear it's in the pipeline somewhere.
I shall do exactly that.
Thanks again.
EDIT:
Disabling recording of events does indeed mitigate the crashes in my case.
The easy insight into the current state of a component saves so much faffing!
CaelanStewart
on 13 Mar 2018
@Akryum, also, it may be worth adding an entry in your README under 'Common problems and how to fix' noting this.
CaelanStewart
on 13 Mar 2018
Let's continue in #649 🐈
Akryum
on 16 Mar 2018
The CPU is still a problem for me. Here's what I'm seeing:


My coworker on a totally different machine (both using windows) can repo this.
Right now I don't even have devtools open and I have four tabs open on chrome. How is the vue dev tool actively using 35+% of my CPU when the console isn't even open?
 arcman77
on 20 Aug 2018
arcman77
on 20 Aug 2018
a somewhat nasty workaround to when devtools crashes: add a 'restart' bookmark which is just a link to chrome://restart

this saves you from manually closing chrome and re-opening it to get the extension to start working again. it would be awfully nice if devtools could restart itself on crashes properly. clicking the chrome balloon when it crashes doesn't appear to work.
fwiw, i'm debugging a vue.js mess, so i'm actually not surprised it crashes. the performance on the code i am working on it horrid.
 carchrae
on 13 Sep 2020
carchrae
on 13 Sep 2020
Related issues
 bajzarpa
·
3Comments
bajzarpa
·
3Comments
 trollderius
·
3Comments
trollderius
·
3Comments
 ispal
·
4Comments
ispal
·
4Comments
 BOSSLMH
·
3Comments
BOSSLMH
·
3Comments
 matthewsunrise
·
3Comments
matthewsunrise
·
3Comments
Most helpful comment
This happens a lot and it's very annoying. Please fix this in the next release 🙏