Vue-cli: Breakpoint not hit on debugging unit tests using mocha
Version
3.0.3
Reproduction link
https://github.com/davidp-ctg/unit-test-example
Node and OS info
Node 10.10.0 / npm 6.4.1 / Windows 10
Steps to reproduce
- Create an example project with vue create unit-test-example using the following options:
Vue CLI v3.0.3
? Please pick a preset: Manually select features
? Check the features needed for your project: Babel, Router, Vuex, Linter, Unit
? Use history mode for router? (Requires proper server setup for index fallback in production) No
? Pick a linter / formatter config: Airbnb
? Pick additional lint features: Lint on save
? Pick a unit testing solution: Mocha
? Where do you prefer placing config for Babel, PostCSS, ESLint, etc.? In dedicated config files
Set a breakpoint in the provided example unit test "example.spec.js" - either by debugger command or setting a breakpoint using your IDE (in my case VS Code)
Run the tests with command: node --inspect-brk ./node_modules/@vue/cli-service/bin/vue-cli-service.js test:unit
Attach debugger
What is expected?
Breakpoint is hit and attached debugger is waiting on the line of code with the breakpoint
What is actually happening?
Breakpoint is ignored and tests complete without stopping.
I used the documentation on how to debug the tests under jest plugin:
https://github.com/vuejs/vue-cli/tree/dev/packages/%40vue/cli-plugin-unit-jest#debugging-tests
since there is no documentation on how to do it using mocha plugin:
https://github.com/vuejs/vue-cli/tree/dev/packages/%40vue/cli-plugin-unit-mocha
 davidp-ctg
All 8 comments
Debugging for the mocha-plugin works differently, since we have a few child processes involved.
But that's actually documented:
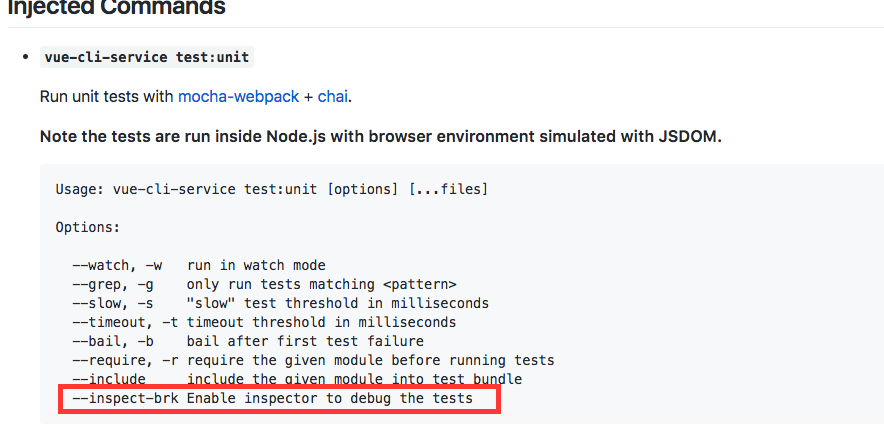
Solution
Run
yarn test:unit --inspect-brk
 LinusBorg
on 29 Sep 2018
LinusBorg
on 29 Sep 2018
This works if you write "debugger;" command inside the test. When setting the breakpoint in your IDE (in my case VS Code) it still ignores it and completes the tests without stopping.
davidp-ctg
on 1 Oct 2018
I havent tried to make it work with vscode to be honest, maybe it's not possible directly, for the same reason we couldn't make it work when running node --inspect-brk.
You could open a feature request where can discuss how to make it work if at all.
LinusBorg
on 1 Oct 2018
@davidp-ctg i've encountered the same issue, the thing that fixed it for me was to update the sourceMapPathOverrides in the .vscode/launch.json with the following config:
"sourceMapPathOverrides": {
    // SourceMaps of own source
    "webpack:///./src/*": "${webRoot}/*",
    // SourceMaps of node_modules
    "webpack:///./node_modules/*": "${workspaceFolder}/node_modules/*"
}
@LinusBorg i think the path for webpack changed from cli v2 to v3 before it was webpack:///src/* and now it's webpack:///./src/* I'm not sure if this is a bug or intended.
 Hammster
on 22 Oct 2018
Hammster
on 22 Oct 2018
@Hammster I tried your suggestion, but it doesn't work for me. The same thing happens like I've said in my previous comment.
The project structure is default as set by the vue create:
rootFolder
-node_modules
-src
--components
---HelloWorld.vue
-tests
--unit
---example.spec.js
...
This is my (updated) launch.json configuration:
{
        "type": "node",
        "request": "launch",
        "name": "Mocha Tests",
        "program": "${workspaceFolder}/node_modules/@vue/cli-service/bin/vue-cli-service.js",
        "args": [
            "test:unit",
            "--inspect-brk",
        ],
        "console": "integratedTerminal",
        "sourceMapPathOverrides": {
          // SourceMaps of own source
          "webpack:///./src/*": "${webRoot}/*",
          // SourceMaps of node_modules
          "webpack:///./node_modules/*": "${workspaceFolder}/node_modules/*"
        }
}
@davidp-ctg I used that path for debugging my general code not the tests. Maybe there is another mismatch with the sourcemap folders, or have you not set the devtool option in the vue.config.js described here: https://vuejs.org/v2/cookbook/debugging-in-vscode.html
module.exports = {
  configureWebpack: {
    devtool: 'source-map'
  }
}
@Hammster I opened this issue for debugging unit tests. I got general code debugging working from that link before, but thanks for sharing.
davidp-ctg
on 29 Oct 2018
Use a devtool mode that does not transpile the sources e.g. cheap-module-eval-source-map, and breakpoints will work fine.
vue.config.js:
module.exports = {
  chainWebpack: config => {
    if (process.env.NODE_ENV === 'test' || process.env.npm_lifecycle_event === 'test:unit') {
      const sassRule = config.module.rule('sass');
      sassRule.uses.clear();
      sassRule.use('null-loader').loader('null-loader');
      sassRule.oneOf('normal').uses.clear();
      sassRule.oneOf('normal').use('null-loader').loader('null-loader');
      config.merge({
        devtool: 'cheap-module-eval-source-map',
      });
    }
  }
}
launch configuration:
        {
            "type": "node",
            "request": "launch",
            "name": "test:unit debug",
            "program": "${workspaceFolder}/node_modules/@vue/cli-service/bin/vue-cli-service.js",
            "args": ["test:unit", "--inspect-brk", "--watch", "--timeout", "900000"],
            "port": 9229
        },
 rustyx
on 27 Nov 2019
rustyx
on 27 Nov 2019
Related issues
 BusyHe
·
3Comments
BusyHe
·
3Comments
 wahidrahim
·
3Comments
wahidrahim
·
3Comments
 NathanKleekamp
·
3Comments
NathanKleekamp
·
3Comments
 PrimozRome
·
3Comments
PrimozRome
·
3Comments
 Gonzalo2683
·
3Comments
Gonzalo2683
·
3Comments
Most helpful comment
Debugging for the mocha-plugin works differently, since we have a few child processes involved.
But that's actually documented:
Solution
Run