Vue-chartjs: Data updated but chart never change
hello . i'm using your package. thanks for your package.
i have one problem .
when i update data , When I change the data, the chart does not change. I was really confused.
id do everything like your documents. please help me .
i have in my LineChart.js :
import {Line, Bar, mixins} from 'vue-chartjs'
const {reactiveProp} = mixins;
export default {
    extends: Line,
    mixins: [reactiveProp],
    props: ['chartData', 'options'],
    mounted() {
        // this.chartData is created in the mixin.
        // If you want to pass options please create a local options object
        this.renderChart(this.chartData, this.options);
    },
}
and in my transaction_reports_chart.vue i have:
<template>
    <div class="small">
        <line-chart :chartData="dataCollection" :options="chartOptions"></line-chart>
    </div>
</template>

<script>
    import LineChart from './LineChart.js'

    export default {
        props: ['inData', 'inOptions'],
        components: {
            LineChart
        },
        data() {
            return {
                dataCollection: null,
                chartOptions: null,
            }
        },
        created() {
            this.dataCollection = this.inData;
            this.chartOptions = this.inOptions;
        },
        updated() {
            this.dataCollection = this.inData;
            this.chartOptions = this.inOptions;
        },
    }
</script>

<style scoped>
    .small {
        width: 100%;
        margin: 0 auto;
    }

    #line-chart {
        height: 650px !important;
    }
</style>
and in transaction_reports.vue i have :
<template>
<div class="col-md-12">
            <transaction_reports_chart :inData="chartData" :inOptions="chartOption"></transaction_reports_chart>
        </div>
</template>
<script>
    import transaction_reports_chart from "./transaction_reports_chart.vue";

    export default {
        name: "transaction_reports",
        mixins: [translate, errors],
        components: {
            loading: loading,
            transaction_reports_chart: transaction_reports_chart
        },
        data: function () {
            return {
                'reportTable': null,
                'chartOption': {
                    responsive: true,
                    maintainAspectRatio: false
                },
                'chartData': {
                    labels: null,
                    datasets: [
                        {
                            label: null,
                            backgroundColor: 'rgba(248,121,121,0.59)',
                            data: null
                        }, {
                            label: null,
                            backgroundColor: 'rgba(29,248,71,0.71)',
                            data: null
                        }
                    ]
                },
                'msg': ''
            }
        },

        methods: {
            async getReportDetails() {

                    try {
                        const bodyFormData = new FormData();
                        bodyFormData.append('from_date', this.from_date);
                        bodyFormData.append('to_date', this.to_date);
                        const response = await axios.post(`${SITE_DOMAIN_LANG}api/acc`, bodyFormData);
                        if (response['data']['status'] == 200) {
                            let res = response['data']['data'];
                            this.reportTable = res['reportTable'];
                            this.chartData.labels = res['chartLabels'];
                            this.chartData.datasets[0].label = res['chartData']['outgoing_transaction_amount'][0];
                            this.chartData.datasets[0].data = res['chartData']['outgoing_transaction_amount'][1];

                            this.chartData.datasets[1].label = res['chartData']['the_sum_of_the_input_transactions'][0];
                            this.chartData.datasets[1].data = res['chartData']['the_sum_of_the_input_transactions'][1];
                        }
                    } catch (error) {
                        console.log(error);
                    }
        },
    }
</script>
please help me :(
All 4 comments
I have same problem, data is updating but not chart. All settings by docs.
Got this working by making sure was being strict in using chartData prop to pass all chart data. Mixin uses this prop.
Also make sure to import mixins like so:
import { HorizontalBar, Line, mixins } from "vue-chartjs";
const { reactiveProp } = mixins;
I have the same problem. I'm not entirely sure what you're doing different from the OP though, @raisonon?
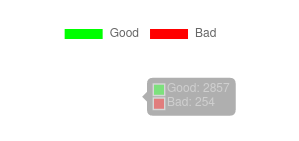
It seems like for me, the numbers update (eg. if I hover over the chart the numbers are up to date) but the chart is visualizing the wrong data.

(This is supposed to be a pie chart, and it updates correctly if I click the "Good" or "Bad" items in the legend.)
Ah, I was able to get this to work and pinpoint some problems in the OP:
    mixins: [reactiveProp],
    props: ['chartData', 'options'],
This is wrong: reactiveProp already adds its own chartData, so adding it manually is not needed.
Secondly:
<line-chart :chartData="dataCollection" :options="chartOptions"></line-chart>
This is also wrong: :chartData doesn't actually bind to the chartData prop, you need to use :chart-data instead.
And lastly, reactiveProp will only render any changes if you modify the entire object. This might be a bug? I'm not entirely sure. Either way, take for example the following, which is wrong:
this.chart.datasets[0].data = [ 123, 456 ];
But this is right:
this.chart = {
  // ...
};
Most helpful comment
Ah, I was able to get this to work and pinpoint some problems in the OP:
This is wrong:
reactivePropalready adds its ownchartData, so adding it manually is not needed.Secondly:
This is also wrong:
:chartDatadoesn't actually bind to thechartDataprop, you need to use:chart-datainstead.And lastly,
reactivePropwill only render any changes if you modify the entire object. This might be a bug? I'm not entirely sure. Either way, take for example the following, which is wrong:But this is right: