Vscode: Debugger output is laggy and janky when scrolling
When scrolling up on fresh output in the debugging console while running a flutter app, it's very janky and doesn't scroll. After you've "viewed" it at least once then it scrolls up/down fine in the future.
This regression happened sometime recently after upgrading to 1.50.
Screenshots
https://i.imgur.com/dpMBVl3.mp4
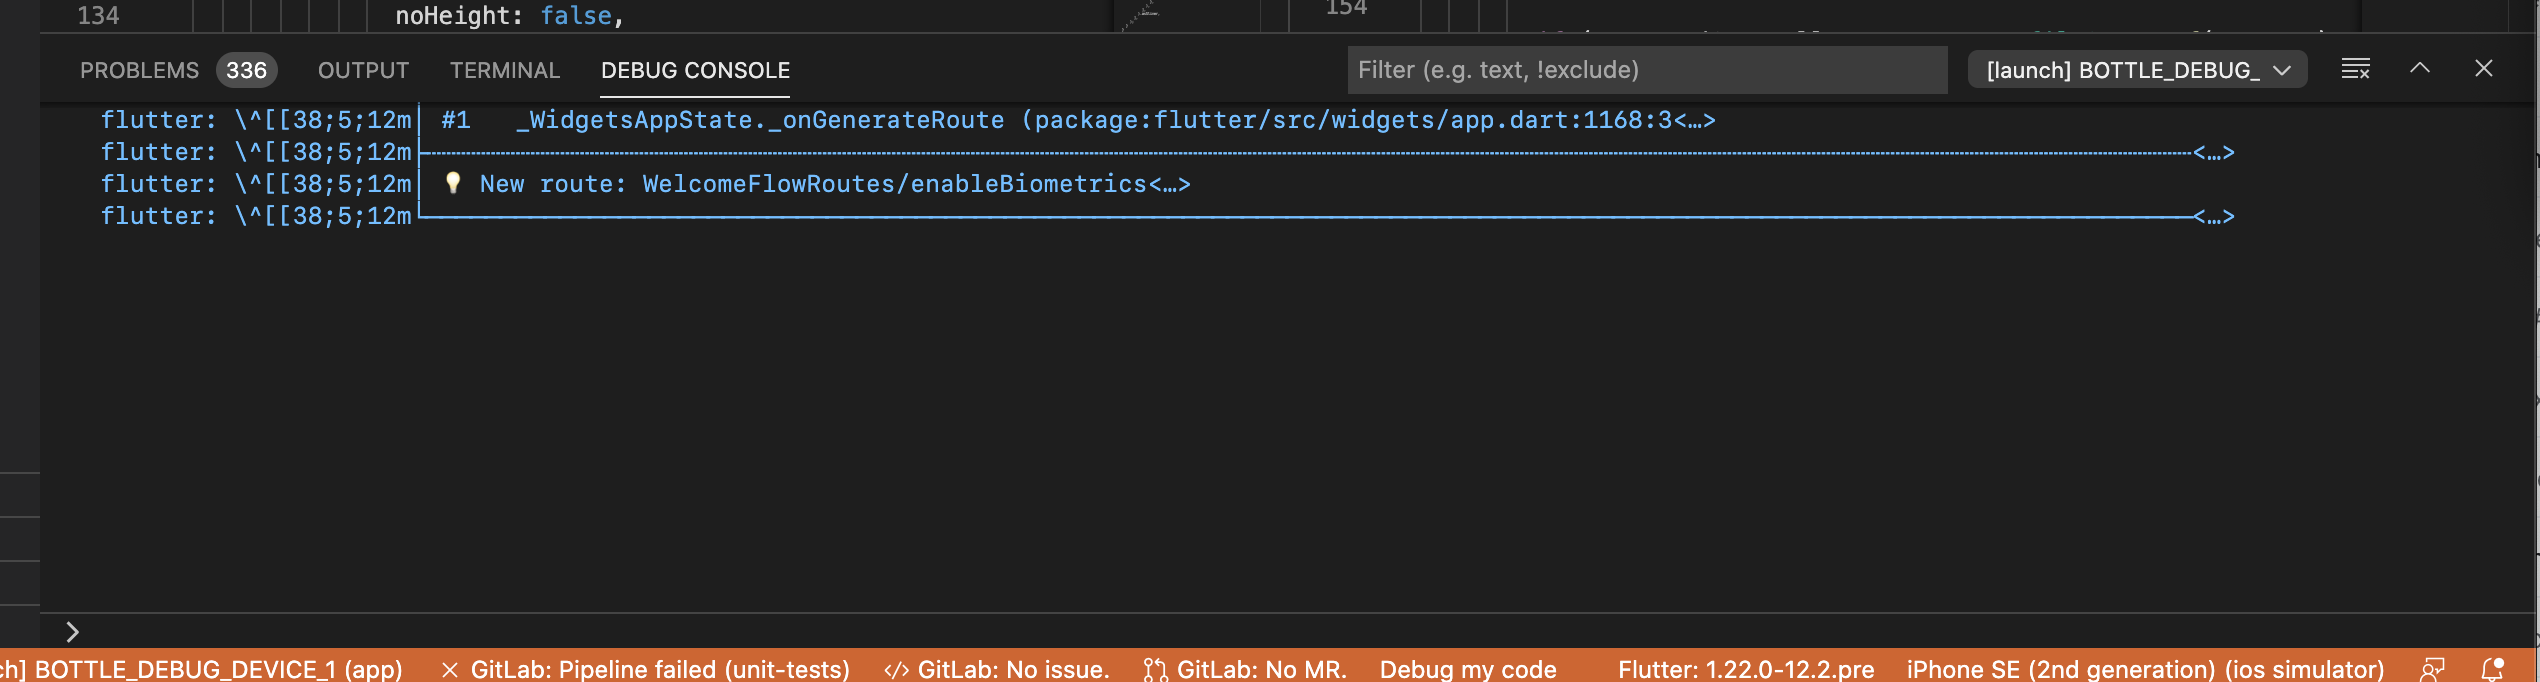
It's also adding lots of whitespace to the end of each line printed so you have to scroll up:
I originally reported the issue to the Dart-Code extension but was told it looks like a bug in VSCode and to submit it here. Original issue: https://github.com/Dart-Code/Dart-Code/issues/2829
- VSCode Version:
Version: 1.50.0-insider
Commit: 772aa0723f7f6b04b710bc3a92b7a904b60ef439
Date: 2020-09-28T05:41:42.988Z (15 hrs ago)
Electron: 9.3.0
Chrome: 83.0.4103.122
Node.js: 12.14.1
V8: 8.3.110.13-electron.0
OS: Darwin x64 19.6.0
- OS Version:
macOS Catalina 10.15.6
Steps to Reproduce:
- Run any flutter app.
- Try to scroll on some output in the debugging area.
Does this issue occur when all extensions are disabled?: Yes/No
I cannot test because I need extensions to use the debugger and view the debugger output.
 acoutts
All 30 comments
@acoutts thanks for filling this. Can you reproduce this issue with VS Code stable 1.49.2? If you can not then it seems like something broke in insiders.
I do not have dart setup and I can not repro with Node.
Is there new output coming in while you are scrolling? Or is there anything special going on?
 isidorn
on 29 Sep 2020
isidorn
on 29 Sep 2020
cc @DanTup as he might be able to explain more about what's being piped in there, but I believe it's just stdout/stderr.
I just tested on 1.49.2 and it looks to be fine on that, so it's something changed in a recent insiders build.
acoutts
on 29 Sep 2020
Is it possible to create a minimal reproducable case and put it on GitHub so I can clone this on my machine and investigate further?
isidorn
on 29 Sep 2020
Yeah, it should just be stdout/stderr from the Flutter process (though we do have some detection of stack frames to attach location metadata to the OutputEvents).
I don't know if it's related, but in https://github.com/Dart-Code/Dart-Code/issues/2733#issuecomment-679160269 it was noted that there's some weird escaping on Flutter's part (I can see that in the screenshot above). I'm not sure if that matters here though.
@acoutts are there new lines being added to the output while this is happening? Can you repro in a simple project created with the *Flutter: New Project command?
 DanTup
on 29 Sep 2020
DanTup
on 29 Sep 2020
I've found something interesting - it only happens when using the logger library to print: https://pub.dev/packages/logger
But still, something has recently changed in code vs insiders that's broken it, with the logger library staying fixed.
- First download flutter: https://flutter.dev/docs/get-started/install
- Clone the test project: https://github.com/acoutts/vscode_issue_107704
- Add the project folder to your vscode workspace.
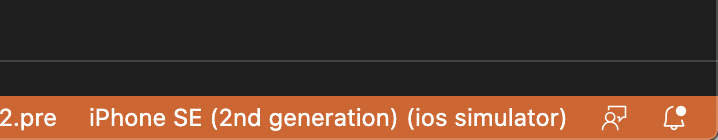
- Start an iOS or Android emulator, or plug in a device you have.
- Select the device in the lower right corner of vscode:
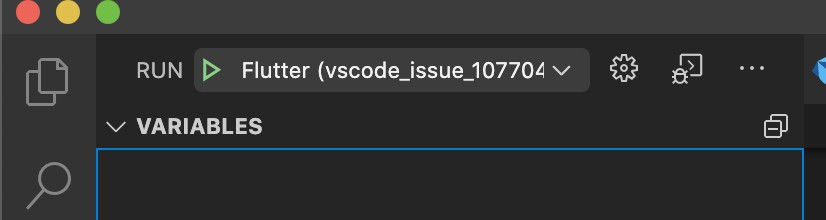
- Click the play button in the debugging tab with the
Flutter (vscode_issue_107704)profile selected:
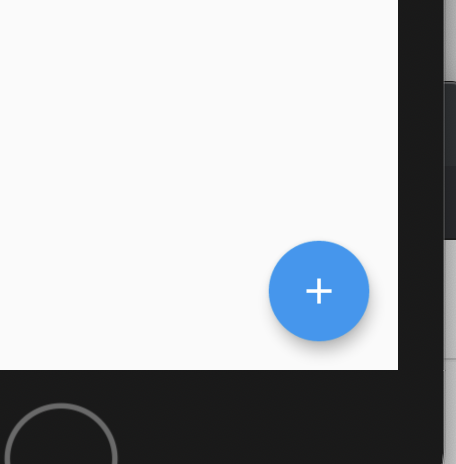
- Tap the plus button in the lower right to trigger some debug output
- Observe the extra space printed in the debug console and the scroll jank when you try to scroll up slowly, which prevents you from actually scrolling up.
acoutts
on 29 Sep 2020
@isidorn did you get a chance to try that out?
acoutts
on 5 Oct 2020
Just want to report it's still happening on the latest insiders:
Version: 1.50.0-insider
Commit: 93c2f0fbf16c5a4b10e4d5f89737d9c2c25488a3
Date: 2020-10-07T00:58:35.624Z (2 days ago)
I saw this today on stable (1.50.0) but it was when I was running the Dart extension's tests (and scrolling up through a lot of output they were writing) so it's seems unrelated to Dart, because the extension is written in TypeScript.
It was the Mocha coloured output from the tests (similar to the VS Code extension sample project would have). I ran a test run, the debug session ended, and it scrolled really far down leaving a big empty space at the bottom. As I scrolled up, the scrolling would sometimes jitter around.
It only occurred on one debug run out of 20-30 though, and I couldn't reproduce it afterwards.
DanTup
on 12 Oct 2020
I too see this issue, both with Flutter debug output and sometimes with node development output. I don't have the Logger plugin as mentioned by @acoutts
Using the mousewheel to scroll up the debug output is painful, more like scroll up 2 lines and back 1 for every line.
Weirdly, if I select some text in the debug output the problem immediately disappears and scrolling is fine, only to resurface with later output.
Version: 1.50.0 (user setup)
Commit: 93c2f0fbf16c5a4b10e4d5f89737d9c2c25488a3
Date: 2020-10-07T06:10:52.432Z
Electron: 9.2.1
Chrome: 83.0.4103.122
Node.js: 12.14.1
V8: 8.3.110.13-electron.0
OS: Windows_NT x64 10.0.19041
 1ka
on 13 Oct 2020
1ka
on 13 Oct 2020
I'm having this issue as well, not using flutter or node, but debugging an ASP.NET Core 3.1 application. I am using Serilog in this application if that matters.
Version: 1.50.0 (user setup)
Commit: 93c2f0fbf16c5a4b10e4d5f89737d9c2c25488a3
Date: 2020-10-07T06:10:52.432Z
Electron: 9.2.1
Chrome: 83.0.4103.122
Node.js: 12.14.1
V8: 8.3.110.13-electron.0
OS: Windows_NT x64 10.0.18363
 lwestfall
on 14 Oct 2020
lwestfall
on 14 Oct 2020
This is really making it hard to use VSCode now. Is anyone actively looking into it yet?
acoutts
on 15 Oct 2020
Agreed, it's very frustrating. What info is needed to remove the needs more info tag?
lwestfall
on 15 Oct 2020
Everyone please help upvote the issue for more visibility.
acoutts
on 15 Oct 2020
Having the same issue trying to debug a dotnet core application on linux. This just started happening after updating to 1.50
Version: 1.50.0
Commit: 93c2f0fbf16c5a4b10e4d5f89737d9c2c25488a3
Date: 2020-10-07T06:01:33.073Z
Electron: 9.2.1
Chrome: 83.0.4103.122
Node.js: 12.14.1
V8: 8.3.110.13-electron.0
OS: Linux x64 5.2.9-200.fc30.x86_64
 archon52
on 16 Oct 2020
archon52
on 16 Oct 2020
I think this issue is related to line wrapping in the output window.
When lines that wrap scroll out of the window, the view/viewport erroneously jumps up an extra line. Looks really bad when a batch of long lines scrolls up as the next debug appears half way up the view.
1ka
on 27 Oct 2020
@1ka you may be on to something there, I notice it frequently with debug messages that log SQL queries from EF Core (which of course end up being several lines long at minimum). You can also see in the OP that the scrolling seems to trip up as soon as that multiline output appears.
lwestfall
on 27 Oct 2020
@lwestfall I'm seeing the same thing with an EF Core project i am working on. To add to this though, it seems to only be an issue the first time you try to scroll through the logs after they are generated. If i'm running my project and refresh the page, several ef queries are output to the logs. If i try to scroll up the scrolling is broken, but once i scroll to the entries from before the refresh everything works fine. I can then scroll back and forth through the whole debug log without any issues.
archon52
on 27 Oct 2020
Seems it happens when a lot of lines output to the debug console. But it is very common case.
When there are a lot of lines output to the debug console, it auto scrolls to somewhere EXCEEDS the BOTTOM, leaving a blank in the bottom part of the debug console. Sometimes all of the debug console becomes blank. The position is not constant. So as the program keeps on printing debug logs, the debug console will be flickering with random blank area. Even when I stop at a break point, it is hard to scroll up back to the REAL END of logs. It will take me several scrolls to achieve it.
 szmcdull
on 28 Oct 2020
szmcdull
on 28 Oct 2020
Is anyone seeing this that is not using Flutter?
If yes do you have exact reproducable steps?
isidorn
on 2 Nov 2020
I see it using .NET Core 3.1, where any logging to the debug window with multiple lines in a single log message causes the issue. Unfortunately I can't share my repo due to confidentiality, but I might be able to whip up a repro sample console app?
Version: 1.50.1 (user setup)
Commit: d2e414d9e4239a252d1ab117bd7067f125afd80a
Date: 2020-10-13T15:06:15.712Z
Electron: 9.2.1
Chrome: 83.0.4103.122
Node.js: 12.14.1
V8: 8.3.110.13-electron.0
OS: Windows_NT x64 10.0.18363
@lwestfall that would be useful. If it is is just single log message with mutpile lines then I can also try to repro with JS
isidorn
on 2 Nov 2020
@isidorn It was naive of me to assume this would be so easy to reproduce. I made a sample console app that logs a random message (sometimes single line, sometimes multi line) and I wasn't getting the problem initially. Eventually though I was able to get it to jankify consistently. It might have had to do with waiting until the output was sufficiently full. Anyway here you go, see readme for steps:
lwestfall
on 2 Nov 2020
3. Go to debug console. Try to scroll up.
4. Keep trying to scroll up.
5. Repeat steps 3-4 until angry.
🤣
@isidorn It was naive of me to assume this would be so easy to reproduce. I made a sample console app that logs a random message (sometimes single line, sometimes multi line) and I wasn't getting the problem initially. Eventually though I was able to get it to jankify consistently. It might have had to do with waiting until the output was sufficiently full. Anyway here you go, see readme for steps:
 SoftWyer
on 2 Nov 2020
SoftWyer
on 2 Nov 2020
@lwestfall I tried reproducing this using your program just slightly changed for JS (I only use numbers, not words). And I was unable to reproduce the issue (waiting 15 minutes for the output to be really long). I tried switching to the terminal and back to debug console and all was good.
Here's my example code.
If somebody has ideas on how to modify this to reproduce I am open for suggestions.
Thanks!
setInterval(() => {
    var count = Math.random() * 50;
    var message = Date.now() + 'new log message: ';
    for (var i = 0; i < count; i++) {
        message += ' ' + Math.random();
    }
    console.log(message);
}, 200);
@isidorn thanks for looking into it. I wonder if this could be related to settings somehow? I tried my repo on another machine (info below) and it still stutters when scrolling up, but I sync my settings so that's one commonality other than Windows 10. If you're still interested in troubleshooting, I've added my user settings.json to my repo just in case that leads to any hints. I've also tweaked the repro steps (basically, do not start/wait with debug console open, not sure how much that matters).
I was curious if new debug messages were causing the scrolling to stutter, so I paused the debugger. Still got the stuttering when the debugger was paused.
I did also try your code on my machine (using stable Node.js) and the scrolling was still stuttering, so this makes me wonder again if this is user settings or otherwise environment related. I tried your code with all extensions disabled, same problem.
Another thing I noticed, not sure if related/normal: when I switch from terminal to debug console, the end of the debug output starts out at the top with blank space for most of the bottom of the console, then when new messages come it it fills the rest of the console (gif below). Almost like it's scrolled past the end of the messages, if that makes sense. Again, could be completely normal but something I noticed.
Finally I will note that sometimes, the scrolling works fine for me too. When it works fine I will restart the debugger and try again and usually the scrolling isn't working right the next time.
Thanks again for spending time on this.
My 2nd machine info:
Version: 1.50.1 (user setup)
Commit: d2e414d9e4239a252d1ab117bd7067f125afd80a
Date: 2020-10-13T15:06:15.712Z
Electron: 9.2.1
Chrome: 83.0.4103.122
Node.js: 12.14.1
V8: 8.3.110.13-electron.0
OS: Windows_NT x64 10.0.19041
Gif of your js running, and janky scrolling.
lwestfall
on 4 Nov 2020
I couldn't reproduce the problem using @isidorn's code, but a similar idea to run it from multiple files with some of my own output does produce the case where the log stops 1/2 up the page but scrolling is mostly OK.
(and I'll thank you for not judging the code ;-) )
SoftWyer
on 4 Nov 2020
Another thing I noticed, not sure if related/normal: when I switch from terminal to debug console, the end of the debug output starts out at the top with blank space for most of the bottom of the console
I always notice this when I have the issue too. The console seems to have "scrolled down" way too far, and then the scrolling is janky.
FWIW it's macOS where I see this - a MacBook Pro, running VS Code on the built-in screen with the debug console being around 3/4 of the width. I think there are always wrapped lines when I see it, though I don't think it happens consistently.
DanTup
on 4 Nov 2020
@DanTup I just realized that @szmcdull reported that same behavior as well before I did. Hopefully it's a clue, but I haven't noticed if this behavior exists when scrolling is working okay so it could just be a separate quirk.
lwestfall
on 4 Nov 2020
As a workaround I think setting "debug.console.wordWrap": false should work around this issue, however then you will not get word wrapping.
isidorn
on 10 Nov 2020
Thanks @isidorn , I can confirm the workaround does work for me so hopefully that hints at the issue.
lwestfall
on 10 Nov 2020
Related issues
 v-pavanp
·
3Comments
v-pavanp
·
3Comments
 sirius1024
·
3Comments
sirius1024
·
3Comments
 VitorLuizC
·
3Comments
VitorLuizC
·
3Comments
 mrkiley
·
3Comments
mrkiley
·
3Comments
 philipgiuliani
·
3Comments
philipgiuliani
·
3Comments
Most helpful comment
This is really making it hard to use VSCode now. Is anyone actively looking into it yet?