Vscode: Debug Node Auto Attach is not working
- VSCode Version:1.47.2
- OS Version: Linux x64 5.4.0-42-generic
Version: 1.47.2
Steps to Reproduce:
- I have attached debug node like this:
{
"debug.node.autoAttach": "on"
}
when I run :
node --inspect=0 index.js
debugger is not runnung
It used to work for VS Code Version: 1.47.1
Does this issue occur when all extensions are disabled?: Yes
 Gribesh
All 31 comments
Please follow the instructions here: https://github.com/microsoft/vscode/issues/102057#issuecomment-657728467
/duplicate
 connor4312
on 26 Jul 2020
connor4312
on 26 Jul 2020
Thanks for creating this issue! We figured it's covering the same as another one we already have. Thus, we closed this one as a duplicate. You can search for existing issues here. See also our issue reporting guidelines.
Happy Coding!
 vscode-triage-bot
on 26 Jul 2020
vscode-triage-bot
on 26 Jul 2020
I tried to run this coomand:
echo $VSCODE_INSPECTOR_OPTIONS | awk '{if(match($0, /"([^"]+.deferred)"/,m))print m[1]}' | xargs rm
but it says
rm: missing operand
Try 'rm --help' for more information.
Also I have downloaded the latest nightly extension but it's not working. While running with --inspect it says
Debugger listening on ws but there is no separate debug bar.
Gribesh
on 27 Jul 2020
@connor4312
103373
I downloaded VS Code Insider version and tried running same command
node --inspect=0 index.js
but debugger node is not auto attached.
I need to go to
ctrl+shif+p
Debug: Attach to node process (preview) to attach debuuger node.
Gribesh
on 27 Jul 2020
@weinand have you run into this before? Auto attach is now using node-debug
connor4312
on 27 Jul 2020
@connor node-debug based autoattach never worked for "--inspect=0" because the mechanism looks at the command line and does not do any output scraping or port sniffing. So this is expected.
I was under the assumption that you would make js-debug based auto-attach behave like node-debug based auto-attach by only enabling it when the node process has a command line argument that indicates debugging. I wasn't aware that you are now completely relying on node-debug. This of course will result in idiosyncrasies like this.
 weinand
on 27 Jul 2020
weinand
on 27 Jul 2020
I disabled js-debug's auto attach for now in a recovery release due to several issues that came up, so 1.47.2 is using the previous auto attach functionality.
connor4312
on 27 Jul 2020
@weinand and @connor4312
I have tried making index.js file with
console.log("HELLO World");
tried debuggin with
node --inspect-brk index.js
with debug "Auto Attach : 0N" but it's not working either.
Gribesh
on 28 Jul 2020
I just tried this on macOS in VS Code 1.47.3 but it works fine for me:
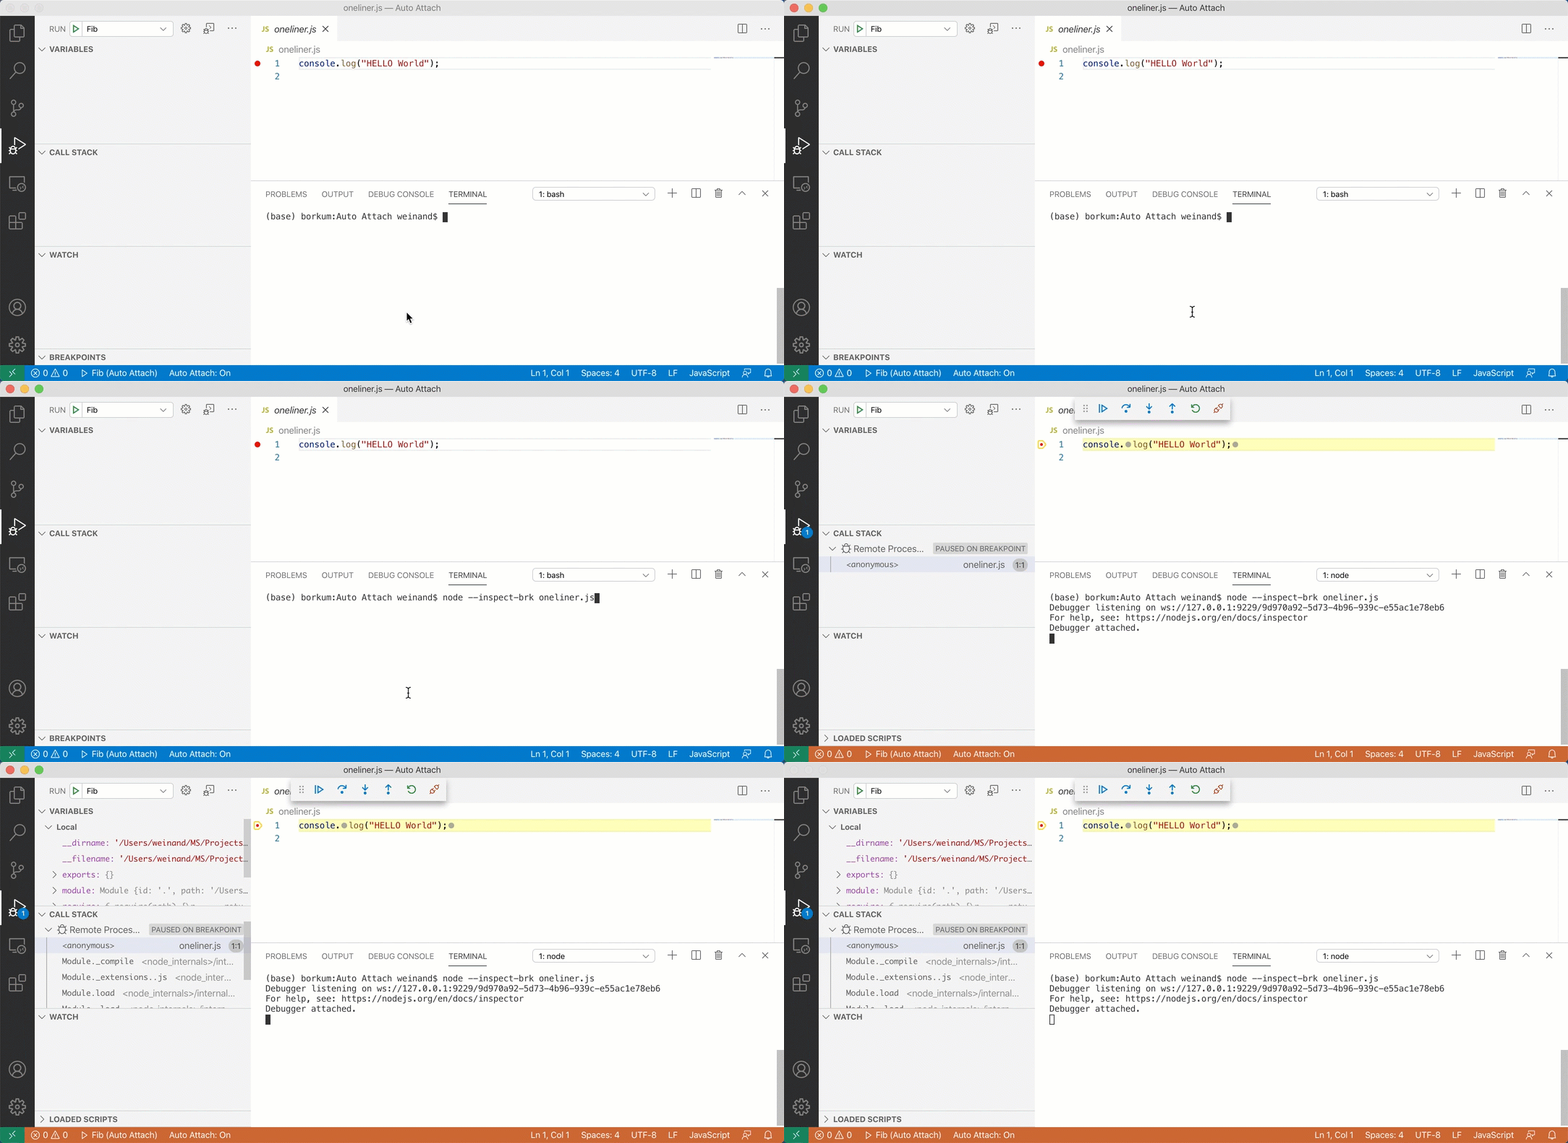
Just make sure to have a breakpoint otherwise the one liner runs to completion immediately and your session ends.
weinand
on 28 Jul 2020
Hey @weinand , I tried debugging with adding breakpoint like yours. I have also tried uninstalling and reinstalling vs vode and tried with diffrent version as well.
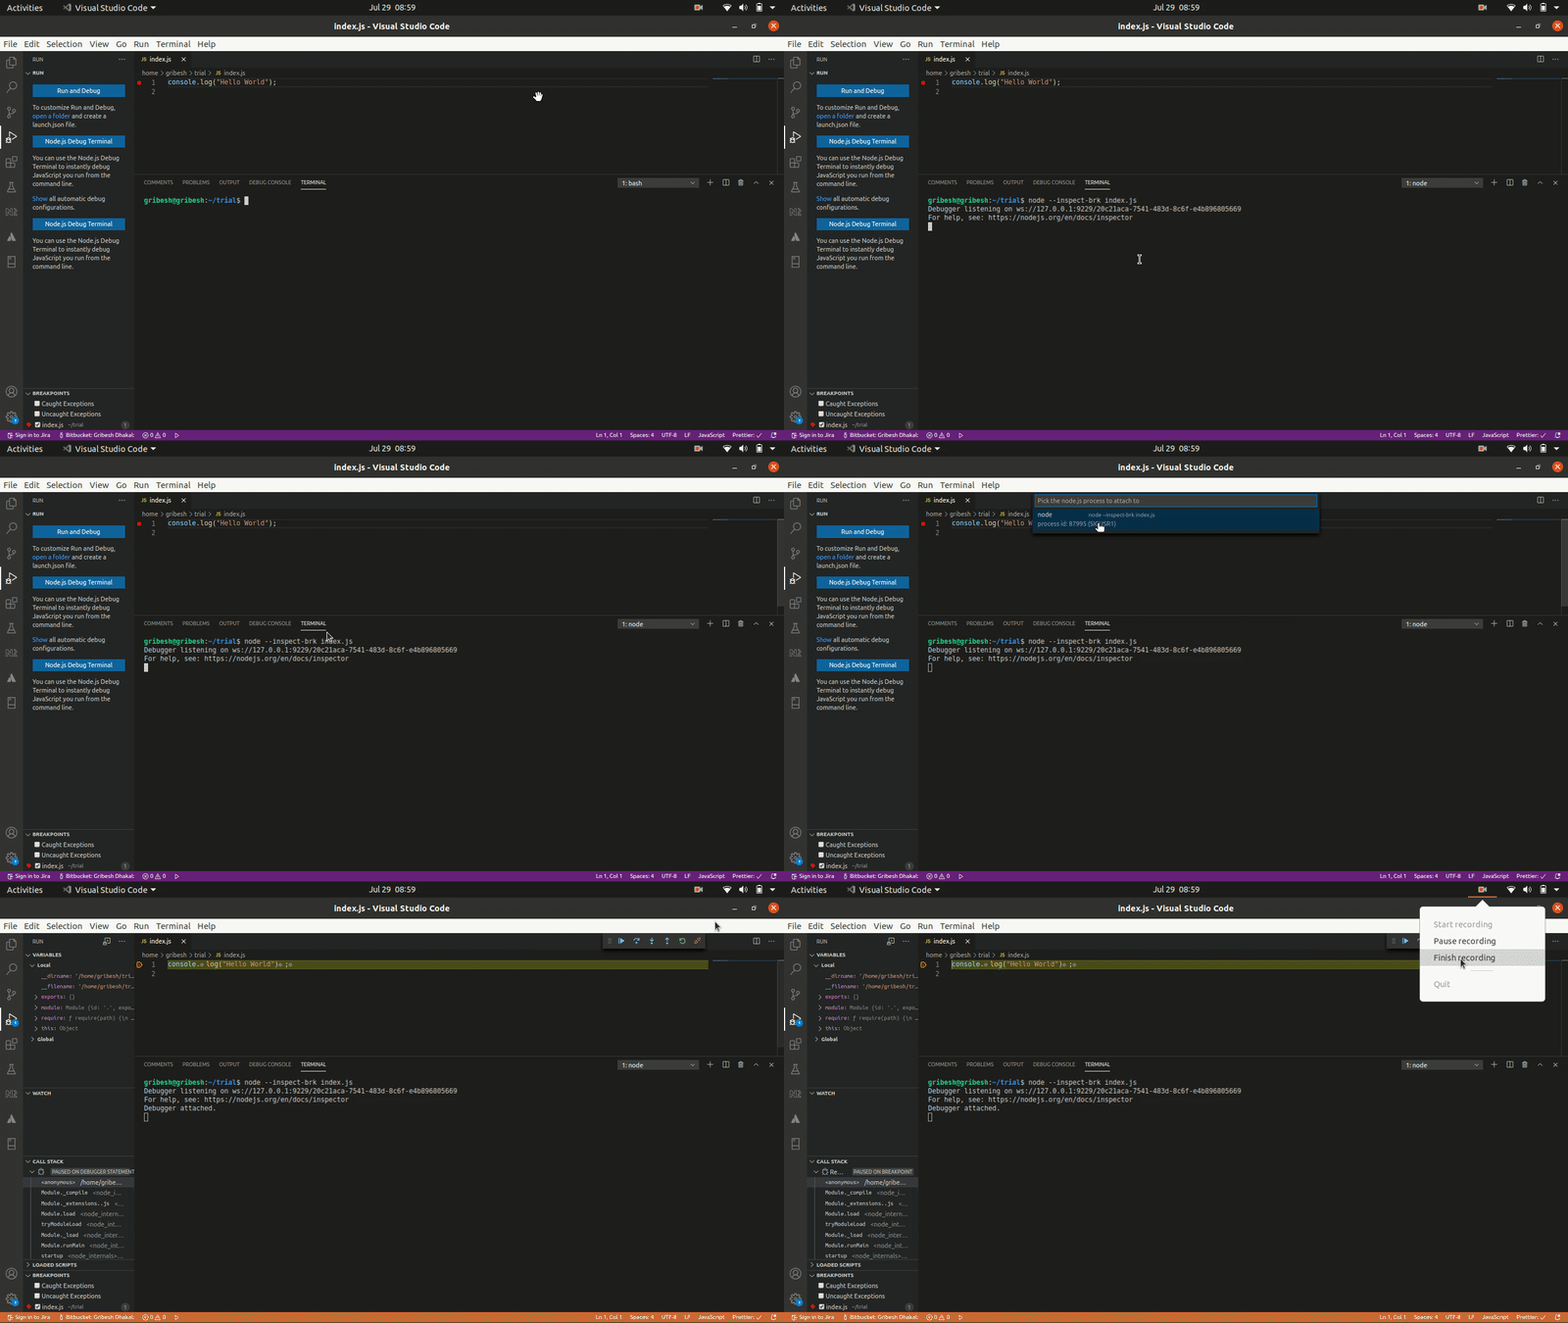
It's not working for me. I have to separately add using Ctrl+Shift+P then "Debug:Attach to Node Process" and select process id.
Current Version:
Version: 1.47.2
Date: 2020-07-15T18:22:15.161Z
Electron: 7.3.2
Chrome: 78.0.3904.130
Node.js: 12.8.1
V8: 7.8.279.23-electron.0
OS: Linux x64 5.4.0-42-generic
Gribesh
on 29 Jul 2020
It looks like auto attach isn't on -- there's no Auto Attach: On badge in the status bar
connor4312
on 29 Jul 2020
Tried with that also not working 😔😞
Gribesh
on 29 Jul 2020
vscode spec details
Version: 1.48.0-insider
Commit: db40434f562994116e5b21c24015a2e40b2504e6
Date: 2020-08-12T08:04:29.917Z
Electron: 7.3.2
Chrome: 78.0.3904.130
Node.js: 12.8.1
V8: 7.8.279.23-electron.0
OS: Linux x64 5.4.0-42-generic snap
I'm also experiencing the same issue. When running node --inspect-brk file.js and having Auto Attach: On it will not auto-attach to vscode debugger automatically. Outputs the following:
Debugger listening on ws://127.0.0.1:9229/c982c217-dfb1-4e0c-9492-71075fe839f6
For help, see: https://nodejs.org/en/docs/inspector
I'm able to debug it using chrome://inspect.
 sergio-domingues
on 13 Aug 2020
sergio-domingues
on 13 Aug 2020
@weinand @connor4312
Can you please help with this issue. Even I am not able to use it using --inspect-brk . I have to attach node process using ctrl+shif+p
Gribesh
on 13 Aug 2020
I can reproduce the "auto attach" problem on Ubuntu linux 20.04 LTE.
Most likely the output format of the "ps" command has changed and we fail to parse it correctly.
Workarounds:
- just create a launch config and use that by pressing F5
- use the "Attach to Node Process" command via F1 and select your process
@connor4312 I tried to use the "Create JavaScript Debug Terminal" from the Terminal drop-down menu but nothing showed up. Is this supposed to work?
weinand
on 13 Aug 2020
I tried to use the "Create JavaScript Debug Terminal" from the Terminal drop-down menu but nothing showed up. Is this supposed to work?
Yes. It may take a moment to activate the extension and should then open a terminal. Any errors in your dev tools?
connor4312
on 13 Aug 2020
@connor4312 VS Code thinks my node.js version is outdated, but running node --version in the terminal doesn't confirm this:

Are we no longer using VS Code's built-in node.js?
node-debug and node-debug2 was always using the built-in version to be independent from the user's version...
weinand
on 13 Aug 2020
We verify the Node.js version the user has since we dropped support for the old protocol in Node <8. We also use it to determine whether certain functionality is available (spaces in paths, and soon https://github.com/microsoft/vscode-js-debug/issues/558)
Is /usr/local/bin/node not the Node that's in your PATH? What's which node? This is the logic that does the detection (which got a little complex due to Electron handling).
Not handling that error is of course a bug, I will put in a fix to turn that into a notification.
connor4312
on 13 Aug 2020
When starting VS Code from the UI (linux), "/usr/local/bin/node" is on the PATH, and that version is indeed very old.
When starting VS Code via the command line, everything is fine.
So I never had a problem with the old node.js version because in a terminal I don't have it on the PATH.
And previous versions of VS Code never had a problem with the old version, because they are not relying on the version from the PATH because they use the built-in one.
Showing notification instead of crashing is a good first step.
But it my case even the notification would be confusing because when running node --version from the integrated terminal, I don't see the old version...
weinand
on 13 Aug 2020
Hm, okay. I'm guessing you have nvm or something which sets up the CLI path but is not applied when launching from UI.
For the debug terminal specifically, we're running in a terminal so the 'real' executions should use the more up to date version, but /usr/local/bin/node is what we would launch user programs with, so the error is appropriate.
I could run which node/where node in a real terminal rather than just a child process, but this is heavier weight. It looks like node-debug2 also used the same PATH-based lookup to resolve the runtimeExecutable (rather than using the VS Code built in version). I haven't seen the problem be raised by other users before, but this is something that's hard to notice outside of certain scenarios, so I'm not sure how common it is.
connor4312
on 13 Aug 2020
Yes, I'm using "nvs".
Just to be clear: we never use the built-in node.js for running the user program (debuggee). We only use the built-in node.js for running VS Code's extensions hosts and debug adapters (so that there are no surprises).
For the debuggee we use what the user has installed (which is what we find on the PATH). This is true for node-debug and node-debug2. This seems to work fine even in the "JS debug terminal".
The only problem is that the "outdated check" does not seem to run in the same context as the debuggee. And that results in mixed messages...
weinand
on 13 Aug 2020
Yes, I think we misunderstood -- the check is intended to verify the version that the debugee runs so we know that it's capable to be debugged, and what other capabilities we can provide to it 🙂
I'll explore running the lookup in a non-interactive terminal and seeing what kind of overhead that has. If performant I would prefer to use that for both terminals and normal debugging, since you would run into the exact same issue there.
connor4312
on 13 Aug 2020
@Gribesh can you let us know if this works on Insiders with the setting "debug.javascript.usePreviewAutoAttach": false?
connor4312
on 4 Sep 2020
@connor4312 Thank you for letting me know about the latest updates. I have tried using the suggested workspace setting but its not working for me. Like previous I have to attach node process using ctrl+shif+p
Information VS Code- Insiders
Version: 1.49.0-insider
Date: 2020-09-04T05:40:12.165Z
Electron: 9.2.1
Chrome: 83.0.4103.122
Node.js: 12.14.1
V8: 8.3.110.13-electron.0
OS: Linux x64 5.4.0-45-generic

Gribesh
on 4 Sep 2020
@Gribesh thanks for trying.
Will investigate in September...
weinand
on 4 Sep 2020
@weinand may not worth the time since this mode of auto attach is being replaced soon.
connor4312
on 4 Sep 2020
Yes, and this mode of auto attach doesn't work on macOS either, so the problem is unrelated to the linux-issue at hand anyway.
weinand
on 4 Sep 2020
Okay waiting for new feature. 😊🎉
Gribesh
on 5 Sep 2020
@connor4312 @weinand
Visual Studio Code
Version : 1.49.0
Debug Auto Attach Node is working.
Gribesh
on 13 Sep 2020
I have same problem with 1.49.1 vscode version.
If I add to configuration:
"debug.javascript.usePreviewAutoAttach": false
Auto Attach funcionality work.
 xhermosilla
on 29 Sep 2020
xhermosilla
on 29 Sep 2020
Please provide additional details around the scenario you're hitting.
connor4312
on 29 Sep 2020
Related issues
 sijad
·
3Comments
sijad
·
3Comments
 omidgolparvar
·
3Comments
omidgolparvar
·
3Comments
 chrisdias
·
3Comments
chrisdias
·
3Comments
 v-pavanp
·
3Comments
v-pavanp
·
3Comments
 trstringer
·
3Comments
trstringer
·
3Comments
Most helpful comment
@connor4312 @weinand
Visual Studio Code
Version : 1.49.0
Debug Auto Attach Node is working.