Issue Type: Bug
Hi,
After my VS Code updated to the latest version for some reason i can no longer place a breakpoint anywhere in my code.
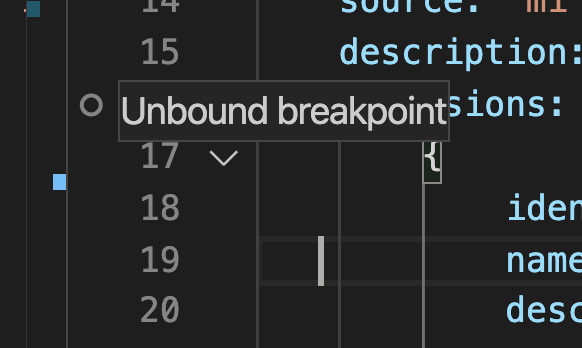
When i place a breakpoint, it gives the round circle without red and it says "Unbound breakpoint".
This is a little bit disappointed.
Below is the launch.json configuration:
{
// Use IntelliSense to learn about possible attributes.
// Hover to view descriptions of existing attributes.
// For more information, visit: https://go.microsoft.com/fwlink/?linkid=830387
"version": "0.2.0",
"configurations": [
{
"type": "chrome",
"request": "launch",
"name": "Chrome - CIS5",
"url": "https://localhost:3000",
"webRoot": "${workspaceFolder}",
"sourceMaps": true,
"sourceMapPathOverrides": {
"webpack:///./": "${workspaceRoot}/"
}
}
]
}
VS Code version: Code 1.47.0 (d5e9aa0227e057a60c82568bf31c04730dc15dcd, 2020-07-09T08:02:06.629Z)
OS version: Windows_NT x64 10.0.17763
System Info
|Item|Value|
|---|---|
|CPUs|Intel(R) Core(TM) i7-7820HQ CPU @ 2.90GHz (8 x 2904)|
|GPU Status|2d_canvas: enabled
flash_3d: enabled
flash_stage3d: enabled
flash_stage3d_baseline: enabled
gpu_compositing: enabled
multiple_raster_threads: enabled_on
oop_rasterization: disabled_off
protected_video_decode: enabled
rasterization: enabled
skia_renderer: disabled_off_ok
video_decode: enabled
viz_display_compositor: enabled_on
viz_hit_test_surface_layer: disabled_off_ok
webgl: enabled
webgl2: enabled|
|Load (avg)|undefined|
|Memory (System)|15.85GB (4.57GB free)|
|Process Argv|--folder-uri file:///d%3A/CISV5/trunk|
|Screen Reader|no|
|VM|0%|
Extensions (27)
Extension|Author (truncated)|Version
---|---|---
Bookmarks|ale|11.3.1
npm-intellisense|chr|1.3.0
path-intellisense|chr|2.2.1
bracket-pair-colorizer|Coe|1.0.61
dart-code|Dar|3.12.2
flutter|Dar|3.12.2
vscode-eslint|dba|2.1.6
EditorConfig|Edi|0.15.1
tortoise-svn|fan|0.1.1
vscode-firefox-debug|fir|2.9.0
auto-close-tag|for|0.5.8
auto-rename-tag|for|0.1.4
vscode-peacock|joh|3.7.2
csharp|ms-|1.22.1
mssql|ms-|1.9.0
python|ms-|2020.6.91350
powershell|ms-|2020.6.0
vscode-typescript-tslint-plugin|ms-|1.2.3
debugger-for-chrome|msj|4.12.9
vetur|oct|0.24.0
tslint-vue|pro|1.5.6
vue-vscode-snippets|sdr|1.9.0
code-spell-checker|str|1.9.0
vscodeintellicode|Vis|1.2.9
vscode-icons|vsc|10.2.0
vscode-todo-highlight|way|1.0.4
JavaScriptSnippets|xab|1.8.0
(2 theme extensions excluded)
 billyson
All 119 comments
Also experiencing the same issue with 1.47.0 debugging babel-node
{
"configurations": [
{
"type": "node",
"request": "launch",
"name": "Debug",
"program": "${workspaceFolder}/src/index.js",
"runtimeExecutable": "${workspaceFolder}/node_modules/.bin/babel-node",
"runtimeArgs": ["--nolazy","--trace-deprecation","--trace-warnings"],
}
]
}
Downgrading to 1.46.1 fixes the issue
 inverherive
on 14 Jul 2020
inverherive
on 14 Jul 2020
I am having the same issue with 1.47.0 debugging node js.
I downgraded to 1.46.1 and debugging works again.
"configurations": [
{
"type": "node",
"request": "launch",
"name": "Launch Prospector",
"program": "${workspaceFolder}/dist/server.js",
"preLaunchTask": "npm: build",
"skipFiles": [
"${workspaceFolder}/node_modules//.js",
"
]
}
 cliff-robbins-whcc
on 14 Jul 2020
cliff-robbins-whcc
on 14 Jul 2020
@inverherive For babel, see https://github.com/microsoft/vscode/issues/102152#issuecomment-657799548
@billyson Please collect a trace log using these instructions:
If you're able to, add
"trace": trueto yourlaunch.jsonand reproduce the issue. The location of the log file on your disk will be written to the Debug Console. Share that with us.⚠️ This log file will not contain source code, but will contain file paths. You can drop it into https://microsoft.github.io/vscode-pwa-analyzer/index.html to see what it contains. If you'd rather not share the log publicly, you can email it to [email protected]
@cliff-robbins-whcc if you aren't using Node 8 (https://github.com/microsoft/vscode/issues/102166#issuecomment-657138385) please collect a trace log using the instructions above.
/needsMoreInfo
 connor4312
on 14 Jul 2020
connor4312
on 14 Jul 2020
It's happening to me as well since I updated to 1.47.1 earlier in the day.
edit: just downgraded back to 1.46.0 and the breakpoints are bounding again.
 geisonmcd
on 14 Jul 2020
geisonmcd
on 14 Jul 2020
me too, downgrading to 1.46.1 made it work again.
 piazera
on 14 Jul 2020
piazera
on 14 Jul 2020
Fyi you can set debug.javascript.usePreview: false to temporarily used the old debugger.
However, please collect trace logs using the instructions above so that your issue can be fixed, as this option will eventually go away.
connor4312
on 14 Jul 2020
Fyi you can set
debug.javascript.usePreview: falseto temporarily used the old debugger.However, please collect trace logs using the instructions above so that your issue can be fixed, as this option will eventually go away.
Looks like Debugger for Chrome v 4.12.9 that causes the issue.
billyson
on 14 Jul 2020
Yes, this is the version where redirection to the new debugger was established.
connor4312
on 14 Jul 2020
Upgrade to 1.47.1 today, have same issue.
Seems caused by new js debuger, it is enabled by default.
https://marketplace.visualstudio.com/items?itemName=ms-vscode.js-debug-nightly
This extension is installed by default on all VS Code versions after 1.46.0, however it's not enabled. You can enable it by adding "debug.javascript.usePreview": true to your user settings.
Breakpoint could be bounded after disable debug.javascript.usePreview .
 eric-wei1990
on 15 Jul 2020
eric-wei1990
on 15 Jul 2020
@eric-wei1990 please collect a trace log using the instructions given above.
connor4312
on 15 Jul 2020
@cliff-robbins-whcc thank you for the emailed log. It looks like you're experiencing the same symptoms as the Node 8 issue I linked above (https://github.com/microsoft/vscode/issues/102166#issuecomment-657138385). Do those resolution steps work for you?
connor4312
on 15 Jul 2020
@connor4312 I was able to get it to work with disable debug.javascript.usePreview.
I plan on installing NVM and using node12 as default.
cliff-robbins-whcc
on 15 Jul 2020
@connor4312
I create a demo(https://github.com/eric-wei1990/vscode-debug-test).
This is log when runing this demo, please check~
vscode-debugadapter-2.json.gz
eric-wei1990
on 16 Jul 2020
@eric-wei1990 can you see if you continue to experience the problem on the latest nightly?
connor4312
on 16 Jul 2020
@connor4312
Tried latest nightly


This problem still happens, please check this log:
vscode-debugadapter-4.json.gz
By the way, I'm using VS Code Remote Development for developing.
eric-wei1990
on 16 Jul 2020
Is your program actually running? I don't see any output logged, normally at minimum we'd see "Debugger listening on ...". Do you see stuff in the Debug Console?
connor4312
on 16 Jul 2020
@connor4312
Actully, there is no Debugger listening on .. in DEBUG CONSOLE.

But the program can runing.

eric-wei1990
on 16 Jul 2020
Interesting. If you add this line to your program, does anything get echoed? console.log(process.env.NODE_OPTIONS, process.env.VSCODE_INSPECTOR_OPTIONS)?
connor4312
on 16 Jul 2020
Nothing outputed after adding console.log(process.env.NODE_OPTIONS, process.env.VSCODE_INSPECTOR_OPTIONS).

eric-wei1990
on 16 Jul 2020
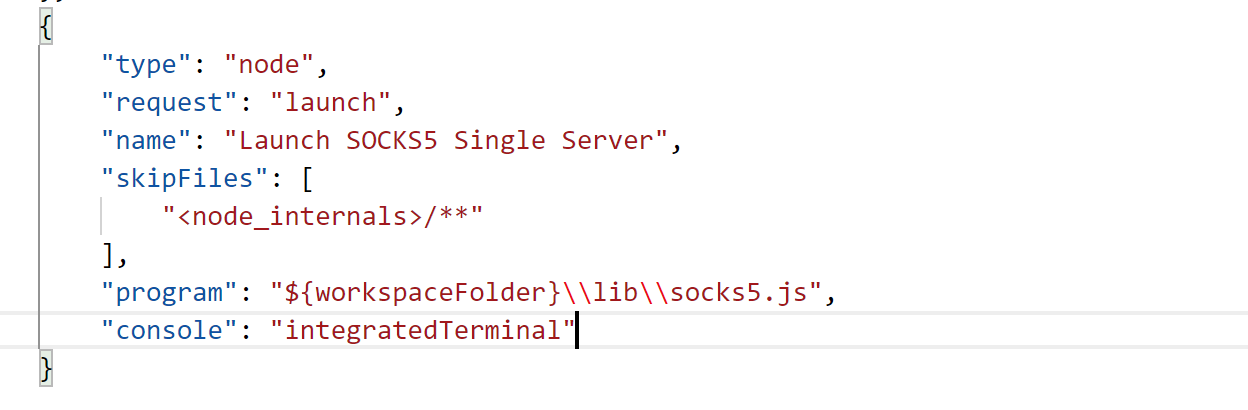
Okay, last thing -- add "console": "integratedTerminal", to the launch.json and share the output. Either one of two things is happening:
- For some reason js-debug isn't setting the environment variables necessary to debug the program
- Something in your environment is preventing the debugged process from receiving the variables
When you run it on the internal console, the environment variables will be printed out and set on the command line so we can verify whether they're present.
connor4312
on 16 Jul 2020
adding "console": "integratedTerminal"

eric-wei1990
on 16 Jul 2020
Alright, interesting. Looks like the variables are set, but the bootloader isn't triggering debug mode.
I created a special build of js-debug with additional logging if you're able to give it a shot. The additional logs will appear right in the console: https://memes.peet.io/img/js-debug-nightly-for-102492.vsix (Install using the "Install from VSIX" command)
connor4312
on 16 Jul 2020
Unable to install this vsix(https://memes.peet.io/img/js-debug-nightly-for-102492.vsix)

eric-wei1990
on 16 Jul 2020
Whoops. Try again: https://memes.peet.io/img/js-debug-nightly-for-102492-again.vsix
connor4312
on 16 Jul 2020
console after installing that vsix

eric-wei1990
on 16 Jul 2020
Alright. For some reason Node on your machine doesn't appear to be importing the bootloader file. At minimum, even if the bootloader decided not to debug anything it would still hit this log message. You can perhaps try modifying that bootloader file path you see after --require and replacing its contents with throw new Error('asdf'); just to see if anything happens.
I don't know why the import is being ignored like this; I haven't seen other reports of it and installing the same Node version with nvm on my Linux VM does not have issues. Perhaps try updating to the latest Node 10 version (10.21.0), or even Node 12-14 if you can, and see if you have any more luck there.
connor4312
on 16 Jul 2020
Good news, it works after upgrade to 10.21.0.
eric-wei1990
on 16 Jul 2020
Okay, thanks for confirming! I guess it was some spooky bug on 10.15.2 👻 Interesting.
connor4312
on 16 Jul 2020
Upgrade to
1.47.1today, have same issue.
Seems caused by new js debuger, it is enabled by default.
https://marketplace.visualstudio.com/items?itemName=ms-vscode.js-debug-nightlyThis extension is installed by default on all VS Code versions after 1.46.0, however it's not enabled. You can enable it by adding "debug.javascript.usePreview": true to your user settings.
Breakpoint could be bounded after disable
debug.javascript.usePreview.
I've installed 1.47.2 latest version and the debug.javascript.usePreview was enabled by default as well instead of disabled. As you probably quoted from the README here: vscode-js-debug.
Could this due to the Workbench: Enable Experiments option, which is enabled by default and enabling the 'Use Preview' option?
Lastly, I am having the same issues with the debugger (node version 12.18.0), logs: vscode-debugadapter-9.zip.
 grount
on 19 Jul 2020
grount
on 19 Jul 2020
@grount you have a different issue. It seems that Node doesn't respond to the request to enable the "Debugger" domain in CDP. I'm curious:
- Whether the old debugger works for you in the same scenario
- If you can easily switch Node version (e.g. with nvm) whether this issue occurs if you try running with a different version like Node 14.
connor4312
on 19 Jul 2020
@connor4312
What response is there suppose to be to the request to enable the "Debugger" domain in CDP?
- using the old debugger works (with node 12.18.0).
- currently we are not capable of upgrading to Node 14.
grount
on 20 Jul 2020
Disabled JavaScript debugger and installed JavaScript Debugger(Nightly)
Added "debug.javascript.usePreview": false in .vscode->settings.json
But "Unbound breakpoint" issue persist for me
VSCode version: 1.47.2(user setup)
Node.js: 12.8.1
 jahnavi24
on 22 Jul 2020
jahnavi24
on 22 Jul 2020
I also am having the same issue, all breakpoints were unbound until I set "debug.javascript.usePreview" to false. After that I am able to debug as expected.
VSCode version: 1.47.2
Node.js version: 12.18.3
 ThreeScreenStudios
on 23 Jul 2020
ThreeScreenStudios
on 23 Jul 2020
@jahnavi24 this indicates you probably have an issue in your build or configuration
@ThreeScreenStudios please collect a trace log using the instructions above
connor4312
on 23 Jul 2020
@connor4312 Here are the logs, thanks for the help!
I noticed the first line in logs mention node version "v12.8.1" installed, although if I run "node -v" from the command line, it says
v12.18.3, not sure if that is an issue.
ThreeScreenStudios
on 24 Jul 2020
@ThreeScreenStudios It looks like you have this in your sourceMapOverrides section:
```
{
"webpack:///src/": "${webRoot}/"
}
````
However, the actual URL you're getting is webpack:///./src/views/Login.ts, which doesn't match exactly. (We don't normalize it, since source map paths can be very finicky and non-normal.) You should be able to fix this by adding
```diff
{
"webpack:///src/": "${webRoot}/",
- "webpack:///./src/": "${webRoot}/",
}
````
connor4312
on 24 Jul 2020
@connor4312 Unfortunately the breakpoints are still all unbound unless I set "debug.javascript.usePreview" to false.
If I do set it to false, it does seem to work with both "webpack:///src/": "${webRoot}/" or "webpack:///./src/": "${webRoot}/" if that helps?
ThreeScreenStudios
on 24 Jul 2020
Can you grab another trace log with that updated setting?
connor4312
on 24 Jul 2020
Yep, here you go:
ThreeScreenStudios
on 24 Jul 2020
This looks like an issue in Vue or whatever tool is generating the sourcemap. What I think is happening from the logs is:
- You set a breakpoint at Login.ts:30
- This now maps into a sourcemapped location in a script in the runtime -- line 6427 column 6 in app.js, at it happens
- We set the breakpoint at that location. However, Chrome then resolves that to line 6426 column 314 (it can move the location around if it doesn't match exactly to e.g. the start of a statement or expression)
- We see it moved and then try to use the source map to map that location back into the source code so we can make sure it's displayed in the right place. However, the sourcemap is missing a mapping for this location, so it fails and we don't verify the breakpoint.
- todo: _should_ we verify the breakpoint if it's resolved in the runtime, even if we aren't sure that the location is correct?
- I see in your log that you did now hit the breakpoint, but VS Code opened the compiled file. It did that for the same reason: the debugger ended up pausing at line 6428 col 7, which I'm thinking was not in the source map either, so we fell back to showing the compiled code.
- todo: I had thought we were fairly lenient here, but maybe not quite lenient enough...
If you're able to share app.js and its map with me, I can verify whether this is what's happening (preferably at the exact revision you used here so I can reference my own comment.) If you're using a recent version of your build tooling I can then file an issue on your behalf, or help you file an issue.
connor4312
on 24 Jul 2020
@connor4312 Yes you're correct, I am using Vue (with debugging instructions from here).
It did break in app.js, however I don't actually have an app.js, only an App.vue entry point file with very minimal code (the compiled app.js seems to encompass the entire spa in one file).
Your comment about source maps did give me an idea however, the vue site mentions to use the webpack config (which did work w/ usePreview: false):
module.exports = {
  configureWebpack: {
    devtool: 'source-map'
  }
}
When I removed the devtool: 'source-map' and debugged, vscode hit a breakpoint in the actual Login.ts file (progress!), however it moved the breakpoint to line 1. When I re-added the break point to the correct line and resumed, it did in fact hit the new breakpoint. Unfortunately this means that any breakpoints have to be added after already debugging currently.
I've attached the new trace here, let me know if you want me to send you any of the source files as well.
ThreeScreenStudios
on 24 Jul 2020
@connor4312 I've been able to reproduce with a basic vue app, you can try it for yourself here (added a breakpoint to HelloWorld.ts, incrementCounter function): https://github.com/ThreeScreenStudios/vsc-debug
ThreeScreenStudios
on 24 Jul 2020
Fyi you can set
debug.javascript.usePreview: falseto temporarily used the old debugger.
However, please collect trace logs using the instructions above so that your issue can be fixed, as this option will eventually go away.Looks like Debugger for Chrome v 4.12.9 that causes the issue.
Sorry, noob question: Where would I set this?
 bbccd
on 28 Jul 2020
bbccd
on 28 Jul 2020
Fyi you can set
debug.javascript.usePreview: falseto temporarily used the old debugger.
However, please collect trace logs using the instructions above so that your issue can be fixed, as this option will eventually go away.Looks like Debugger for Chrome v 4.12.9 that causes the issue.
Sorry, noob question: Where would I set this?
In VSCode, Click on File > Preferences > Settings > Type in topbar "debug.javascript.usePreview" and then uncheck the checkbox appearing in search results.
 shiv-4screenmedia
on 28 Jul 2020
shiv-4screenmedia
on 28 Jul 2020
I have same problem: my typescript project use nodemon to start dev, but preview debugger show "Unbound breakpoint",it broken.
by test,I fond ts-node --transpile-only ./app.ts to start dev, and attach process to success。
 aFcFzF
on 28 Jul 2020
aFcFzF
on 28 Jul 2020
Fyi you can set
debug.javascript.usePreview: falseto temporarily used the old debugger.
However, please collect trace logs using the instructions above so that your issue can be fixed, as this option will eventually go away.Looks like Debugger for Chrome v 4.12.9 that causes the issue.
Sorry, noob question: Where would I set this?
In VSCode, Click on File > Preferences > Settings > Type in topbar "debug.javascript.usePreview" and then uncheck the checkbox appearing in search results.
Thank you!
 alexei-clay
on 6 Aug 2020
alexei-clay
on 6 Aug 2020
If you are hitting issue here, please make sure to collect trace logs for us so we can fix the issue. The option to usePreview: false will, as mentioned, eventually go away https://github.com/microsoft/vscode/issues/102493#issuecomment-658321038
Closing the issue as there's not been more info from the original poster.
connor4312
on 6 Aug 2020
Issue is still occurring. Requesting reopening this issue.
Upgraded nodejs version to 12.18.3
launch.json file:
{
    // Use IntelliSense to learn about possible attributes.
    // Hover to view descriptions of existing attributes.
    // For more information, visit: https://go.microsoft.com/fwlink/?linkid=830387
    "version": "0.2.0",
    "configurations": [
        {
            "type": "pwa-node",
            "request": "launch",
            "name": "Launch Program",
            "skipFiles": [
                "<node_internals>/**"
            ],
            "program": "${workspaceFolder}\\app.js"
        }
    ]
}
Also I tried removing the checkbox on debug.javascript.usePreview, it did not work. Is the only option to downgrade VS code at this point?
alexei-clay
on 6 Aug 2020
I don't know what your issue is. Please describe what you're hitting and collect a trace log using the instructions I linked above 🙂
Also, if it works even with usePreview: false, the issue is most likely in your local setup. However I am happy to help diagnose what the issue is.
connor4312
on 6 Aug 2020
Logs posted below. My issue is simply that the breakpoints are not being hit, and hovering over the grayed breakpoint when the debugger is running leaves the message "Unbound Breakpoint".
alexei-clay
on 6 Aug 2020
That looks like some browser code. Your launch config you sent only debugs your Node.js server. You'll want to create a separate launch config to debug the browser, for example:
{
  "name": "Launch Chrome",
  "request": "launch",
  "type": "pwa-chrome",
  "url": "http://localhost:6605",
},
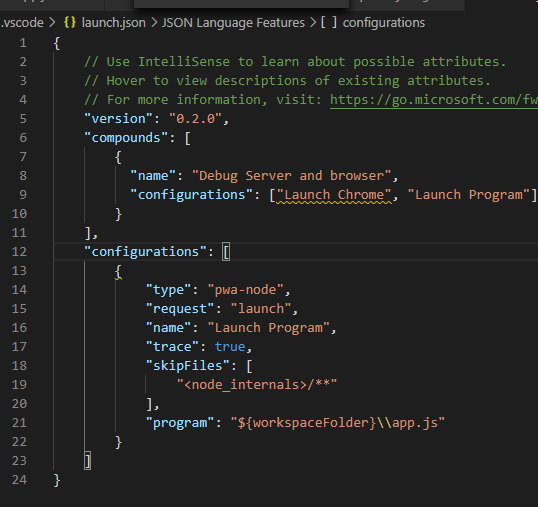
If you'd like an easy way to run them both at the same time, you can add a compound launch config in your launch.json, for example:
  "compounds": [
    {
      "name": "Debug Server and browser",
      "configurations": ["Launch Chrome", "Launch Program"]
    }
  ],
 alexei-clay
on 6 Aug 2020
alexei-clay
on 6 Aug 2020
You need to add the chrome launch config as well.
connor4312
on 6 Aug 2020
@connor4312 I am unfortunately still getting this issue as well. Repro'd with this sample repo: https://github.com/ThreeScreenStudios/vsc-debug
Debug trace here:
vscode-debugadapter-1.json.gz
launch.json:
`"version": "0.2.0",
"configurations": [{
    "type": "chrome",
    "request": "launch",
    "name": "vuejs: chrome",
    "url": "http://localhost:8080",
    "webRoot": "${workspaceFolder}/src",
    "trace": true,
    "breakOnLoad": true,
    "sourceMapPathOverrides": {
        "webpack:///./src/*": "${webRoot}/*"
    }
}]`
Let me know if you need any additional info, thanks!
ThreeScreenStudios
on 6 Aug 2020
Thanks @ThreeScreenStudios, your repro is still in my queue to look at!
connor4312
on 6 Aug 2020
You need to add the chrome launch config as well.
Forgive my ignorance. How do I do that?
alexei-clay
on 6 Aug 2020
Copy the object in the first snippet I sent to your configurations array. Then you should be able to run the compound launch config; Chrome will automatically open to your webpage.
connor4312
on 6 Aug 2020
Running the following launch.json results in "ERR_CONNECTION_REFUSED":
{
    // Use IntelliSense to learn about possible attributes.
    // Hover to view descriptions of existing attributes.
    // For more information, visit: https://go.microsoft.com/fwlink/?linkid=830387
    "version": "0.2.0",
    "configurations": [
        {
            "name": "Launch Chrome",
            "request": "launch",
            "type": "pwa-chrome",
            "url": "http://localhost:6605",
          },
    ]
}
Not sure if this is helpful, but I re-added the "trace" parameter, and ran again. Here's the log file:
alexei-clay
on 6 Aug 2020
That means your server isn't running, or isn't on that port.
StackOverflow or various tutorials online may be a better place to have your questions answered.
connor4312
on 6 Aug 2020
Whoops, server running now. Re-started the debugger and still I'm not hitting the breakpoint. Here's the log. Last post, I'll quit after this one. Sorry.
alexei-clay
on 6 Aug 2020
You need to set the webRoot to ${workspaceFolder}/utilities
connor4312
on 6 Aug 2020
Worked!
Wow, thank you so much. I had tried setting webRoot to ${workspaceFolder}/utilities/javascript. Again, sorry for taking over this thread when the solution doesn't appear to be related to the original post. Much appreciated.
alexei-clay
on 6 Aug 2020
no worries, glad you got it working 🙂
connor4312
on 6 Aug 2020
I was using VSCode for one single reason - DEBUGGING. Now they've managed to broke even this. WELL DONE.
 zhunik
on 14 Aug 2020
zhunik
on 14 Aug 2020
@zhunik please file a bug here: https://github.com/microsoft/vscode-js-debug/issues/new/choose
connor4312
on 14 Aug 2020
Issue Type: Bug
Hi,
After my VS Code updated to the latest version for some reason i can no longer place a breakpoint anywhere in my code.
When i place a breakpoint, it gives the round circle without red and it says "Unbound breakpoint".
This is a little bit disappointed.
Below is the launch.json configuration:
{
// Use IntelliSense to learn about possible attributes.
// Hover to view descriptions of existing attributes.
// For more information, visit: https://go.microsoft.com/fwlink/?linkid=830387
"version": "0.2.0",
"configurations": [
{
"type": "chrome",
"request": "launch",
"name": "Chrome - CIS5",
"url": "https://localhost:3000",
"webRoot": "${workspaceFolder}",
"sourceMaps": true,
"sourceMapPathOverrides": {
"webpack:///./_": "${workspaceRoot}/_"
}
}
]
}VS Code version: Code 1.47.0 (d5e9aa0, 2020-07-09T08:02:06.629Z)
OS version: Windows_NT x64 10.0.17763System Info
Extensions (27)
 Bobbybong
on 22 Aug 2020
Bobbybong
on 22 Aug 2020
Here's the solution to all your problem.
https://postimg.cc/GTymWK3R
Bobbybong
on 22 Aug 2020
@Bobbybong that's a workaround, but not a solution -- the option will go away, so we want users to make sure file issues when they run into problems.
connor4312
on 22 Aug 2020
@connor4312 Have you understood very well what the OP question is all about? OP is saying he can't debug or set breakpoint in VSCode after upgrading to 1.4.7. So the solution to that problem is the one I posted above.
Bobbybong
on 22 Aug 2020
OK plain vanilla node.js application, debugger is broken! Irritating.
Not only is the breakpoint unbound, it doesn't even show up.

 TekMonksGitHub
on 10 Sep 2020
TekMonksGitHub
on 10 Sep 2020
Are you using an end-of-life Node version (<10)? If so, upgrading should fix your problem.
No I am on Node 12.18.3 - latest stable LTS release on Windows 10.
Reattaching the trace.
vscode-debugadapter-0.json.gz
TekMonksGitHub
on 10 Sep 2020
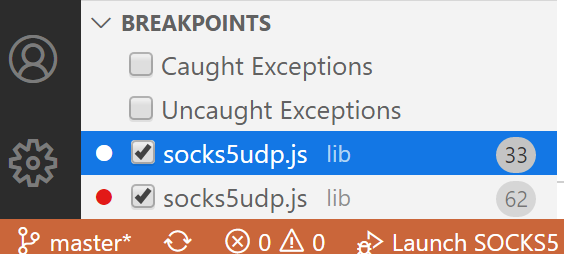
@TekMonksGitHub it looks like your file casing at runtime differs from your filesystem. VS Code sends breakpoints as socks5UDP it is required as socks5udp. This may confuse VS Code. However it looks like the breakpoints are successfully set. I'm not seeing any issue there.
connor4312
on 10 Sep 2020
1 - Yes, you are right, the file on filesystem was socks5UDP.js. This worked for node as Windows is case insensitive for file names. I think on Windows VS Studio debugger should at least be OS compatible.
2 - I renamed the files to match, but still can't hit the breakpoint. So this didn't resolve the issue still.
Adding new trace as well.
vscode-debugadapter-2.json.gz
TekMonksGitHub
on 10 Sep 2020
File on the filesystem is renamed to match ->

TekMonksGitHub
on 10 Sep 2020
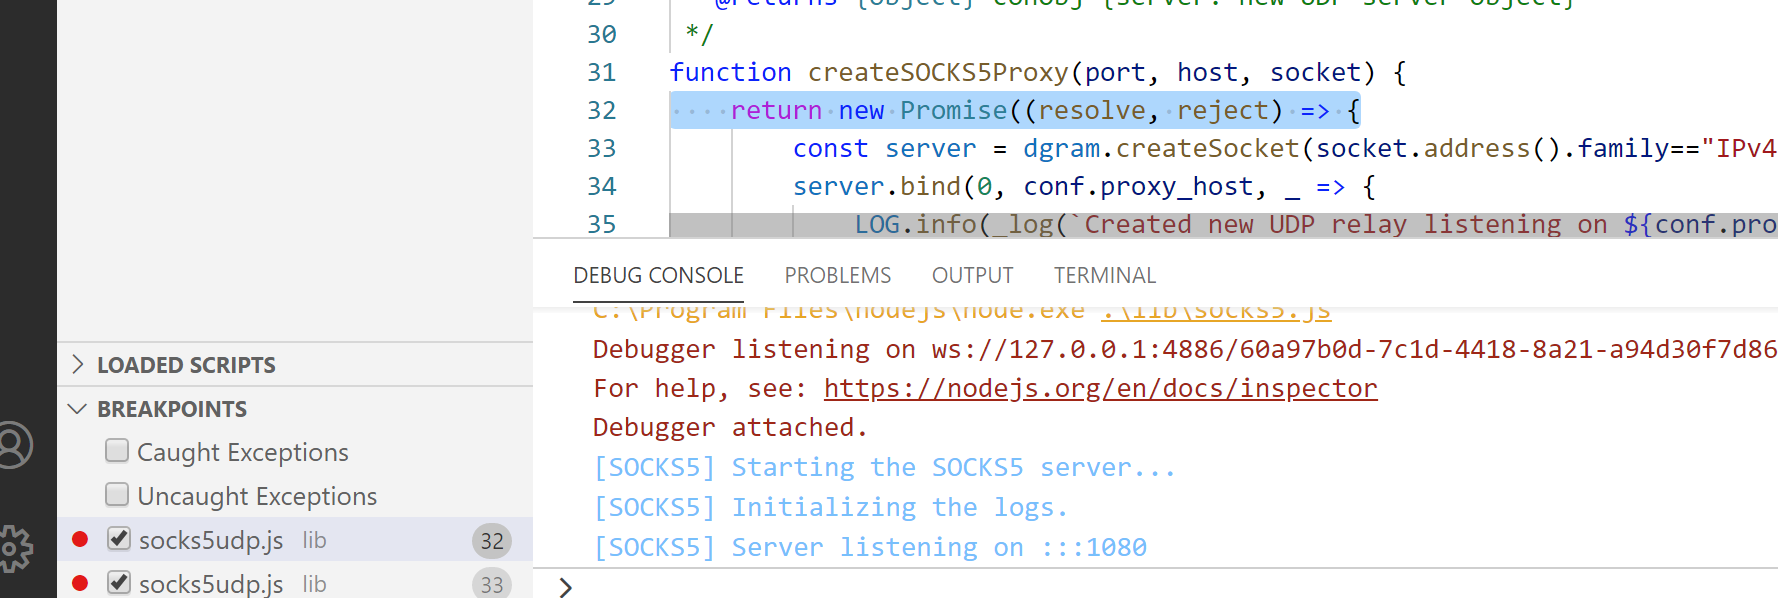
The filled circule means the breakpoint is set, and the log file indicates that Node was able to set it at the correct position. Are you sure your code is actually executing it? What happens if you add a debugger; statement in the same spot?
connor4312
on 10 Sep 2020
See attached video. Visual breakpoint indicators disappear, when the code is hit, local stack is not resolved either. Essentially visual debug is totally broken.
TekMonksGitHub
on 10 Sep 2020
I'm guessing VS Code is hanging onto the original file name. You may have luck closing VS Code, clearing your workspace storage (a folder in C:\Users\<user>\AppData\Roaming\Code\User\workspaceStorage), and reopening it.
But regardless you still should be able to pause on the breakpoint with what I'm seeing in your logs.
connor4312
on 10 Sep 2020
First thanks for taking time to look into this with me. Yes, deleting the workspaceStorage folder fixed it.
I really think this is quite brutal - nothing seemed to solve this issue, unless you pointed out that folder, which wouldn't be obvious to a non-VSCode developer, and Windows filenames are case insensitive, so...
But thanks a lot again. This got me going...
TekMonksGitHub
on 10 Sep 2020
Thanks for confirming, opened a new issue for this scenario: https://github.com/microsoft/vscode/issues/106382
connor4312
on 10 Sep 2020
Just upgraded to version 1.49.0, and all of a sudden I have the same problem. Most breakpoints are now "unbound". I'm using TypeScript and I can break the app inside the generated .js file, but not on the corresponding .ts file as I did one hour ago.
Tried the wokspaceStorage trick but nothing changed.
 leosdad
on 10 Sep 2020
leosdad
on 10 Sep 2020
Just upgraded to version 1.49.0, and all of a sudden I have the same problem. Most breakpoints are now "unbound". I'm using TypeScript and I can break the app inside the generated .js file, but not on the corresponding .ts file as I did one hour ago.
Tried the wokspaceStorage trick but nothing changed.
I've just downgraded to 1.48.2 and the breakpoints are working as expected. Please look into it ASAP. Thanks!
leosdad
on 10 Sep 2020
Please collect a trace log using these instructions:
If you're able to, add
"trace": trueto yourlaunch.jsonand reproduce the issue. The location of the log file on your disk will be written to the Debug Console. Share that with us.⚠️ This log file will not contain source code, but will contain file paths. You can drop it into https://microsoft.github.io/vscode-pwa-analyzer/index.html to see what it contains. If you'd rather not share the log publicly, you can email it to [email protected]
connor4312
on 10 Sep 2020
Thanks for the emailed logs @leosdad. This is a behavior changed in https://github.com/microsoft/vscode-js-debug/issues/704 (explained more in https://github.com/microsoft/vscode/issues/105859#issuecomment-685134778) -- the reason is that your outFiles is set to js-raw/*.js, which only matches direct children in js-raw.
You can fix this by setting outFiles: ["${workspaceFolder}/js-raw/**/*.js"] to match all js files in that directory.
connor4312
on 10 Sep 2020
Great, thanks! Will test it later.
leosdad
on 11 Sep 2020
I will add that upgrading to 1.49 also caused this same issue, and downgrading to 1.48 fixed it. @connor4312 I already had this set in my launch config:
            "outFiles": [
                "${workspaceFolder}/my/path/dist/**/*.js"
            ],
 Crispy1975
on 15 Sep 2020
Crispy1975
on 15 Sep 2020
@Crispy1975 please share your launch config and/or logs as described above so I can help you with your issue.
connor4312
on 15 Sep 2020
upgrade vscode to the latest version can workaround
 xingdavis
on 16 Sep 2020
xingdavis
on 16 Sep 2020
Having the same problem after upgrading to 1.49.0
 nicosefer
on 17 Sep 2020
nicosefer
on 17 Sep 2020
@nicosefer please share your launch config and/or logs as described above so I can help you with your issue.
connor4312
on 17 Sep 2020
Just to make it clear, this answer from Connor worked right away, so my problem is gone for a week now.
leosdad
on 17 Sep 2020
@connor4312 I'm having the same issue on 1.49.1:
git clone git clone https://github.com/Microsoft/vscode-extension-samples.git
cd vscode-extension-samples/helloworld-sample
npm install
code .
Set a breakpoint in extension.ts
Press F5.
2 trace files get generated every time I press F5
vscode-debugadapter-10.json.gz
vscode-debugadapter-11.json.gz
 jabbera
on 18 Sep 2020
jabbera
on 18 Sep 2020
Is your hello world extension actually getting activated? It doesn't look like the we get any scriptParsed events for the sample in the logs you sent.
connor4312
on 18 Sep 2020
I have the same issue, no way to resolve it even by downgrading to version 1.48.2.
Perhaps I have to delete some cached files? I'm using a Mac.
Running debug I have the following output in the integrated terminal:
/usr/bin/env 'NODE_OPTIONS=--require "/Applications/Visual Studio Code.app/Contents/Resources/app/extensions/ms-vscode.js-debug/src/bootloader.bundle.js" --inspect-publish-uid=http' 'VSCODE_INSPECTOR_OPTIONS={"inspectorIpc":"/var/folders/v6/g0ln7hfd0496z_8nxxmzks4h0000gn/T/node-cdp.14425-2.sock","deferredMode":false,"waitForDebugger":"","execPath":"/Users/eanx/.nvm/versions/node/v12.18.0/bin/node","onlyEntrypoint":false,"autoAttachMode":"always","fileCallback":"/var/folders/v6/g0ln7hfd0496z_8nxxmzks4h0000gn/T/node-debug-callback-b4d42d25cdf9d098"}' /Users/eanx/.nvm/versions/node/v12.18.0/bin/node ./server.js
My lauch.json is the following:
{
    // Use IntelliSense to learn about possible attributes.
    // Hover to view descriptions of existing attributes.
    // For more information, visit: https://go.microsoft.com/fwlink/?linkid=830387
    "version": "0.2.0",
    "configurations": [
        {
            "type": "node",
            "request": "launch",
            "name": "Launch Program",
            "skipFiles": [
                "<node_internals>/**"
            ],
            "program": "${workspaceFolder}/server.js",
            "console": "integratedTerminal"
        }
    ]
}
 SergioEanX
on 18 Sep 2020
SergioEanX
on 18 Sep 2020
@SergioEanX please share your logs as described above so I can help you with your issue.
connor4312
on 18 Sep 2020
@connor4312 well that's embarrassing. I've never written an extension before........ :-)
jabbera
on 18 Sep 2020
Extensions only get activated when some event happens. In the case of the sample, it's only activated when "hello world" is run https://github.com/microsoft/vscode-extension-samples/blob/master/helloworld-sample/package.json#L14-L16 More about extensions: https://code.visualstudio.com/api/get-started/extension-anatomy
connor4312
on 18 Sep 2020
@SergioEanX please share your logs as described above so I can help you with your issue.
I finally resolved the issue by completely removing VS Code from my Mac and reinstalling version 1.46.1.
I think I will wait for a couple of updates before upgrading the actual version of VS Code.
I wasted more than two hours trying to find a solution.
So far I considered VS Code a great IDE.
SergioEanX
on 18 Sep 2020
@SergioEanX I would encourage you to share the trace logs so we can get your issue resolved. It should only take a minute or two of your time to collect them, and then you won't be stuck forever on an old version of VS Code 🙂
connor4312
on 18 Sep 2020
@nicosefer please share your launch config and/or logs as described above so I can help you with your issue.
@connor4312 Thanks for your support. The problem was solved after upgrading to 1.49.1 this morning
nicosefer
on 18 Sep 2020
Hi @connor4312, just found out I'm having the same issue after updating.
I quickly "solved" by tweaking my outFiles to include any files under ${workspaceFolder}, as seems to be the same issue suggested in this response, but mine is a really dirty fix to keep working.
My launch.json is:
{
  "configurations": [
    {
      "name": "Pool - Timetable",
      "type": "node",
      "request": "launch",
      "program": "${workspaceFolder}/node_modules/serverless/bin/serverless",
      "preLaunchTask": "tsc: build - tsconfig.json",
      "outFiles": [ "${workspaceFolder}/**/*.js" ],
      "args": [
        "invoke",
        "local",
        "--function",
        "poolTimetablesConfigLambda",
        "--path",
        "${workspaceRoot}/lambdas/pool_config_lambda/test/request.json"
      ]
    },{
      "name": "Pool - Timetable - No config - Invalid",
      "type": "node",
      "request": "launch",
      "program": "${workspaceFolder}/node_modules/serverless/bin/serverless",
      "preLaunchTask": "tsc: build - tsconfig.json",
      "outFiles": [ "${workspaceFolder}/.build/**/*.js" ],
      "args": [
        "invoke",
        "local",
        "--function",
        "poolTimetablesConfigLambda",
        "--path",
        "${workspaceRoot}/lambdas/pool_config_lambda/test/request-no-config.json"
      ]
    }
  ]
}
The first config works like a sharm, the second one doesn't, it seems to execute perfectly, just doesn't like my breakpoints, any suggestion?
 rsd-raul
on 18 Sep 2020
rsd-raul
on 18 Sep 2020
Glad to hear you got it working. If you grab a trace log, that will give me enough information about your environment to be able to look into it further.
connor4312
on 18 Sep 2020
Just sent them to your email, thanks a lot.
rsd-raul
on 18 Sep 2020
Thanks for the logs. It looks like the serverless build creates recursive sourcemaps, which is interesting... so effectively the algorithm sees the recursed source maps as coming from the same paths as your source files, which means that targeting .build only doesn't match them. You have a couple options:
- Leave the entire directory in your outFiles, or remove outFiles (since this is the default). This is not too bad, the outFiles scanning is quite optimized in recent versions of js-debug.
- Change your
type: pwa-nodefromtype: node, and then addresolveSourceMapLocations: null(or a more specific glob) to tell js-debug to resolve sourcemaps in all or those additional locations.
connor4312
on 19 Sep 2020
Huh, interesting, I thought the scanning would be quite costly, but yeah, I'm not noticing much of a difference, to be honest.
I'll remove outFiles and avoid anything too specific, plus, that's 50+ lines less in a file that keeps getting bigger... Every bit counts :D
Thanks for all the help.
rsd-raul
on 19 Sep 2020
@SergioEanX I would encourage you to share the trace logs so we can get your issue resolved. It should only take a minute or two of your time to collect them, and then you won't be stuck forever on an old version of VS Code 🙂
Below the trace logs.
Curiously after removing VS Code altogether and after that upgrading to the latest version, the described issue seems to have gone.
Still I receive a long string (shown twice) as below when I start the debugger:
/usr/bin/env 'NODE_OPTIONS=--require "/Applications/Visual Studio Code.app/Cont ents/Resources/app/extensions/ms-vscode.js-debug/src/bootloader.bundle.js" --inspect-publish-uid=http' 'VSCODE_INSPECTOR_OPTIONS={"inspectorIpc":"/var/folders/v6/g0ln7hfd0496z_8nxxmzks4h0000gn/T/node-cdp.1324-1.sock","deferredMode":false,"waitForDebugger":"","execPath":"/Users/eanx/.nvm/versions/node/v12.18.0/bin/node","onlyEntrypoint":false,"autoAttachMode":"always","fileCallback":"/var/folders/v6/g0ln7hfd0496z_8nxxmzks4h0000gn/T/node-debug-callback-a17564fb3728c92b"}' /Users/eanx/.nvm/versions/node/v12.18.0/bin/node ./server.js
I have the same issue on Linux Ubuntu 20.04, I'll share that logs too.
Thanks!
SergioEanX
on 19 Sep 2020
This is my trace logs from an Opensuse Tumbleweed:
vscode-debugadapter-1.json.gz
Here still the same issue.
SergioEanX
on 19 Sep 2020
I have the same issue, but with Angular, when running in a devcontainer. I believe this worked in 1.48.
I have uploaded a complete example, just need to do an "npm install", and build the angular app. I've also attached the json.gz after running with "trace: verbose".
Nothing exciting in the project except the launch/debug settings, if you open within a container (Remote Containers: Reopen in Container), select "Run" tab, then select "Launch Angular in Container", then just click "Start Debugging", you should see that a breakpoint set in app.component.ts (line 9, which sets the title) doesn't get hit. Note that the breakpoint does get hit if you open this locally and using the "Launch Angular" run configuration.
 GitMonkey007
on 19 Sep 2020
GitMonkey007
on 19 Sep 2020
Curiously after removing VS Code altogether and after that upgrading to the latest version, the described issue seems to have gone.
Yea, in the logs it seems like everything is working.
Still I receive a long string (shown twice) as below when I start the debugger:
This is expected when running console: integratedTerminal
This is my trace logs from an Opensuse Tumbleweed:
It doesn't look like we're getting an attachment at all there. Can you try removing console: integratedTerminal to eliminate some varaibles?
I have the same issue, but with Angular, when running in a devcontainer. I believe this worked in 1.48.
Thanks for the logs and repro! Two things --
webRootis a path, not a glob, so you would want${workspaceFolder}instead of${workspaceFolder}/**. It also defaults to your workspaceFolder, so you can just omit it.- it looks like some of the config resolution the old debugger does interferes with the new one, so you can set
type: pwa-chrometo go to the new debugger. I'll make a change to fix this.
With these two changes your launch config should look like this:
{
  "name": "Launch Angular in container",
  "type": "pwa-chrome",
  "request": "launch",
  "preLaunchTask": "start angular in container",
  "url": "http://localhost:4200/",
  "trace": true
}
@connor4312 - Thats fixed me! Thank you very much for solving that!
GitMonkey007
on 19 Sep 2020
Also having problems with hitting break points after an upgrade to 1.49.x. Currently I am on 1.49.1. My launch config looks like this:
           {
            "name": "Launch 3 Chrome",
            "type": "pwa-chrome",
            "request": "launch",
            "url": "http://d.cotat/mm",
            "sourceMaps": true,
            "trace": true
          },
 jomofrodo
on 20 Sep 2020
jomofrodo
on 20 Sep 2020
@jomofrodo in the log file you sent, your launch config is different -- you have something like
"sourceMapPathOverrides": {
  "webpack:///./": "${workspaceFolder}/mm/"
}
But your sources are like"webpack:///src/components/MediaWidget.vue" -- without the dot -- so that override does not match them. I recommend adjusting your overrides.
connor4312
on 20 Sep 2020
Same NodeJS/ExpressJS app and same issue for VS Code greater than 1.46. This time on Ubuntu 20.04. Any hope to resolve it? Thanks. Below my trace logs.
vscode-debugadapter-0.json.gz
SergioEanX
on 20 Sep 2020
@SergioEanX see my followup to your question here https://github.com/microsoft/vscode/issues/102493#issuecomment-695328710
connor4312
on 20 Sep 2020
@connor4312 Got it to work with this launch config:
       {
            "name": "Launch v3 Chrome",
            "type": "pwa-chrome",
            "request": "launch",
            "url": "http://d.cotat/mm",
            "sourceMaps": true,
            "trace": true,
            "sourceMapPathOverrides": {
                "webpack:///*":     "*",                               // Example: "webpack:///project/app.ts" -> "/project/app.ts"
                "webpack:///src/*": "${workspaceFolder}/src/*"         // Example: "webpack:///src/app.js" -> "/Users/me/project/src/app.js"
            }
          },
Thanks for the help.
jomofrodo
on 20 Sep 2020
New trace logs below (having removed "console": "integratedTerminal")
Following a previous suggestion I realized that by setting
"debug.javascript.usePreview": false
in settings.json, actually resolve the issue.
Thanks again!
@SergioEanX see my followup to your question here #102493 (comment)
vscode-debugadapter-5.json.gz
SergioEanX
on 21 Sep 2020
I have the same issue with the latest VSCode (Version: 1.49.1)
            "type": "pwa-chrome",
            "request": "launch",
            "name": "Launch Chrome against localhost",
            "url": "localhost:8080",
            "webRoot": "${workspaceFolder}",
It worked before, now it says unbound breakpoint once debugging starts.
I am using one non local javascript module using "unpkg" to import:
import * as EcsyThree from 'https://unpkg.com/ecsy-three?module';
Not sure if this is important to know.
 hanshamm
on 23 Sep 2020
hanshamm
on 23 Sep 2020
@hanshamm please collect trace logs so I can help with your issue!
@SergioEanX do you have any kind of antivirus/firewall running locally? We've seen a few cases presenting the same symptoms that were caused by an AV blocking the program connecting back to VS Code.
connor4312
on 23 Sep 2020
Please find attached all my tracings from yesterday.
vscode-debugadapter-0.json.gz
vscode-debugadapter-1.json.gz
vscode-debugadapter-2.json.gz
vscode-debugadapter-3.json.gz
vscode-debugadapter-4.json.gz
vscode-debugadapter-5.json.gz
vscode-debugadapter-6.json.gz
vscode-debugadapter-7.json.gz
vscode-debugadapter-8.json.gz
vscode-debugadapter-9.json.gz
vscode-debugadapter-10.json.gz
vscode-debugadapter-11.json.gz
vscode-debugadapter-12.json.gz
vscode-debugadapter-13.json.gz
vscode-debugadapter-14.json.gz
hanshamm
on 24 Sep 2020
@hanshamm can you please collect a single isolated log with the issue you're describing so I can efficiently and correctly identify your problem?
connor4312
on 24 Sep 2020
Related issues
 biij5698
·
3Comments
biij5698
·
3Comments
 shanalikhan
·
3Comments
shanalikhan
·
3Comments
 mrkiley
·
3Comments
mrkiley
·
3Comments
 trstringer
·
3Comments
trstringer
·
3Comments
 NikosEfthias
·
3Comments
NikosEfthias
·
3Comments
Most helpful comment
Fyi you can set
debug.javascript.usePreview: falseto temporarily used the old debugger.However, please collect trace logs using the instructions above so that your issue can be fixed, as this option will eventually go away.