Vscode: Improve debug self hosting experience
Most notable with regards to debugging vscode.
 isidorn
All 60 comments
Also assinging to @weinand since the large self hosting compound debugs everything inlcuding EH debugging
isidorn
on 17 Jun 2020
Related issue filled by @joaomoreno https://github.com/microsoft/vscode/issues/83994
fyi @deepak1556 and @roblourens since they are assigned to that issue
@jrieken says it is very flaky and issues are not reproducable in general
I will self host on it more in the following days and hopefully can idenity issues that are paper cuts.
isidorn
on 17 Jun 2020
Yes, using the "VS Code" launch config is very frustrating. There are many UX paper cuts like notification spam, questionable debug console selection, disconnect vs stop button etc pp. However, there is also severe trouble where things freeze or crash and that seems to happen 2 out of 3 times and only when a breakpoint is set here but not there or when a console message appears at a bad time or what not. This seems soo random that I cannot file a bug that would meet my personal bug min bar and that's read sad part of this. I have no clue how to help to improve this.
 jrieken
on 17 Jun 2020
jrieken
on 17 Jun 2020
Following down the issue links, this seems to be the issue on the Electron side for the random crashes https://github.com/electron/electron/issues/21288
As for other papercuts we can look into fixing them on the vscode side.
isidorn
on 17 Jun 2020
Following down the issue links, this seems to be the issue on the Electron side for the random crashes electron/electron#21288
No. I know about the break-on-async-problem but this is a head to head comparison with devtools and vscode and while I can happily work with the former I cannot with the latter.
jrieken
on 17 Jun 2020
One issue that I repro often is that if the renderer process console.logs a lot while vscode is attached, it will hang. Doesn't happen when only attached with devtools.
 roblourens
on 17 Jun 2020
roblourens
on 17 Jun 2020
@jrieken please file issues for me when you run into a papercut or problem, even if you run into a issue you can't consistently reproduce. You can also add trace: true to your launch configuration locally so that you have a log available whenever you run into a problem. (The location of the log file for each run will be printed to the debug console.) My bug queue for js-debug is almost empty right now, I need to know about issues in order to fix them! 🙂
disconnect vs stop button etc
This should be better with https://github.com/microsoft/vscode/issues/99736
notification spam, questionable debug console selection
Can you expand on these? Either here or a new issue is good.
things freeze or crash
I think Eric has also seen these. I can only assume this is _some_ problem in Electron. I have not observed the extension host/node/chrome freezing in that way. I'll try to play around and reproduce it locally, a trace: true log would also help if you're able to capture it easily.
One issue that I repro often is that if the renderer process console.logs a lot while vscode is attached, it will hang
I think we fixed this yesterday with: https://github.com/microsoft/vscode-js-debug/commit/154a62d646428be48bb8f9dbb90ad12340639990 I'll make a console spam extension to try to verify
 connor4312
on 17 Jun 2020
connor4312
on 17 Jun 2020
Can you expand on these? Either here or a new issue is good.
Whenever something doesn't work, e.g because there is still a dangling process or so, things go wild. Simulate the worst of it like so:
- in the terminal run
script/code.sh - from debug launch "VS Code"
- a monster 🌊 of model dialogs and notifications heading to you

I know this is a tricky one and my sample is the worst case but when something fails it's enough to say that once.
jrieken
on 17 Jun 2020
That'll be fixed in the next nightly https://github.com/microsoft/vscode-js-debug/commit/c462b53820da1796d439862469c2542678cb46e4
connor4312
on 17 Jun 2020
I often get into this rut: reloading the window stays like this forever. Further reloadings behave the same. I am forced to close the window.

Once I close the window, I wait for all debug sessions to terminate, which they do. But then when I F5 again I get:

At this point I look for running processes:
➜  vscode git:(joao/scm-view) ✗ ps ax | grep code-oss
27213 ?        Sl     0:00 /home/joao/Work/vscode/.build/electron/code-oss --nolazy --inspect=6044 /home/joao/Work/vscode/extensions/json-language-features/server/out/node/jsonServerMain --node-ipc --clientProcessId=27013
So I kill 'em: killall code-oss. Then it works. 🤷
 joaomoreno
on 22 Jun 2020
joaomoreno
on 22 Jun 2020
The blank window also happens when running ./scripts/code.sh: https://github.com/microsoft/vscode/issues/100740
joaomoreno
on 22 Jun 2020
Since today, my guess is that's electron 8, debugging is totally broken. Run the "VS Code" launch config and be depressed.
jrieken
on 22 Jun 2020
Tho, I still see this: Dangling attach to extension host which on detach shows the timeout error

jrieken
on 22 Jun 2020
I am seeing the reload issue as well after updating Insiders with ordinary extension host debugging on both the old and new adapters. Definitely seems Electron-related.
I tried to reproduce depression but "Launch VS Code" actually works for me fine on master right now. I wonder if @deepak1556 fixed something today?
I've seen the dangling attach issue a couple times before, will try to repro and fix.
connor4312
on 23 Jun 2020
Nope I haven't addressed anything wrt "Launch VS Code" issue.
 deepak1556
on 23 Jun 2020
deepak1556
on 23 Jun 2020
Yea, nevermind, I didn't realize the insiders was frozen -- I checked that I was on the latest but didn't see that it was a pre-Electron 8 build.
connor4312
on 23 Jun 2020
paper-cuts: disconnect or stop?

jrieken
on 24 Jun 2020
That one we can fix on the vs code side.
I might have broken this with my compression of sessions work. The current approach: when multiple sessions are merged we show the Stop / Disconnect based on the parent session.
However the Toolbar Stop / Disconnect does not honor this "heuristic" and shows it for the bottom session.
Whatever we choose to do, at least it should be consistent.
I will look into fixing this.
isidorn
on 24 Jun 2020
paper-cuts: how likely are breakpoints to be "inside" identifiers? this is surely complicated to get right but some heuristic (at least for JS where this doesn't make sense) that renders them at word boundaries wouldn't make look so bad

jrieken
on 24 Jun 2020
For breakoint locations VS Code trusts extensions and does not update the location.
I agree with you that we could introduce a heuristic to only render them at word boundaries. So the question is where would this heuristic live, on the js-debug side or on vscode side?
However words have different boundaries for different languages. Not sure if I ask for words from the editor would they be language specific.
@connor4312 is there a chance we do this on the js-debug extension side? If not possible, I can also look into introducing a general heuristic for all languages based on words.
isidorn
on 24 Jun 2020
Not sure if I ask for words from the editor would they be language specific.
The editor model uses the correct word definition in getWordAtPosition
jrieken
on 24 Jun 2020
Then it feels to me like the proper thing would be to do this on the VS Code side. Especially since I am not aware of a language that would want to place inline breakpoints inside a word.
Though before I jump on this let's see what @connor4312 thinks
isidorn
on 24 Jun 2020
how likely are breakpoints to be "inside" identifiers? this is surely complicated to get right but some heuristic (at least for JS where this doesn't make sense) that renders them at word boundaries wouldn't make look so bad
The screenshot you showed usually happens when the code in the runtime doesn't match whatever you have running locally. For example, if you change a file but don't reload the extension host. E.g. I can reproduce the problem by putting a blank line in "resolve", which will have the breakpoint on the column where it should normally go in the following line:

Does this sound like what might have happened for you?
I agree that it's not a good scenario, and we've an issue someone raised about it before. I don't know what the right behavior is, though; the code mismatches so all bets are off, even if we cosmetically shift the breakpoint column.
Maybe whenever a file is locally edited we unverify all breakpoints in that file. But that could also become annoying. Open to ideas.
we could introduce a heuristic to only render them at word boundaries
I don't think we should do this. js-debug should be responsible for returning the correct breakpoint columns. If it returns a breakpoint in the middle of the word, that's a problem (usually due to mismatched code, or in 🐛 cases, bad sourcemap resolution).
Also, thank you so much for continuing to raise these issues! ❤️
connor4312
on 24 Jun 2020
Does this sound like what might have happened for you?
Definitely something like that. In my case I did reload but I noticed that I often need to restart webpack (that sample is from an extension) for it to recover. So, not blaming debug for the bad information it retrieves but more for the way it handles those. Generally, I'd say it should be more conservative with those editing while debugging cases
jrieken
on 24 Jun 2020
connor4312
on 24 Jun 2020
Great! So lets see how it goes with fixing on the js-debug side first.
isidorn
on 24 Jun 2020
Created this issue for the "VS Code session is already running" issue https://github.com/microsoft/vscode/issues/101108
isidorn
on 26 Jun 2020
This will continue next milestone -> July
isidorn
on 1 Jul 2020
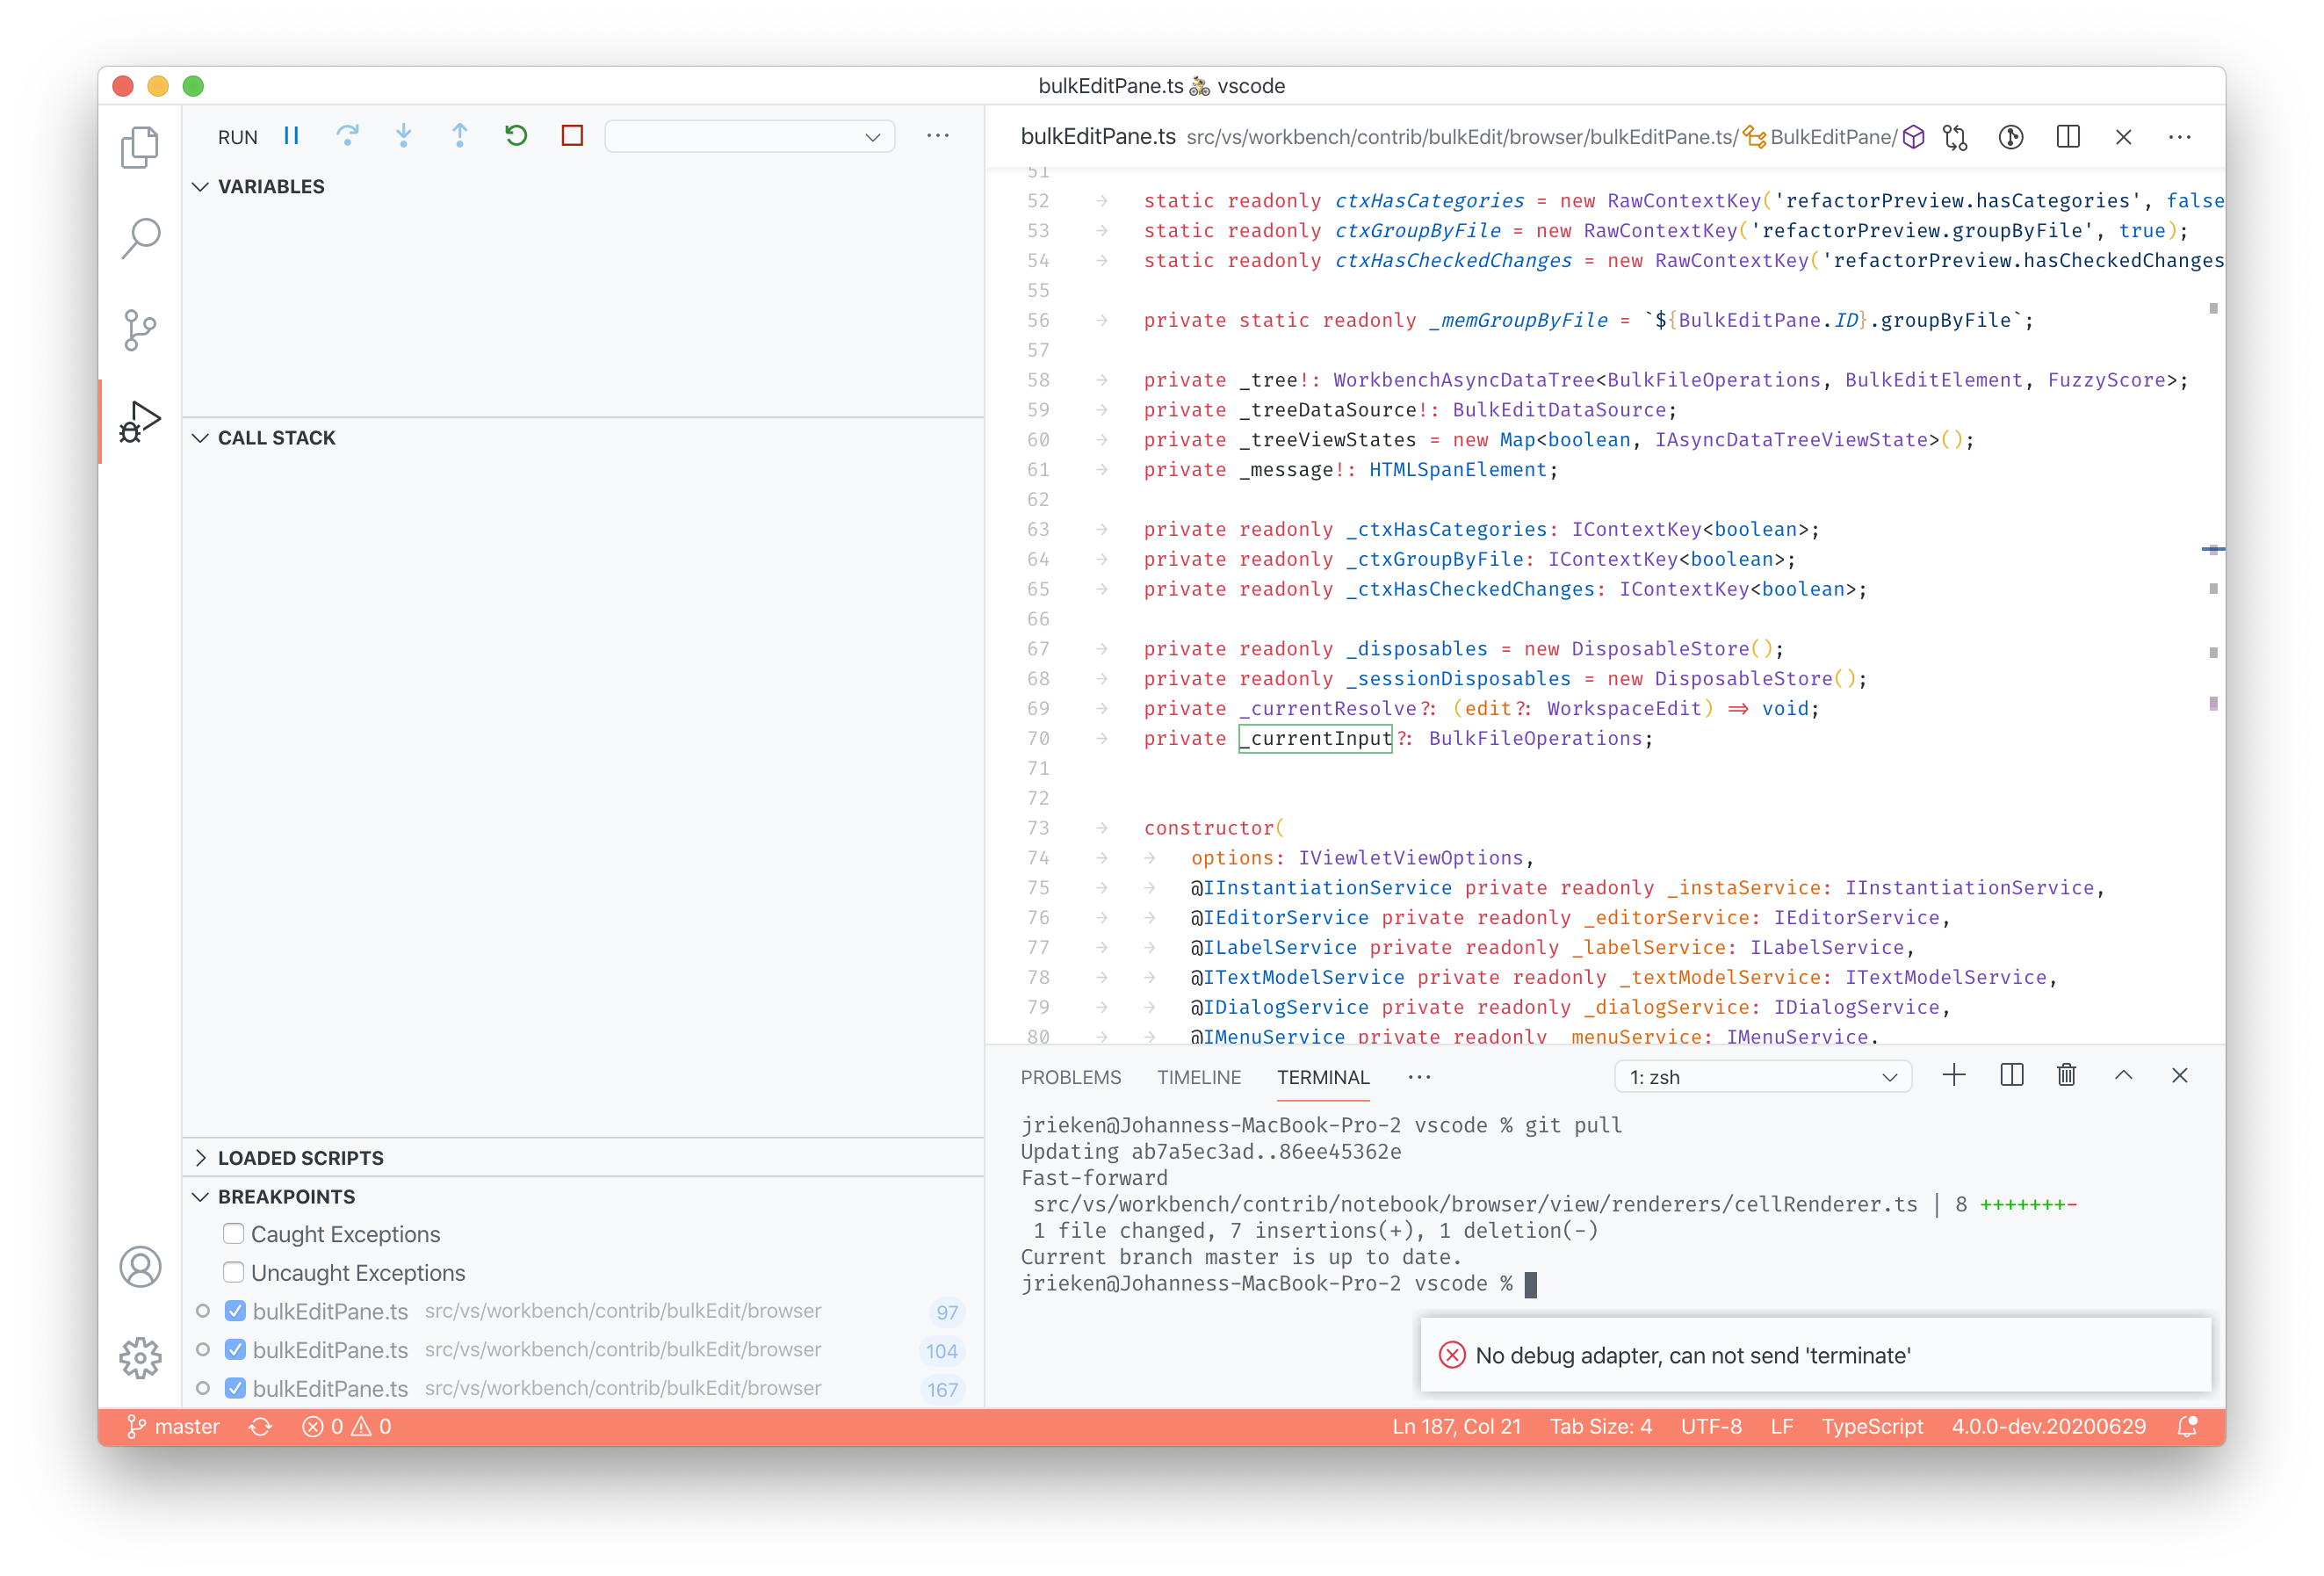
paper-cuts: this just happened after stopping the VS Code launch config... Window is stuck thinking it still debugs, stopping again shows the message
jrieken
on 6 Jul 2020
Thanks for the report! I was actually able to contrive the scenario where this happens -- it means we were missing a terminated signal from one of the debugee sessions. Like all good race conditions, I was not able to hit that with vscode locally, but I think it may be caused by the introduction of the web worker extension host + behavior that I fixed in https://github.com/microsoft/vscode-js-debug/commit/543c982ca9de9f9391cc5463065fa329312de3a4. Please let me know if you @jrieken or @joaomoreno see it again / have seen it since that commit was made and published.
Getting stuck in that state is a bug in VS Code. But I would like to leave it for a couple more days to see whether the underlying js-debug issue is still present. Tracking that in https://github.com/microsoft/vscode/issues/102037 to fix this iteration.
connor4312
on 10 Jul 2020
Trying to debug tsserver from the VSCode launch config. Sorry, but it is horrible
jrieken
on 10 Jul 2020
⬆️ if you wanna feel the pain, do this
- get joh/tsnb
- using rob's markdown-notebook extension
- open the file below
- tsserver will crash, try to debug it before that.
jrieken
on 10 Jul 2020
@jrieken if you're debugging in TS, try disabling smartStep in your debug configuration. TypeScript sources have sourceMapUrls, no sourcemaps. It's therefore are eligible for smart step (so js-debug will try to automatically step through that code).
Also cc @roblourens -- I know this is the way it is working, but unsure is smartStep is _meant_ to work this way.
connor4312
on 11 Jul 2020
if you're debugging in TS, try disabling smartStep in your debug configuration
Slowly getting it now. What would be cool is smartStep is soo smart that it does skip over things that I haven't explicitly started, e.g it shouldn't be inherited to child processes
jrieken
on 11 Jul 2020
Maybe this is electron 8 or not but my take away is that debugging is not useable for real work. Doing a real debug, code, reload-window cycle means that 1 out of 3 times the renderer hangs. It is true PITA and worst is that when debugging works it works really, really well. This is like a drug addiction, you keep trying it but you know it's bad after all.
jrieken
on 11 Jul 2020
A bunch of screen recordings: https://1drv.ms/u/s!AmNrgp2f2IPi0G8kORkOMSRP0gyY?e=EurJYL. I have refactored the call hierarchy title actions and tried to debug to understand why things weren't working anymore. Roughly 1 crash per 5 minutes.
More random observations:
- VS Code doesn't focus when hitting a break point (given the pre-story that makes me think its froozen again)
- I often have to terminate the "attach to extension host" config
- I always see the timeout 1000ms notification
- When you don't properly kill all of crashed vscode and try again then you are in real trouble (I think the last recording shows this)
And sorry for just throwing a bunch of recordings in your direction. I should file bug but I don't know where to start, consider this user study recordings 📷
jrieken
on 11 Jul 2020
TypeScript sources have sourceMapUrls, no sourcemaps. It's therefore are eligible for smart step (so js-debug will try to automatically step through that code).
Oh, that sounds like a bug. It should only skip when there is an actual sourcemap but no mapping.
I've seen crashing too, I think it got worse again after we got back on electron 8. I think we are behind the latest Electron version so hopefully it's fixed in 9 or 10.
roblourens
on 11 Jul 2020
Smart step issue fixed in https://github.com/microsoft/vscode-js-debug/commit/54a5cf25d9b120c1e6966a7849c667322de675f8
connor4312
on 14 Jul 2020
I frequently see timeout when first launching because electron/built in extensions take so long, can we run these in a prelaunch task so they pass quickly the second time when we're trying to attach?
 Tyriar
on 15 Jul 2020
Tyriar
on 15 Jul 2020
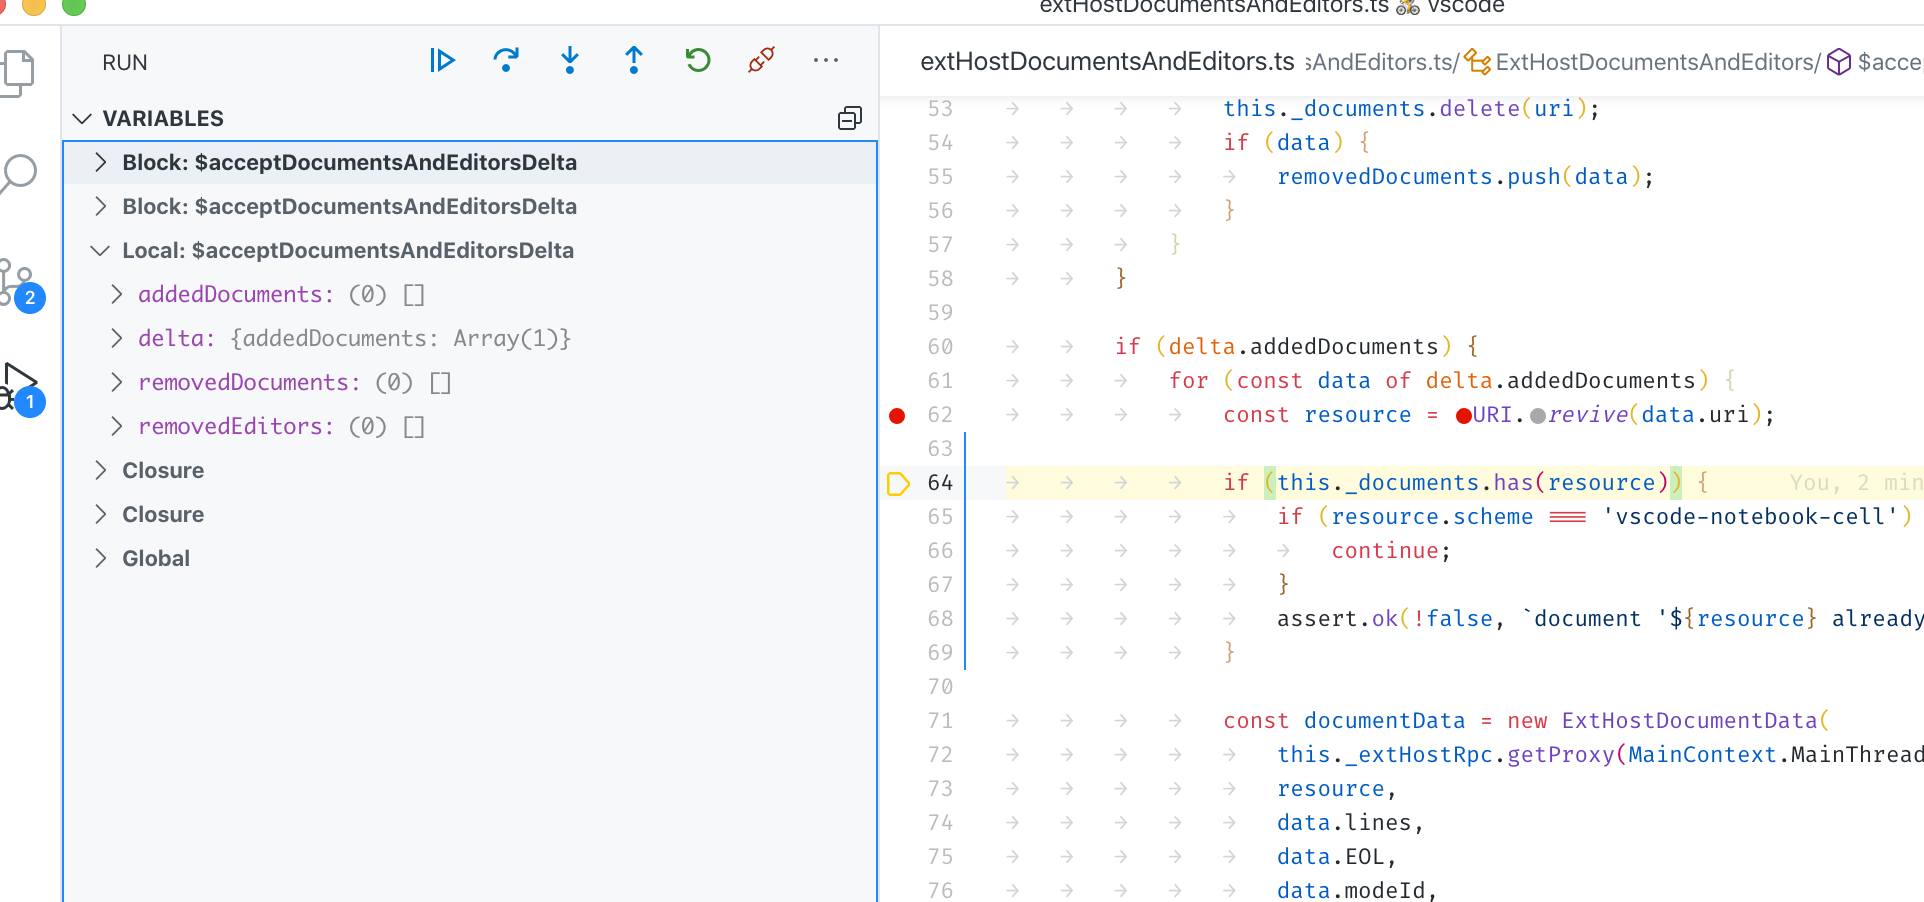
Still/again collapsed variable scopes when hitting a breakpoint @isidorn
jrieken
on 16 Jul 2020
I'm back to selfhosting on this. Things feel more stable now, thanks for all the hard work!
Here's some more paper cuts:
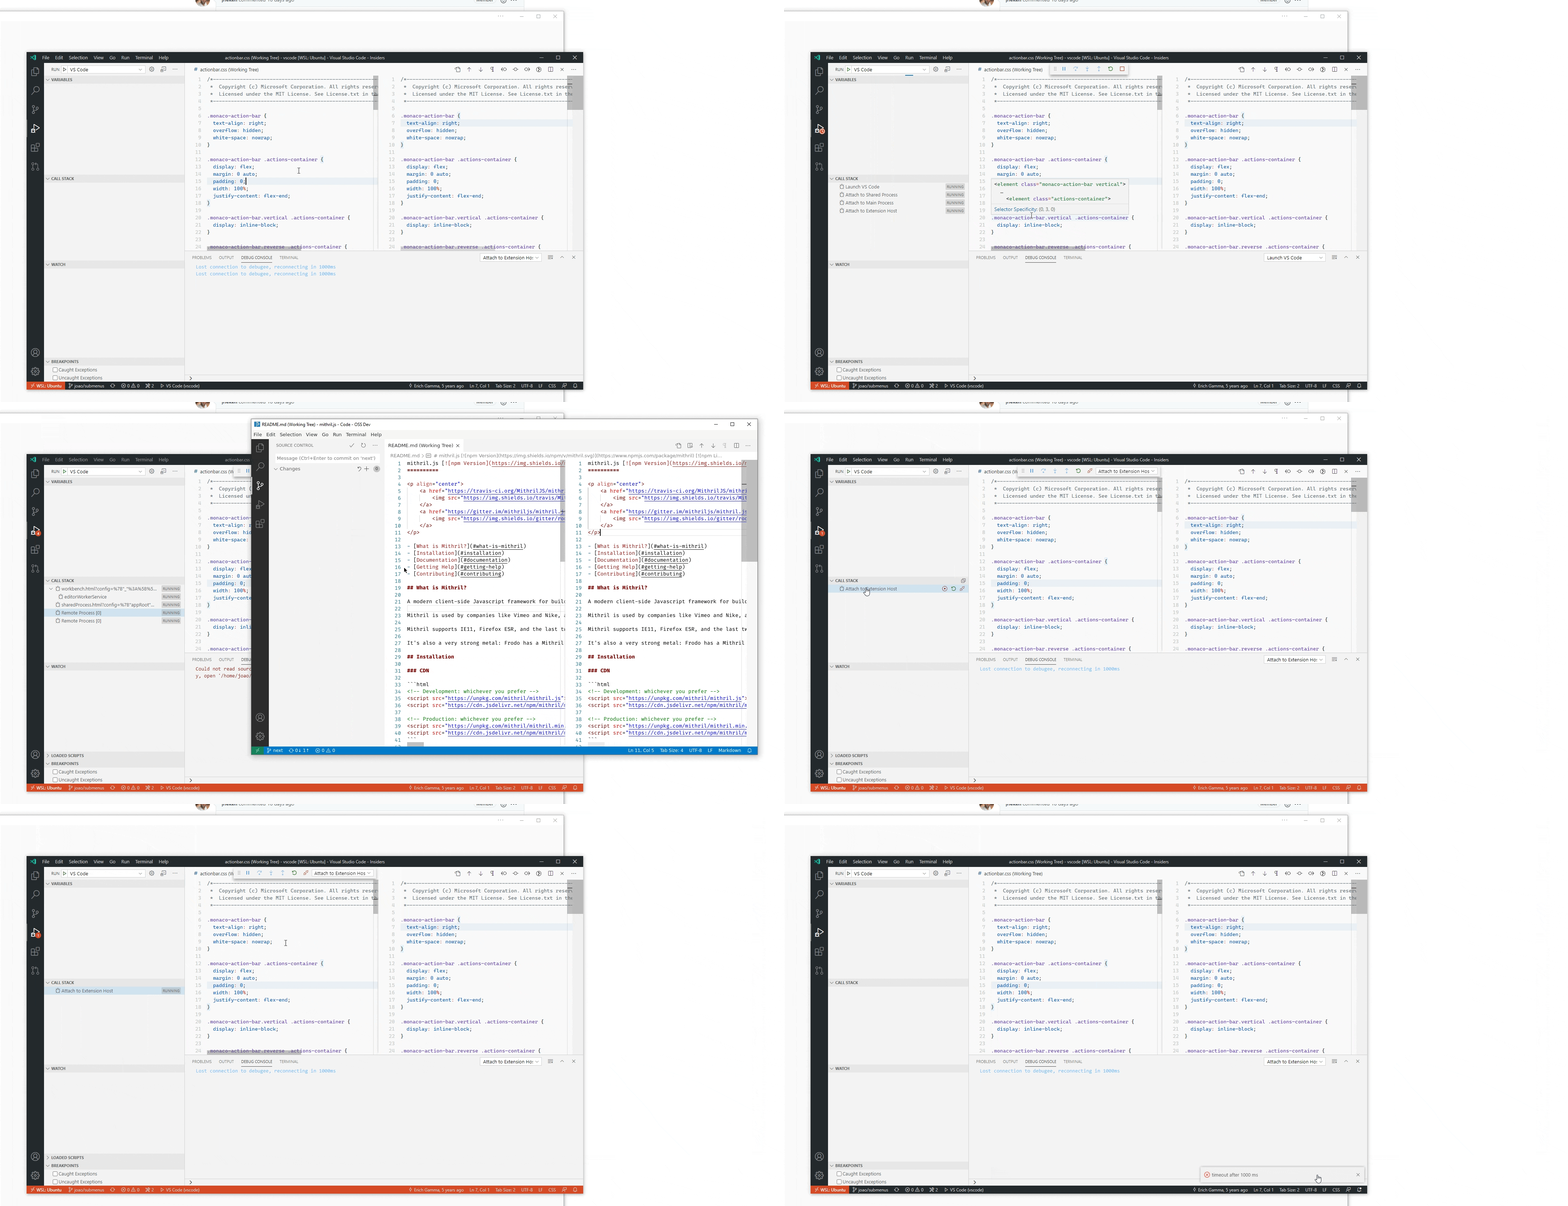
When quitting Code OSS:
- the extension host debug target stays running forever
- I have to click detach to make it go away but clicking it has a noticeable delay until it actually goes away
- once it does go away, a shoddy
timeout after 1000msnotification pops up
joaomoreno
on 22 Jul 2020
Just had the freezing issue on reload, when devtools are open again. So E9 doesn't fix it. Though it seems to happen much much less often.
joaomoreno
on 22 Jul 2020
Freezing on reloading happens extremely often for me. @deepak1556 can you reproduce it? Literally just
- Run the "Launch VS Code" config
- Reload the window
- Repeat a few times
- At some point the window loads then hangs and has to be force quit
We can try to debug it together if that would help
roblourens
on 22 Jul 2020
opened up https://github.com/microsoft/vscode/issues/100740
@roblourens I don't see the issue on my mac with those steps, trying linux now.
We can try to debug it together if that would help
Yeah lets get on a call, would be faster to debug
deepak1556
on 22 Jul 2020
I'm not sure whether it's the same. This seems to only happen when vscode is attached. It doesn't happen by launching code.sh by itself and having dev tools open.
roblourens
on 22 Jul 2020
Interestingly, the first time I opened OSS on electron 9 I got a freeze. This was launching via the debug task, but without a debugger attached (it had timed out waiting on yarn electron).
connor4312
on 22 Jul 2020
@connor4312 could that be a red herring considering the first launch with electron 9 tends to download the binaries in yarn electron step
deepak1556
on 22 Jul 2020
it had timed out waiting on yarn electron
This happens a lot when we have to download electron, but it's not what I'm referring to
roblourens
on 22 Jul 2020
Spinning out the collected issues thus far to make verification less confusing :)
- [ ] Window freezing https://github.com/microsoft/vscode/issues/103124
- [x] The extension host debug target stays running forever https://github.com/microsoft/vscode/issues/103705
- [x] Deatching from code oss' extension host has a delay/times out https://github.com/microsoft/vscode/issues/103706
- [x] Variable scopes are collapsed again(?) https://github.com/microsoft/vscode/issues/103707
- [x] Move initial extension and electron update from code oss launch config to a preLaunchTask https://github.com/microsoft/vscode/issues/103708
- [ ] Reconcile breakpoint locations for files modified locally https://github.com/microsoft/vscode-js-debug/issues/538 Still not sure how/if I want to deal with this, feedback welcome
Joh's "window has crashed" -- we're back on E7 for endgame, wondering if E9 will fix this? Will keep an eye out and to see if it happens on E7 and whether I'm able to catch the trace logs red-handed in that scenario.
connor4312
on 31 Jul 2020
Thanks @connor4312 thats super helpful.
deepak1556
on 31 Jul 2020
FYI that's the only thing I see when trying to debug (VS Code)

jrieken
on 12 Aug 2020
I've stopped trying to use the debug target because:
- It often takes so long to launch, not just when electron/built-in extensions need to be downloaded, leading to a bunch of modals
- It now launches 2 windows? Closing one of them closes the other
- I sometimes get empty windows as called out here https://github.com/microsoft/vscode/issues/100368#issuecomment-672691766
- Closing VS Code does not stop debugging the extension host
- nit: timeout notification when stopping debugging
Tyriar
on 12 Aug 2020
Thanks for the update, will look at this today or tomorrow.
connor4312
on 12 Aug 2020
It often takes so long to launch, not just when electron/built-in extensions need to be downloaded, leading to a bunch of modals
🏃 I pushed some changes that should improve startup time. We were doing something slow in startup that, in the VS Code case, is no longer needed. Please let me know if that improves things for you.
✔️ I also realized that I only added the "Ensure Prelaunch Dependencies" task to "Launch VS Code", so if you launched the compound task where an update was needed the attachment configs would time out. Fixed that as well...
It now launches 2 windows? Closing one of them closes the other
✔️ Internally js-debug has kind of a legacy feature where tracks the first debug target (in this case, browser page) it sees as the "main target" and stops when it is closed. I think that's what you're hitting here; VS Code might open two windows when it's restoring the state (I assume?) and you're closing the one that's designated as the main target.
Tomorrow I will see if we can remove I have now removed this, it should be good enough to say that as long as one target is alive the debug session should continue.
Closing VS Code does not stop debugging the extension host
✔️ It wasn't my intended purpose when I prompted it, but now that we have a stopDebugging API, I was able fix this correctly. Should work in the next nightly js-debug build 🙂
nit: timeout notification when stopping debugging
✔️ Isi fixed this in today's Insiders.
I sometimes get empty windows as called out here
❓ The message indicates that the Electron instance didn't start listening or didn't have good data on localhost:9222. So the debugger didn't connect, and VS Code was waiting indefinitely. Next time you hit that, please try going to http://localhost:9222/json/list; see if it loads and what's there.
Also, is seeing that specific error (cc @jrieken) recent since today/Electron 9? Wondering if there's some behavioral change or bug there.
connor4312
on 13 Aug 2020
Just like @Tyriar (see https://github.com/microsoft/vscode/issues/100368) I have stopped trying to use the debugger for selfhost, esp. the "VS Code" launch config, I much more pain than gain. Tho, I do use attach to extension host with moderate joy.
jrieken
on 2 Sep 2020
I resumed using this today with E9 and it seems to work much better than before, actually.
joaomoreno
on 2 Sep 2020
I still get https://github.com/microsoft/vscode/issues/105019 from time to time, but it's my only current pain point.
roblourens
on 2 Sep 2020
I have stopped trying to use the debugger for selfhost, esp. the "VS Code" launch config, I much more pain than gain
Please let me know if you try it again and run into more issues! The issue the Rob mentioned and the slippery #103707 are the only two outstanding issues I know of.
connor4312
on 2 Sep 2020
Moving to September since this is on-going work and nothing more is planned for this milestone as far as I know.
isidorn
on 3 Sep 2020
There've been no more issues on here this month, thus closing it. Please give me a shout if you run into any further problems!
connor4312
on 28 Sep 2020
Related issues
 borekb
·
3Comments
borekb
·
3Comments
 ryan-wong
·
3Comments
ryan-wong
·
3Comments
 omidgolparvar
·
3Comments
omidgolparvar
·
3Comments
 curtw
·
3Comments
curtw
·
3Comments
 DovydasNavickas
·
3Comments
DovydasNavickas
·
3Comments
Most helpful comment
🏃 I pushed some changes that should improve startup time. We were doing something slow in startup that, in the VS Code case, is no longer needed. Please let me know if that improves things for you.
✔️ I also realized that I only added the "Ensure Prelaunch Dependencies" task to "Launch VS Code", so if you launched the compound task where an update was needed the attachment configs would time out. Fixed that as well...
✔️ Internally js-debug has kind of a legacy feature where tracks the first debug target (in this case, browser page) it sees as the "main target" and stops when it is closed. I think that's what you're hitting here; VS Code might open two windows when it's restoring the state (I assume?) and you're closing the one that's designated as the main target.
Tomorrow I will see if we can removeI have now removed this, it should be good enough to say that as long as one target is alive the debug session should continue.✔️ It wasn't my intended purpose when I prompted it, but now that we have a
stopDebuggingAPI, I was able fix this correctly. Should work in the next nightly js-debug build 🙂✔️ Isi fixed this in today's Insiders.
❓ The message indicates that the Electron instance didn't start listening or didn't have good data on localhost:9222. So the debugger didn't connect, and VS Code was waiting indefinitely. Next time you hit that, please try going to http://localhost:9222/json/list; see if it loads and what's there.
Also, is seeing that specific error (cc @jrieken) recent since today/Electron 9? Wondering if there's some behavioral change or bug there.