Vscode: Explore improving the single file debug experience
Today VS Code debugging has no generic way to know whether a debug extension implements "single file debugging". Without this knowledge it is not possible to provide a standardised UX experience for this case.
Because of this some debug extension have started to create their own UI. A good example is the Python extension which shows a play button in the editor:

 weinand
All 51 comments
How "single-file debugging" works today:
- precondition:
- no launch.json exists in workspace
- program is open in current editor
- based on language type of current editor all debug extensions are searched that are configured for that language (
languagesproperty in thedebuggerscontribution). - if more than one is found, a Quickpick is used to let user pick one debug extension
- the extension is activated
- if the extension implements
resolveDebugConfiguration, it is called with an empty in-memory launch config - If the debug extension supports "single-file debugging without launch.json", it understands the empty in-memory launch config and "upgrades" it, so that it starts debugging on the file that is open in the editor.
- if no extension can be found or if an extension doesn't support the "single-file debugging without launch.json" nothing happens.
@isidorn is that a faithful description of the current behavior?
weinand
on 20 Mar 2020
@weinand yes this is faithful description of the current flow.
Just a nitpick: if no extension can be found we do not open launch.json. We will only open launch.json if an extension explicitly tells us to do that by returning null.
 isidorn
on 20 Mar 2020
isidorn
on 20 Mar 2020
What are the problems/paint points that we try to address?
A first pair of problems is related to the fact that VS Code behaves differently if the workspace has a "launch.json" or not:
- Assuming that no "launch.json" exists in the workspace, VS Code does not know (upfront) whether a project (workspace) is debuggable, e.g. whether pressing a play button would successfully start a debug session. Corollary: VS Code does not know the reason why a project (workspace) is not in a debuggable state either. These problems makes it difficult to offer a robust "Run" button in the Welcome view. If the debug extension does not support "single-file debugging without launch.json", pressing "Run" does nothing (and we do not really know why and cannot help the user).
- If a launch.json exists, VS Code assumes that the user uses it exclusively (by selecting a launch config and executing it) and no smartness is employed. Even if a debug extension implements the "single-file debugging without launch.json" scenario, it is no longer available in the UI. That's the reason why the Python debug extension adds a "Play" button to the editor: with this button a user can quickly and easily override a currently selected launch config and start debugging on the file open in the editor.
Another problem comes from the fact that VS Code does not want to activate debug extensions eagerly. As a consequence VS Code can only rely on the declarative information available in the package.json but not on running extension code.
Today VS Code only knows the supported languages of a debugger. This information is used in the "single-file debugging without launch.json" scenario for activating a debug extension based on the language open in the current editor. But this mechanism does not work if a file with an unsupported language is open in the editor or if there is no file open at all. Running extension code could easily figure out that the project (workspace) is runnable/debuggable. E.g. it could determine the entry-point of the project by analysing the package.json. (Actually this code exists already in many debug extensions but it cannot be used without activating the debug extension).
"Run without debugging":
DAP defines protocol for "Run without debugging" and VS Code implements it, but not all debug extensions are implementing it.
Since there is no way to figure out whether a debug extension implements the "Run without debugging", VS Code always provides UI for "Run without debugging" even if the debugger doesn't support it. Typically this is not a big problem because a debug extension will fall back to "Debug" if "Run without debugging" is not implemented.
Some proposals (in no specific order):
- Introduce explicit extension API (e.g.
provideWorkspaceDebugConfiguration) to have the debug extension communicate back to VS Code the following information:
- whether debug extension supports a "Run/Debug" in the current situation (without relying on launch.json or relying on an active file in the editor)
- if the debug extension cannot figure out what to run/debug, it should report back a message explaining why run/debug doesn't work and what to do.
VS Code would use this API for the Welcome view and "F5" (if no launch.json exists and there is no active file). E.g. in the a Node.js this API could find the program's entry point in the package.json. Today the resolveDebugConfiguration is able to launch the program in that case but we are not able to show a Play button if the user has the package.json open in the editor.
If "run/debug" is not possible the welcome view could show how to fix this.
- Introduce explicit API for running/debugging a file (or resource?), e.g.
provideFileDebugConfigurationorprovideResourceDebugConfiguration. VS Code would use this API for supporting a "Play" button in the editor. - Introduce new API for determining whether the DA supports the "noDebug" mode (surfaced as "Run without debugging"). I'm not sure whether it is sufficient to add this to the DAP or whether this must be extension API or just a new attribute on the "debuggers" contribution (dependent on the location of the API the info would be available statically, dynamically on extension activation, or dynamically on debug session start).
- the problems resulting from the fact that VS Code tries to avoid activating debug extensions eagerly are more difficult to solve. Possible approaches:
- activate at least one debug extension eagerly based on historic information from previous debug sessions. We have this information already as a "when" context.
- try to match an active language extension automatically with the corresponding debugger extension. This is based on the assumption, that a beginning user starting a Python project most likely needs a Python debugger.
How to design the APIs?
Today some of the debug extension APIs revolve around "debug configurations" (provideDebugConfigurations, resolveDebugConfiguration, startDebugging).
To continue this "style", I propose that new APIs follow suit:
instead of introducing a new API for "start debugging a workspace/project" or "start debugging a file", we could introduce a new function provideDebugConfiguration(options) that based on the passed ´options´ returns a debug configuration (or an descriptive error if debugging isn't possible). The debug configuration can be passed to startDebugging to actually launch a debug session. Since provideDebugConfiguration(options) does not start the debug session itself, it can be used for probing whether debugging is possible.
weinand
on 25 Mar 2020
Good analysis of our current limitations. I can brainstorm on potential ideas on how to solve some of these, but you might be already writing this, so let me know once you are looking for feedback. Thanks!
isidorn
on 25 Mar 2020
@isidorn I'm done with my proposals. Please review and provide feedback. Thanks.
weinand
on 25 Mar 2020
Discussion will be continued in April.
weinand
on 26 Mar 2020
Good writeup. Some feedback:
Play button
In order to know if VS Code should put a Play button in the editor title VS Code should ask all activated debug extensions if they support a Play button for that file. If any of them do, the Play action should be there. The extensino can not decide this based on VS Code api, but VS Code debug UX would have to pass the file / uri for who it is asking. Because there can be inactive editors opened side by side.
This could be done by your proposel of provideDebugConfiguration. VS Code would simply call this for any visible editor for all adapters, and if there is 'candidate' we would show the play button.
Extension activation
I do not see the issues of extensions not being activated. If the extension is not activated then 99% it can not handle the open file, since it would already activated on that file type.
To make this discussions more scoped and tue to the previous reason I suggest to handle the issue of extension activation seperatly.
If you think we should solve this with this issue what would be the example scenario where the extension is not activated? The only scenario I see is I just opened a workspace and I did not open a file, I just want to press F5 to run. However that seems unrelated to the single file discussion.
Run without debugging
This sounds best fitted for a static contribution point via package.json imho. However if a debug extension says no to this how would that change the VS Code debug ux experience. Just some actions would be disabled?
fyi @connor4312 @roblourens
isidorn
on 26 Mar 2020
@isidorn thanks for the feedback.
Play Button:
"should ask all activated debug extensions": yes, but the "activated" is already a problem: if a user has created a new Python file, the debugger is not activated and no Play button will be shown. This can be solved by either adding some static contribution point attribute ("supportsFileDebug") or by activating the debug extension together with the language extension and using the proposed provideFileDebugConfiguration.
Extension Activation:
"what would be the example scenario where the extension is not activated": see above.
You said: "If the extension is not activated then 99% it can not handle the open file, since it would already activated on that file type." With "extension" you mean language extension, right? But language extension and debugger extension do not yet have a dependency. So activating the language extension does not activate the debugger extension.
Run without Debugging:
Yes, with a contribution point attribute we could more precisely show/hide the actions: e.g. no "Run without Debugging" if the extension does not support it. If the contribution point attribute
is missing we would fall back to the current imprecise behavior.
weinand
on 30 Mar 2020
I was thinking that most extensions are actually a debugger and a language service in one (but that does not have to hold). In order to better decide on the activation strategy and if it needs a solution I would be interested in how many debuggers are out there that do not activate on opening of a file type they are interested in.
And I do agree they could activate on a new event tied with provideFileDebugConfiguration.
Run without debugging: makes sense.
isidorn
on 30 Mar 2020
Most prominently none of the node.js/JS debuggers are tied to the Typescript and Javascript language extensions...
weinand
on 30 Mar 2020
Apologize if this does not belong here, if so you can mark it as off-topic and I could potentially create a new issue.
It sounds as if this issue partially implements functionality of https://marketplace.visualstudio.com/items?itemName=formulahendry.code-runner. If this is true and that this issue implements run one file, then it would be cool to extend it to be able to run with the selected text i.e.
"Run selected code snippet in Text Editor"
 thernstig
on 14 Apr 2020
thernstig
on 14 Apr 2020
@testforstephen this is very interesting. I think Java debugger already supports debugging single files. Could you join the discussion here?
 akaroml
on 15 Apr 2020
akaroml
on 15 Apr 2020
@thernstig this issue is more focused on debugging a single file than just running. So we want to provide another universal entry point into debug extensions. Any debug extension that is interested in improving its single file debug experience would be able to participate.
The extension you are mentioning above doesn't deal with debugging at all and it is not open for new languages.
weinand
on 21 Apr 2020
Play Button:
I like the play button for single file debugging. Regarding the question of whether to enable the play button for the active editor, I tend to let the debugger tell the vscode in some sort of static way, such as a static contribution point attribute ("supportsFileDebug") as you mention. The proposed provideFileDebugConfiguration API should only be used after the play button is clicked. Trigger the debugging if the API returns a debug configuration (or an descriptive error if debugging isn't possible).
If you judge whether or not to enable play button by calling the proposed provideFileDebugConfiguration API, the cost can be a bit high. For example, a single Java file can be run only if it contains static main method. If you want to be accurate, you need to keep asking the debugger for a confirm when the user is editing the file. This is a bit over-designed. Static declaration of whether support for single file debugging is sufficient imho.
Keep single file config in memory or persist?
Also need consider whether to persist the in-memory config into launch.json. Maybe that's something for debuggers to consider. In current Java implementation, if no launch.json exists, the auto-generated single file config will be kept in memory. But if launch.json exists, then persist it for reuse and customization.
Run without Debugging:
Lastly considering Run without Debugging, it's more popular than debugging. In Java single file debugging support, we add Run and Debug CodeLens on top of a main method. And the click ratio between Run and Debug is about 7.5 : 1.
 testforstephen
on 27 Apr 2020
testforstephen
on 27 Apr 2020
@testforstephen great feedback, thanks a lot.
We will consider this in May when we finish the work on this.
weinand
on 27 Apr 2020
After reading the comments from above again, I came to the conclusion that we do not need any additional architecture or API in order to "improve the single file debug experience".
We just need guidelines to ensure that the "single file debug experience" is identical across different debuggers.
Here is a proposal for the "single file debug experience" guidelines:
VS Code debug extensions that support debugging of single files without any setup should follow these guidelines:
- statically contribute "run" and/or "debug" menu actions to the editor title in a specific area reserved for "debug" actions (group "debug").
- specify a "when" clause to show the menu actions only if the editor's contents matches the languages for which run/debug is supported.
- associate the menu actions with "run" and "debug" commands. Use the symbolic
$(play)and$(bug)icons to have the menu actions showing up as buttons with the correct icons. - implement the "run" and "debug" commands in the debug extension. For execution VS Code will pass the resource URI of the editor's contents to the command implementation. Use this resource URI to create a launch configuration and pass this to the
vscode.startDebuggingAPI. - Because the existence of the menu actions in an editor title does not activate any extension, add the "run" and "debug" commands to the
activationEventssection of the package.json.
I've implemented this proposal in Mock Debug:
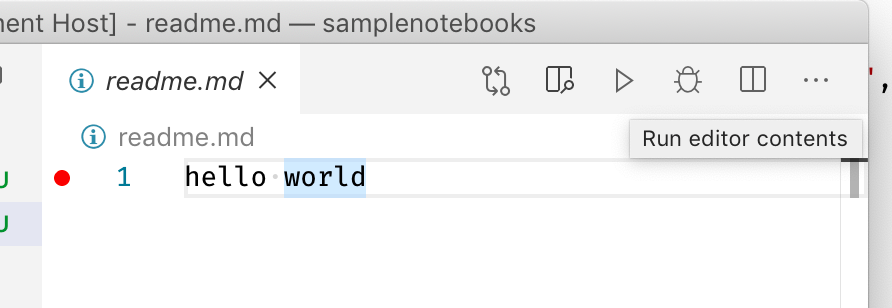
Here are the resulting declarations from the package.json:
"contributes": {
  "menus": {
    "editor/title": [
      {
        "command": "extension.mock-debug.runEditorContents",
        "when": "resourceLangId == markdown",
        "group": "navigation@1"
      },
      {
        "command": "extension.mock-debug.debugEditorContents",
        "when": "resourceLangId == markdown",
        "group": "navigation@2"
      }
    ]
  },
  "commands": [
    {
      "command": "extension.mock-debug.debugEditorContents",
      "title": "Debug editor contents",
      "icon": "$(bug)"
    },
    {
      "command": "extension.mock-debug.runEditorContents",
      "title": "Run editor contents",
      "icon": "$(play)"
    }
  ]
},
"activationEvents": [
  "onCommand:extension.mock-debug.runEditorContents",
  "onCommand:extension.mock-debug.debugEditorContents"
]
And here is the implementation in extension.ts:
vscode.commands.registerCommand('extension.mock-debug.runEditorContents', (resource: vscode.Uri) => {
    vscode.debug.startDebugging(undefined, {
        type: 'mock',
        name: 'Run editor contents',
        request: 'launch',
        program: resource.fsPath,
        noDebug: true
    });
});

vscode.commands.registerCommand('extension.mock-debug.debugEditorContents', (resource: vscode.Uri) => {
    vscode.debug.startDebugging(undefined, {
        type: 'mock',
        name: 'Debug editor contents',
        request: 'launch',
        program: resource.fsPath
    });
});
The only missing piece of these guidelines is the "debug" group for the "editor/title" contribution. This group should make sure that the "run" and "debug" buttons appear at the left most position.
@isidorn @testforstephen @akaroml what do you think?
weinand
on 23 Jun 2020
@weinand great work, I really like this for the following reasons:
- Does not add additional API
- Has a consistent look and feel across extensions (we use same icons)
- Has a similar approach to what Python already successfuly used for their use case
I can look into adding the debuggroup to the editor title menu, so that group is all the way to the left.
What I think can be potentialy simplified instead of having both Run and Debug we could just go with one and the other could be an alternative action which is shown on alt hover. This behavior can for example be seen when holding the alt key and hovering over the X in the editor title.
My suggestion: main action is "Start Debugging" but is using a triangle icon (same as we do in debug view). Alternative action is "Run Without Debugging" (we will find a good icon).
My intuition is telling me that Java users click more on Run than Debug because they are not aware that Debug without breakpoint is just Run. So I would not be too worried about people not clicking on the "Start Debugging" action.
What I am a bit worried is us cluttering the editor title area, and thus the reason why I prefer only one action.
fyi @luabud and @int19h for python feedback. Do you like this approach so all languages are consistent. And since you went with one button did you hear feedback about not being able to find the Run Without Debugging button? Or your current Play button in Editor was already ignoring breakpoints?
@weinand I can also present this in the UX meeting. fyi @misolori
isidorn
on 23 Jun 2020
The reason why I suggested to have separate actions for "run" and "debug" is for easier discoverability.
Using the "alt" key when pressing an action is more an advanced gesture and not something for beginners.
And my proposal said "and/or" so having both actions is not a hard requirement.
@isidorn yes please present this in the UX meeting.
weinand
on 23 Jun 2020
I've implemented this proposal in Mock Debug
@weinand should the updated Mock Debug behave differently depending on whether I use the new Run commandbutton or the new Debug one? I'm not seeing any difference. Run stops on my breakpoint in the same way as Debug does.
 gjsjohnmurray
on 24 Jun 2020
gjsjohnmurray
on 24 Jun 2020
Here are the resulting declarations from the
package.json:
...
name: 'Run editor contents',
...
name: 'Run editor contents',
@weinand I suggest you capitalize Editor Contents so as to model tooltips whose style conforms to the rest of VS Code.
gjsjohnmurray
on 24 Jun 2020
One thing of relevance to the discussion on one vs two buttons, and what should be the default if it's just one - it is not always true that debugging without breakpoints is the same as no debugging, at least when it comes to performance. This can vary substantially between languages and runtimes, and Python is on the more disparate end of the spectrum. Since we have to work with a runtime that's not really optimized for high-perf debugging, the overhead can be as much as an order of magnitude in some (admittedly mostly corner) cases, even with a lot of tricks and hacks employed to minimize it. This is one of the biggest reasons why we don't just default to debugging everywhere.
(@luabud might have more reasons for why it's "Run" and not "Debug" - this is the one I'm most intimately familiar with.)
 int19h
on 24 Jun 2020
int19h
on 24 Jun 2020
@gjsjohnmurray yeah, mock debug did not implement "run without debugging" (because it doesn't make a lot of sense to "run" through a readme file without doing anything). I've fixed that and the other issues you've found. Thanks.
weinand
on 24 Jun 2020
@int19h you brought up an interesting topic:
are there actually 3 run modes: "run", "debug", and "debugging without breakpoints" ?
Here is the current state of things in VS Code:
VS Code has these commands:
- Debug: Start Debugging
- Run: Start Without Debugging
So a "debugging without breakpoints" does not exist in VS Code (and not in the debug adapter protocol either),
and I think "debugging without breakpoints" is a bad idea and not a good synonym for "Start Without Debugging".
The only reason why we have a generic "Start Without Debugging" is that we wanted to "reuse" a user's effort put into a launch config for "running the program" (instead of debugging it).
But this requires an opt-in by the debug extension authors. They have to decide how to implement this "noDebug" mode. For node.js this is pretty simple: the same runtime (node.js) is used, but it is not put into debug mode. There is no performance difference between "run" and "run without debugging" because both use the identical runtime.
We never conceived that "run without debugging" is really implemented as a "debugging without breakpoints". If the Python runtime that is used for debugging involves a performance penalty, then "run without debugging" should not use that runtime.
Bottom line:
every debug extension can support "Start Without Debugging" in a way that involves no performance penalty.
So there is no need to distinguish between "Run" and a "Run slowly without debugging".
weinand
on 24 Jun 2020
To clarify, we do support "noDebug" in debugpy, and we specifically do this by not touching the debuggee at all - in that mode, launch.json controls what gets spawned and how, but that's that.
(We also do stuff like output redirection, because it can be done fully out of process without tracing.)
What I meant is that given two options: start with debugging vs start without debugging - there can be significant perf implications of picking the first as a default, and making the other one harder for users to discover & access. If both options are readily available, the user always decides, and we can educate them on the implications, so it's much less of a concern.
int19h
on 24 Jun 2020
@int19h yep, that argument for having two buttons makes sense.
weinand
on 24 Jun 2020
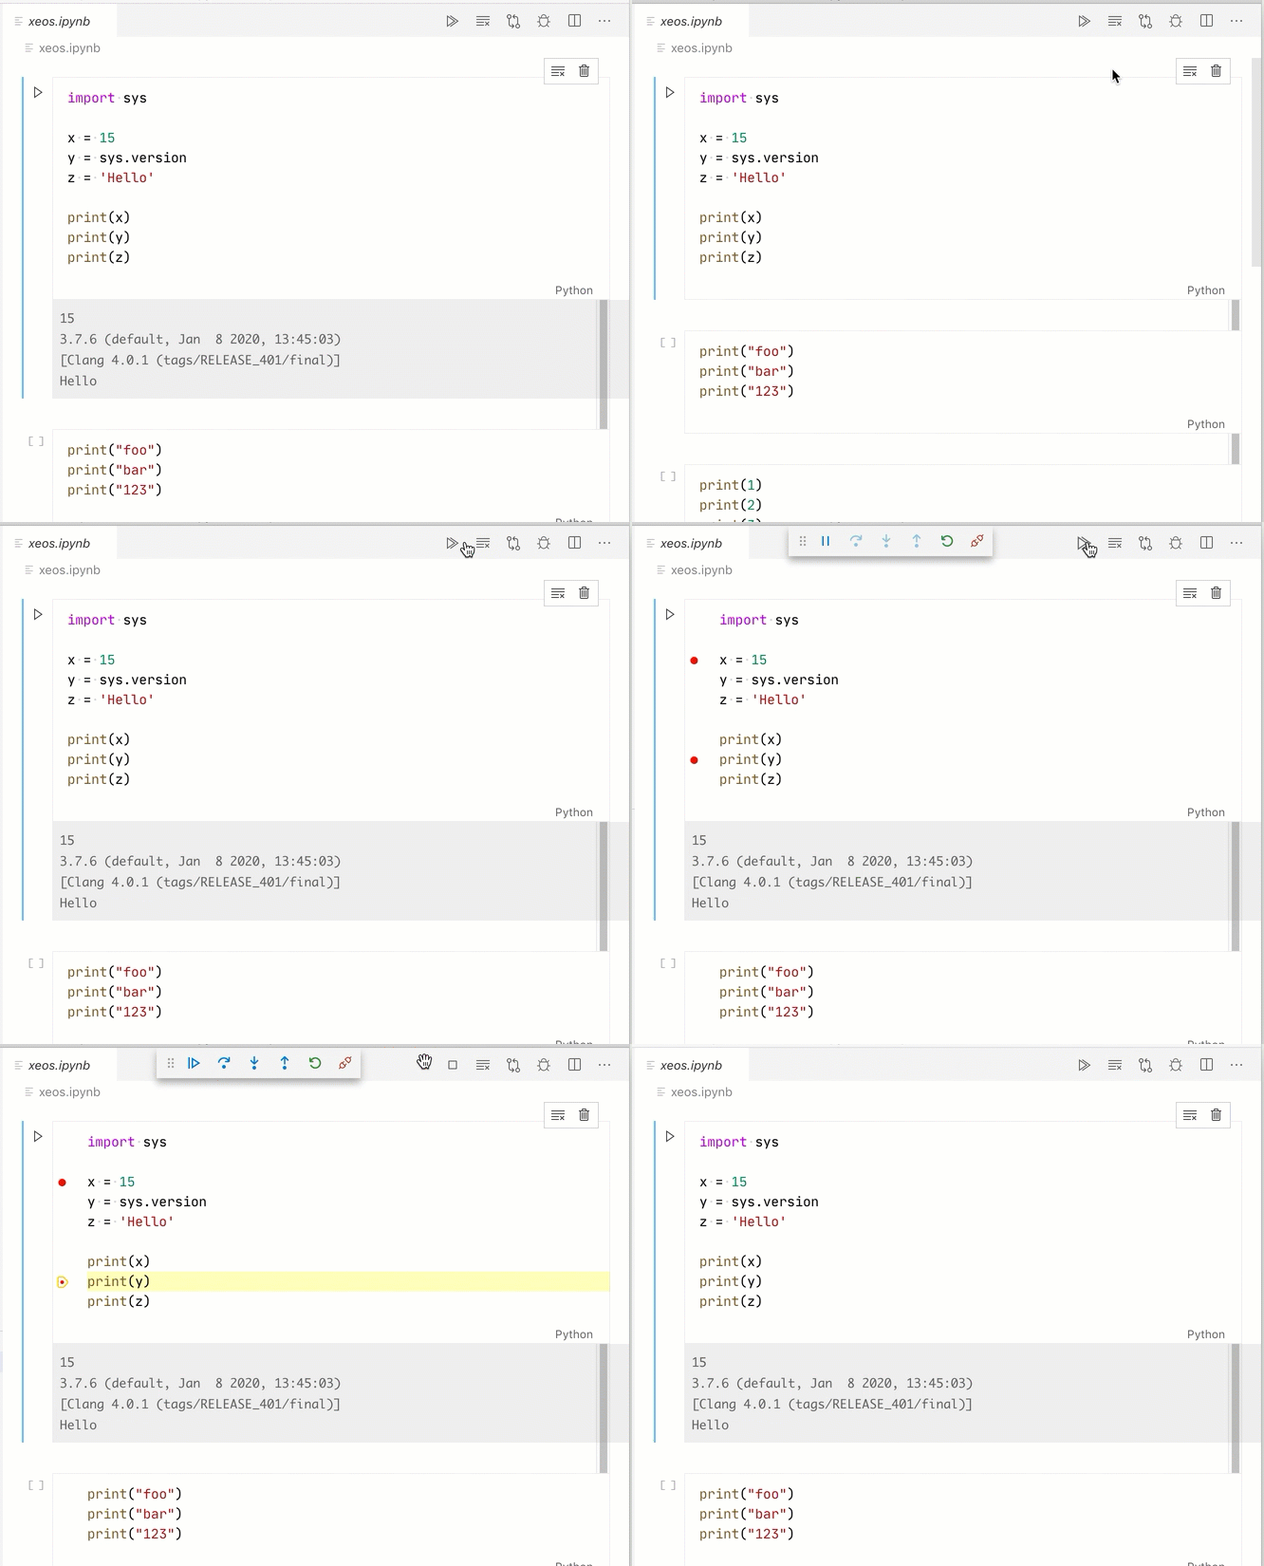
An alternative to two action buttons ("Run" and "Debug") is a single "Run" button and a "debug" toggle.
Here is an example from my Python notebook:
weinand
on 24 Jun 2020
@int19h Good argument for two buttons, thanks for sharing
@weinand Thanks for the checkbox idea however if we decide to go with two actions it is much more straight forward to just have run and debug as in the inital proposal. Having a checkbox instead there does not bring any value imho
Alternative idea: put one of the actions in the ... secondary menu.
isidorn
on 24 Jun 2020
The value of a "debug" toggle is the following:
- if debugging is a mode that enables changes to the UI (like enabling the breakpoint gutter), then a "debug" action doesn't help. First the user wants to enable the debugging mode to set some breakpoints, and the she runs the program to hit them.
- there is only one "Run" button (your proposal) and we could move the "debug" toggle to somewhere else (e.g. the overflow area). The "Run" button could show the tiny bug as an overlay when debug mode is on.
BTW, independent from the question of showing one or two actions in the editor title, it probably makes sense to have 3 octicons:
 $(play) for "Run"
 ${debug-alt) for "Run with debugging" aka "Debug"
 $(bug) for the "debug" toggle
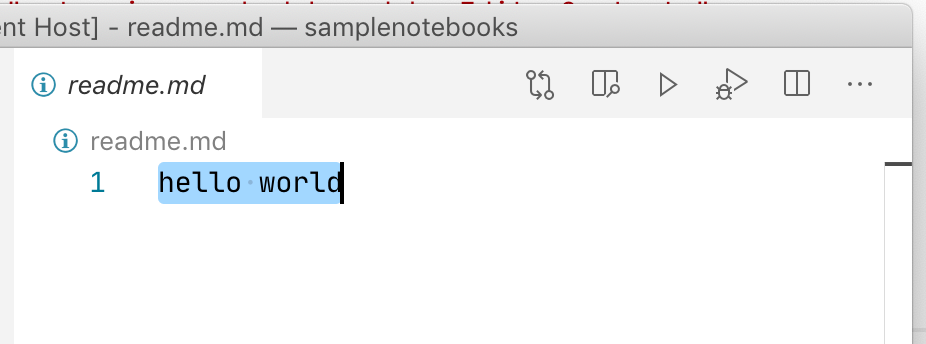
Mock debug showing both actions:
weinand
on 24 Jun 2020
@weinand I am not a fan of introducing a debug mode. For now the only use case is notebooks so the glyph margin is shown. If we want to introduce a debug mode I think it will overcomplicate things, though we can have a sepearte discussion on that I think.
As for three octicons I personaly find it confusing.
The only two solutions which make sense to me:
1) Your original proposal of having two actions in the title bar. For those I would use the $(play) and ${debug-alt) icons
2) Have one action in the title bar, and have a toggle in the ... The actions in the ... are text so we do not need an icon there. And the title bar action would toggle between $(play) and ${debug-alt)
isidorn
on 24 Jun 2020
@isidorn we are not introducing the "debug" mode in a broad way but an extension author might need to do this for various reasons. So we should not exclude that scenario.
I listed the three octicons only for completeness, not because they are used at the same time.
Basically they are used in two ways:
- initial scenario: depending on the needs of the debugger either or , or both are used.
- modal scenario: only one of and is shown at a time and is used as a toggle between them.
weinand
on 24 Jun 2020
@isidorn have you already seen submenus? Would they work in this context?
Could you please introduce a "run" group for menu/titles. I think "run" is a better name than "debug" because it is less narrow.
How can we better align the $(play) and ${debug-alt) icons without breaking anything where they are already used?
weinand
on 24 Jun 2020
Lots of great discussions here! One thing to notice is that for Python our green play button calls our "Run Python in Terminal" command, which calls the path to the selected Python interpreter and appends the file path to it:
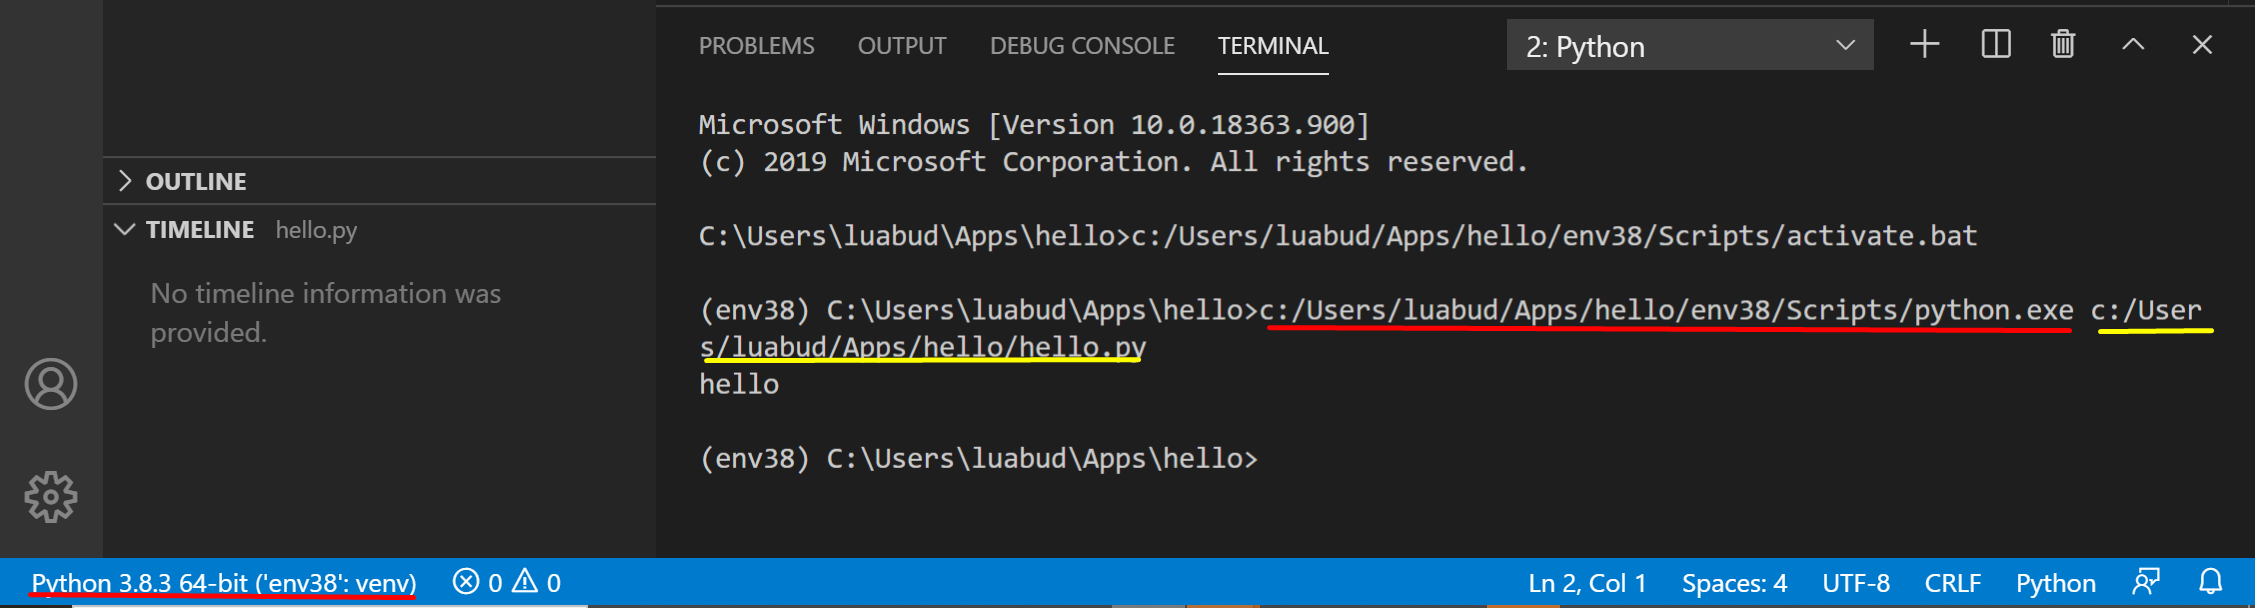
That means that we have a different concept for "Run" (no debugpy), "Run without debugging" (uses debugpy) and "Debug" (uses debugpy).
The feedback we hear from our users is that they'd love to customize the play button (https://github.com/microsoft/vscode-python/issues/10130, https://github.com/microsoft/vscode-python/issues/11036, https://github.com/microsoft/vscode-python/issues/11473, https://github.com/microsoft/vscode-python/issues/12509). So we thought of binding the icon to "Run without debugging" with the default configuration for Python files (bonus points if we could follow what is done for NodeJS and auto configure it - for Django and Flask apps for example 😁).
I like the idea of having different icons and being able to toggle between them. Another thing I thought of would be if VS Code provided just one icon ($(play)) and made it configurable so that users (and maybe extensions) could change what behaviour it's bind to.
 luabud
on 24 Jun 2020
luabud
on 24 Jun 2020
Using the latest vscode-mock-debug in a VS Code - OSS that I just built from master, the Run button makes the debug toolbar appear, then change, then disappear when the run has ended.

Can anything be done to prevent this unnecessary activity>
gjsjohnmurray
on 25 Jun 2020
The toolbar is useful for long-running code even without breakpoints in the picture, since it provides the means to pause or stop the process. And a real adapter wouldn't know in advance if the code is long-running or not.
int19h
on 25 Jun 2020
@weinand yes I can introdcue the run group.
The context menu would not work in this case imho, since the two clicks is a bit cumbersome.
As for the $(play) and $(debug-alt-small) we simply need to resize them so they are the same size and aligned. Looking at them the problem is the debug-alt-small which is not designed to be used in a horisontal action bar. We should resize it, and if that is not possible (activity bar might get broken) then we simply need to introduce a new codicon. @misolori is it possible that you look into this?
@luabud @int19h thanks a lot for great feedback!
@gjsjohnmurray as @int19h already mentioned we do not know in advance how long the session will last, and thus we show the toolbar.
After compiling all the feedback and great ideas I suggest we start with @weinand initial proposal.
Two actions in the editor title area as the Mock Debug does today. If we get feedback that it produces clutter or that users want to customise this further we can change our recommended design.
Action items:
- [x] Introduce
rungroup @isidorn - [ ] Introduce
$(debug-alt-small)codicon which has a good size for the editor title area @misolori - [ ] Communicate to all debug extensions what is our recommendation @weinand @isidorn
- [x] Write a test plan item @isidorn @weinand
Let me know if this makes sense.
isidorn
on 25 Jun 2020
@int19h wrote:
The toolbar is useful for long-running code even without breakpoints in the picture, since it provides the means to pause or stop the process. And a real adapter wouldn't know in advance if the code is long-running or not.
but previously wrote:
To clarify, we do support "noDebug" in debugpy, and we specifically do this by not touching the debuggee at all - in that mode, launch.json controls what gets spawned and how, but that's that.
When in long-running Python code launched this way, what does the debug toolbar's 'pause' button do? Suspend execution, show the current line, and allow setting of breakpoints? Or merely pause the process until I press either 'play', 'stop', or 'restart'? Or something different?
gjsjohnmurray
on 25 Jun 2020
@isidorn I will communicate the guidelines in the release notes.
I don't think that there is a need for a test plan item since the only new functionality is the "run" group which I will verify together with the improved icons with Mock debug. So I suggest we add the "verification-needed" label.
weinand
on 25 Jun 2020
@gjsjohnmurray the debug toolbar's behavior is controlled by the debug extension/debug adapter.
Possible strategies:
- the debug adapter exits as soon as the program is launched. In this case the debug toolbar will only appear for a brief moment. @isidorn for this case it would be great if the debug toolbar would only show up after a short delay.
- If the debug adapter waits until the program exits, the debug toolbar will be there while the program is running. Typically the debug adapter will only implement the "stop" functionality, so the program, can be terminated by pressing the "Stop" button.
weinand
on 25 Jun 2020
@weinand thanks for your input. It looks like Mock implements the second strategy. Perhaps add a compile time flag (cf its existing 'runMode' flag) to give us an example of a DA that implements the first.
And to help with understanding/testing of the differences, how about making its fireEventsForLine method interpret 'wait(2000)' as an instruction to simulate a long-running command (in this case 2000ms)? Doing this before the noDebug test will mean we can see how the debug toolbar's controls behave even when launching from the Run button.
gjsjohnmurray
on 25 Jun 2020
@gjsjohnmurray For Python, it would do nothing - in fact, I believe we respond to that message with an error response. But there are many other debug adapters :) Besides, there's still Stop, which is always applicable.
@weinand Speaking of which - perhaps Pause should be surfaced as a capability, so that it can be disabled/hidden entirely, rather than relying on error responses for this? I suspect that most debug adapters wouldn't be able provide it in "noDebug" mode, so it should be a fairly common case.
+1 on only showing the toolbar after a short delay. This would cover the common case of a simple script nicely without regressing UX elsewhere; our users should like that.
int19h
on 25 Jun 2020
@weinand makes sense for the verifcation needed and release notes
@gjsjohnmurray @int19h can you please create a new issue to show the toolbar after a short delay, since this is not directly related to the single file debug discussion. Thanks!
isidorn
on 25 Jun 2020
@gjsjohnmurray @int19h can you please create a new issue to show the toolbar after a short delay, since this is not directly related to the single file debug discussion. Thanks!
101018
gjsjohnmurray
on 25 Jun 2020
I have introduced the run group to the Editor Title area as we agreed upon, the run group is left of the navigation group.
I have also adopted this in Mock Debug via this commit. I have used the order 10 and 20 to give the group more flexibility if other extensions want to introduce actions between these.
I will update the docs here https://code.visualstudio.com/api/references/contribution-points#Sorting-of-groups
The open question is should the group be called 0_run which is a bit ugly. Will check with Ben.
I have created this follow up item for @misolori https://github.com/microsoft/vscode/issues/101026
@weinand and me can work on finalising on what is the exact recommnedation for extensions and post it here and in the release notes.
isidorn
on 25 Jun 2020
After discussion we decided to go with the group name 1_run to be better aligned with the current group names.
I have updated our docs to reflect the new group name.
To recap @weinand and me came up with the following recommendations for debug extensions (we will also cover this in our release notes):
1) Use the $(play) icon for Run, $(debug-alt-small) for debug
2) Put actions in the 1_run group, use order 10 and 20.
3) Use title "Run File" and "Debug File" or "Run Python File" and "Debug Python File"
4) Put either one or two actions based on your use case
5) Try to not to put other debug actions, if those are needed please let us know so we think about having a consistent experience
Mock debug example can be found here
fyi @connor4312 since we could also do this in js-debug
To verify: clone the mock debug repo from here, run the extension and make sure the commands are properly contributed for every markdown file in the editor title area.
isidorn
on 26 Jun 2020
Verified that the proposal works and looks fine.
The icons are not yet aligned, but I commented here: https://github.com/microsoft/vscode/issues/101026#issuecomment-652342966
weinand
on 1 Jul 2020
After discussion we decided to go with the group name
1_runto be better aligned with the current group names.
I have updated our docs to reflect the new group name.To recap @weinand and me came up with the following recommendations for debug extensions (we will also cover this in our release notes):
- Use the
$(play)icon for Run,$(debug-alt-small)for debug- Put actions in the
1_rungroup, use order10and20.- Use title "Run File" and "Debug File" or "Run Python File" and "Debug Python File"
- Put either one or two actions based on your use case
- Try to not to put other debug actions, if those are needed please let us know so we think about having a consistent experience
Mock debug example can be found here
fyi @connor4312 since we could also do this in js-debug
To verify: clone the mock debug repo from here, run the extension and make sure the commands are properly contributed for every markdown file in the editor title area.
@testforstephen please take a look at the recommendations and see how Java debugger can benefit.
akaroml
on 6 Jul 2020
@akaroml sure, tracked with issue https://github.com/microsoft/vscode-java-debug/issues/834
testforstephen
on 6 Jul 2020
@isidorn
As for the $(play) and $(debug-alt) we simply need to resize them so they are the same size and aligned. Looking at them the problem is the debug-alt which is not designed to be used in a horisontal action bar. We should resize it, and if that is not possible (activity bar might get broken) then we simply need to introduce a new codicon. @misolori is it possible that you look into this?
Is this being tracked anywhere? It definitely looks a bit weird right now with different sizes.
 DanTup
on 28 Jul 2020
DanTup
on 28 Jul 2020
@DanTup yes, here https://github.com/microsoft/vscode/issues/101026
isidorn
on 28 Jul 2020
@isidorn aha, perfect - already shipped! :) I copied the original name (from https://github.com/microsoft/vscode/issues/92269#issuecomment-648830896) so if that's the main source for this info, might be worth editing in there (I did check the release notes, but it didn't seem to include the specifics).
Thanks!
DanTup
on 28 Jul 2020
Makes sense, I have updated my comments from above. Thanks for pointing this out.
isidorn
on 28 Jul 2020
Related issues
 shanalikhan
·
3Comments
shanalikhan
·
3Comments
 trstringer
·
3Comments
trstringer
·
3Comments
 curtw
·
3Comments
curtw
·
3Comments
 vsccarl
·
3Comments
vsccarl
·
3Comments
 sirius1024
·
3Comments
sirius1024
·
3Comments
Most helpful comment
After reading the comments from above again, I came to the conclusion that we do not need any additional architecture or API in order to "improve the single file debug experience".
We just need guidelines to ensure that the "single file debug experience" is identical across different debuggers.
Here is a proposal for the "single file debug experience" guidelines:
VS Code debug extensions that support debugging of single files without any setup should follow these guidelines:
$(play)and$(bug)icons to have the menu actions showing up as buttons with the correct icons.vscode.startDebuggingAPI.activationEventssection of the package.json.I've implemented this proposal in Mock Debug:
Here are the resulting declarations from the
package.json:And here is the implementation in
extension.ts:The only missing piece of these guidelines is the "debug" group for the "editor/title" contribution. This group should make sure that the "run" and "debug" buttons appear at the left most position.
@isidorn @testforstephen @akaroml what do you think?