Vscode: Constant CPU spikes from Code Help
Issue Type: Bug
Working on my react application after a restart eventually code help will cause my CPU to spike and not show any options, just loading...
Tried removing all extensions, reinstalling 100% and updating ts and updating settings.json to "typescript.tsdk": "C:/Users/jason/AppData/Roaming/npm/node_modules/typescript/lib"
Help this is really forcing me to use another product as it is killing my productivity.
VS Code version: Code 1.41.1 (26076a4de974ead31f97692a0d32f90d735645c0, 2019-12-18T14:58:56.166Z)
OS version: Windows_NT x64 10.0.17763
System Info
|Item|Value|
|---|---|
|CPUs|Intel(R) Core(TM) i7-8750H CPU @ 2.20GHz (12 x 2208)|
|GPU Status|2d_canvas: enabled
flash_3d: enabled
flash_stage3d: enabled
flash_stage3d_baseline: enabled
gpu_compositing: enabled
metal: disabled_off
multiple_raster_threads: enabled_on
oop_rasterization: disabled_off
protected_video_decode: enabled
rasterization: enabled
skia_renderer: disabled_off
surface_control: disabled_off
surface_synchronization: enabled_on
video_decode: enabled
viz_display_compositor: enabled_on
viz_hit_test_surface_layer: disabled_off
webgl: enabled
webgl2: enabled|
|Load (avg)|undefined|
|Memory (System)|15.86GB (4.92GB free)|
|Process Argv||
|Screen Reader|no|
|VM|0%|
Extensions (15)
Extension|Author (truncated)|Version
---|---|---
better-comments|aar|2.0.5
htmltagwrap|bra|0.0.7
npm-intellisense|chr|1.3.0
path-intellisense|chr|1.4.2
bracket-pair-colorizer-2|Coe|0.0.29
vscode-eslint|dba|2.0.14
es7-react-js-snippets|dsz|2.5.0
vscode-npm-script|eg2|0.3.10
prettier-vscode|esb|3.18.0
file-icons|fil|1.0.21
auto-close-tag|for|0.5.6
auto-rename-tag|for|0.1.1
vscode-colorize|kam|0.8.15
material-icon-theme|PKi|3.9.2
code-spell-checker|str|1.7.20
(2 theme extensions excluded)
 BustaFett
All 31 comments
Does this reproduce in the latest VS Code insiders build with all extensions disabled?
 mjbvz
on 16 Jan 2020
mjbvz
on 16 Jan 2020
Installed and ran with no extensions and experienced the same issue.
BustaFett
on 16 Jan 2020
Is there a specific version of TypeScript I should be using with this version of VSCode? I am having to use another editor and I really would like to swap back to VSCode.
BustaFett
on 16 Jan 2020
Can you please follow these instructions to collect the cpu performance information. Please just share the output of code-insiders --status
mjbvz
on 16 Jan 2020
Version:          Code - Insiders 1.42.0-insider (235695393db763af632fab376b890d63d8a48576, 2020-01-16T18:51:39.093Z)
OS Version:       Windows_NT x64 10.0.17763
CPUs:             Intel(R) Core(TM) i7-8750H CPU @ 2.20GHz (12 x 2208)
Memory (System):  15.86GB (4.00GB free)
VM:               0%
Screen Reader:    no
Process Argv:
GPU Status:       2d_canvas:                     enabled
                  flash_3d:                      enabled
                  flash_stage3d:                 enabled
                  flash_stage3d_baseline:        enabled
                  gpu_compositing:               enabled
                  multiple_raster_threads:       enabled_on
                  oop_rasterization:             disabled_off
                  protected_video_decode:        enabled
                  rasterization:                 enabled
                  skia_renderer:                 disabled_off_ok
                  video_decode:                  enabled
                  viz_display_compositor:        enabled_on
                  viz_hit_test_surface_layer:    disabled_off_ok
                  webgl:                         enabled
                  webgl2:                        enabled

CPU %   Mem MB     PID  Process
    0       74    7276  code-insiders main
    0       25    5100     utility
    0      215    8448     window (ΓùÅ Checkin.js - orthotom-mds - Visual Studio Code - Insiders)
    0       11   24400       watcherService
    0       11   42560         console-window-host (Windows internal process)
    0       67   45800       extensionHost
    9      399   24648         electron_node tsserver.js
    0       45   30640           electron_node typingsInstaller.js typesMap.js
    0       53   44276         electron_node tsserver.js
    0       13    9740     electron-crash-reporter
    0      161   34980     gpu-process
    0       70   42312     shared-process
    0        8   43168     C:\Users\jason\AppData\Local\Temp\vscode-update-user-x64\CodeSetup-insider-b600d39061b60ed50f6df14dd405227c7618b7b7.exe /verysilent /update="C:\Users\jason\AppData\Local\Temp\vscode-update-user-x64\CodeSetup-insider-b600d39061b60ed50f6df14dd405227c7618b7b7.flag" /nocloseapplications /mergetasks=runcode,!desktopicon,!quicklaunchicon
    0       36   17108       "C:\Users\jason\AppData\Local\Temp\is-F1GQD.tmp\CodeSetup-insider-b600d39061b60ed50f6df14dd405227c7618b7b7.tmp" /SL5="$2E10EA,57894680,168448,C:\Users\jason\AppData\Local\Temp\vscode-update-user-x64\CodeSetup-insider-b600d39061b60ed50f6df14dd405227c7618b7b7.exe" /verysilent /update="C:\Users\jason\AppData\Local\Temp\vscode-update-user-x64\CodeSetup-insider-b600d39061b60ed50f6df14dd405227c7618b7b7.flag" /nocloseapplications /mergetasks=runcode,!desktopicon,!quicklaunchicon

Workspace Stats:
|  Window (ΓùÅ Checkin.js - orthotom-mds - Visual Studio Code - Insiders)
|    Folder (orthotom-mds): 1373 files
|      File types: scss(668) js(403) json(21) png(14) css(7) html(3) gif(2)
|                  gitignore(1) md(1) ico(1)
|      Conf files: package.json(3) launch.json(1) settings.json(1)
|      Launch Configs: node
Where did you see the cpu spikes? From that code --status, I see 9% cpu usage which would be expect in many cases. If you do nothing in the editor, does the cpu usage eventually stop?
mjbvz
on 17 Jan 2020
It causes my fans on my laptop to start running and none of the code helpers work until I restart VS Code. The performance monitor for CPU in Windows goes to 20%+.
BustaFett
on 17 Jan 2020
Any updates here? I am having to use Atom instead of VS Code and I am not liking it as much. Can there be an issue with the version of the TS Server as that seems to be the problem child in all of this as it relates to CPU and the code helpers not working.
BustaFett
on 23 Jan 2020
Do you see this in all projects you open, or just one in particular?
mjbvz
on 24 Jan 2020
Experiencing the same issue on macOS Catalina 10.15.2, Visual Studio build 1.41.1. 100% CPU usage at all time, Mac fans at full speed.
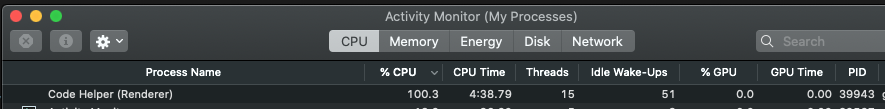
 George-BC
on 24 Jan 2020
George-BC
on 24 Jan 2020
I see this for all projects. All of those are react projects. Again the issue starts up as soon as I start using code helpers.
BustaFett
on 24 Jan 2020
@BustaFett When do you see the spikes? Can you share an example project that causes this?
@George-BC Please open a separate issue (and also test on VS Code insiders)
mjbvz
on 24 Jan 2020
I only have proprietary work and cannot share it. The spikes occur when I try to use code helpers.
BustaFett
on 24 Jan 2020
Some sort of spike is expected (such as the 9% one from the code --status you shared). VS Code has to compute which suggestions to return and update the errors in your project if you change the file
Does the CPU usage die down if you stop changing the file or doing anything in the editor?
mjbvz
on 24 Jan 2020
I have encountered the same issue with all extensions disabled. After a few minutes after i have opened VS Code, the CPU usage will spike up to 20%-30%, at which point the intellisense stops working. This issue first started a month ago.

 radufilipescu
on 28 Jan 2020
radufilipescu
on 28 Jan 2020
No the "Very high" usage persists and the code helper tools never return unless I restart VS Code or terminate/restart the TS Server service were the spike is showing.
BustaFett
on 28 Jan 2020
Same issue here with macbook pro 2019, specially when you work with source Control, it's kind of trigger the codehelper and get it to 100% cpu usage and the fans get crazy.
for now i fix it buy quite VSCODE and open it again, till it get crazy again after i get back to source control.
 Samk13
on 7 Feb 2020
Samk13
on 7 Feb 2020
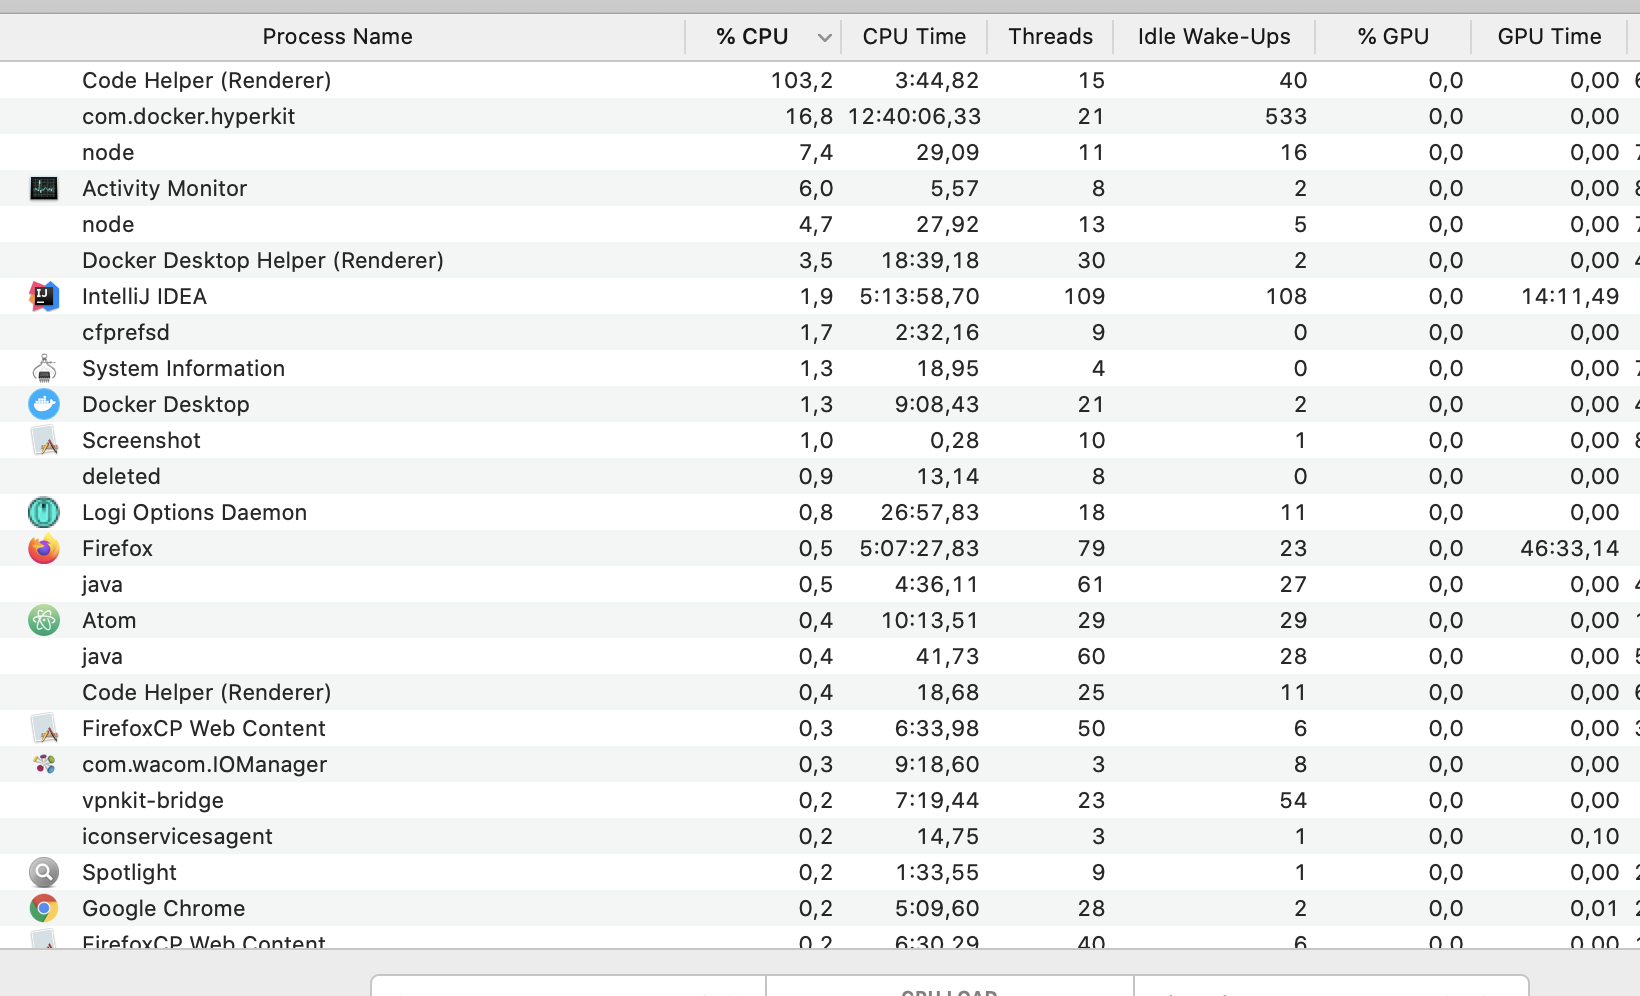
I also have this on Mac. It's a React application with Typescript (not a very big one). The Macbook Pro is a 16 inch 2019. Visual Studio Code runs without extensions. As I work for a while, suddenly Code Helper spins up to over 100%. If I do nothing, It'll continue (for at least 30 minutes, I never waited any longer). When I kill the Code Helper process in Activity Monitor I can continue for another 30 minutes or so and then it happens again. If I keep Visual Studio Code in the background - because I switch to IntelliJ, everything goes fine. But as soon as I start to code in Visual Studio Code again, it's waiting for it to happen.
I excluded the node modules folder. That helps, but now switching between projects doesn't make it much beter.
Edit: Now I'll have to admit that after approx. 20 minutes, it stopped being busy by itself.
 wanjakrah
on 12 Mar 2020
wanjakrah
on 12 Mar 2020
I also have the same problem with vscode. Macbook pro fan runs in full speed just after opening VSCode. I tried reinstalling but no luck.
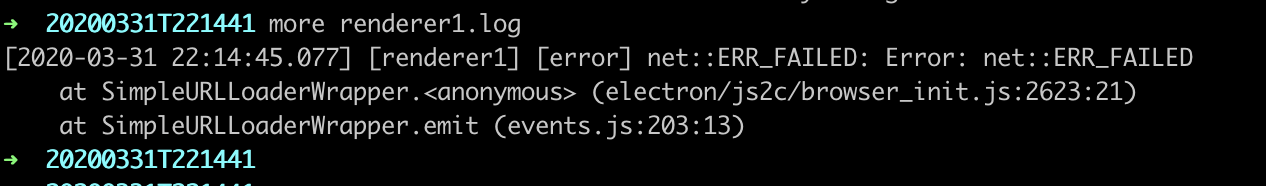
Version: 1.43.2
Commit: 0ba0ca52957102ca3527cf479571617f0de6ed50
Date: 2020-03-24T07:34:57.037Z
Electron: 7.1.11
Chrome: 78.0.3904.130
Node.js: 12.8.1
V8: 7.8.279.23-electron.0
OS: Darwin x64 19.4.0
I left it to run about 25 minutes with high CPU and it simply crashed. I could find the below error on renderer1.log.
 jayanath
on 31 Mar 2020
jayanath
on 31 Mar 2020
I'm going nuts with this, it's almost unusable at this point. I'd be willing to share the project @mjbvz
Same issue as lots of people here on the MPB 16
 sitefinitysteve
on 11 Apr 2020
sitefinitysteve
on 11 Apr 2020
If you are not @BustaFett, Please follow these instructions to collect performance information and open a new issue. Be sure to include the output of code --status
mjbvz
on 14 Apr 2020
Ok, it's just frustrating that this issue is open multiple times and goes nowhere on any thread, feel like we're just multiplying issues. But if that's the process, no worries.
sitefinitysteve
on 15 Apr 2020
Thanks. It makes it much easier to track. High cpu usage is super generic problem so the root cause of the problem you see very likely is completely different from the op's
mjbvz
on 15 Apr 2020
@mjbvz Since hundreds of issues get opened with the same symptom but different causes, perhaps address the symptom until all possible causes are addressed? Perhaps monitor your own processes and if any process spikes CPU usage at or above 100% for more than 5 seconds, throttle it to 30% or something?
 dwighthouse
on 21 Apr 2020
dwighthouse
on 21 Apr 2020
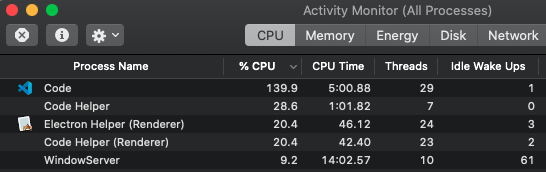
I don't think its always related to extensions, it has just happened to me about 20 mins after installing and launching VSCode on a new MBP 16 inch, it was just sat there at the settings page, had not even been used yet, nothing open, no extensions added, nothing, i just came back to notice the fans at full speed and the usual suspect (Code Helper) maxing out the CPU along with electron helper.
Having been plagued by this issue in the past in multiple versions of OSX and multiple versions of VSCode, i hoped it was just one of the many extensions that was the issue and so was planning to add them gradually as required.
 chrisckc
on 21 Apr 2020
chrisckc
on 21 Apr 2020
Are you guys ever going to fix this? It is super annoying to not have code helpers work at all.
BustaFett
on 2 Jun 2020
This disappeared for a while, but has returned since the latest update.
Version:          Code 1.46.0 (a5d1cc28bb5da32ec67e86cc50f84c67cc690321, 2020-06-10T08:59:06.977Z)
OS Version:       Darwin x64 19.5.0
CPUs:             Intel(R) Core(TM) i7-8559U CPU @ 2.70GHz (8 x 2700)
Memory (System):  16.00GB (0.11GB free)
Load (avg):       3, 7, 8
VM:               0%
Screen Reader:    no
Process Argv:     .
GPU Status:       2d_canvas:                     enabled
                  flash_3d:                      enabled
                  flash_stage3d:                 enabled
                  flash_stage3d_baseline:        enabled
                  gpu_compositing:               enabled
                  metal:                         disabled_off
                  multiple_raster_threads:       enabled_on
                  oop_rasterization:             disabled_off
                  protected_video_decode:        unavailable_off
                  rasterization:                 enabled
                  skia_renderer:                 disabled_off_ok
                  video_decode:                  enabled
                  viz_display_compositor:        enabled_on
                  viz_hit_test_surface_layer:    disabled_off_ok
                  webgl:                         enabled
                  webgl2:                        enabled

CPU %   Mem MB     PID  Process
    0       98   10581  code main
    0       49   10646     gpu-process
    0       16   10692     utility
    0      311   10693     window (● App/components/forms/DiscussionForm/DiscussionForm.js — purple-rain)
    0      279   10716       extensionHost
    0       66   10776         electron_node eslintServer.js
    0       33   10777         electron_node serverMain.js
    0       49   10804         electron_node server.js
    0       66   10806         extensionHost
    0       66   10807         extensionHost
    0       49   10835         node /Path/To/Project/.bin/jest --testLocationInResults --json --useStderr --outputFile /var/folders/39/yy6xybhs5634rv0qhnwqqvcm0000gn/T/jest_runner_purple_rain.json --watch --no-coverage --no-color --reporters default --reporters /Users/alexmccabe/.vscode/extensions/orta.vscode-jest-3.2.0/out/reporter.js
    0       66   10864         extensionHost
    0       33   10977         /Applications/Visual Studio Code.app/Contents/Frameworks/Code Helper (Renderer).app/Contents/MacOS/Code Helper (Renderer) /Applications/Visual Studio Code.app/Contents/Resources/app/extensions/json-language-features/server/dist/jsonServerMain --node-ipc --clientProcessId=10716
    0       82   13288         electron_node tsserver.js
   92      328   13289         electron_node tsserver.js
    0       66   13292           electron_node typingsInstaller.js typesMap.js
    0       33   10718       watcherService
    0       33   10751       searchService
    0       66   10741     shared-process
    0        0   13762       /bin/ps -ax -o pid=,ppid=,pcpu=,pmem=,command=
    0       82   12918     window (Process Explorer)
    0        0   13760     (ps)

Workspace Stats:
|  Window (● App/components/forms/DiscussionForm/DiscussionForm.js — purple-rain)
|    Folder (purple-rain): more than 20287 files
|      File types: hpp(11460) h(1850) flat(847) dex(699) class(630) xml(248)
|                  js(231) m(211) json(186) ipp(171)
|      Conf files: settings.json(1) jsconfig.json(1) package.json(1)
Basically unusable
 alexmccabe
on 16 Jun 2020
alexmccabe
on 16 Jun 2020
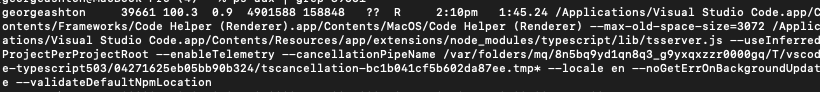
This is happening for me pretty consistently. it's showing that electron_node tsserver.js spikes to 100% in the process explorer. it happens immediately when i hit enter to go to a newline. It comes back down after about 10 seconds. It seems to be related to key strokes for me, which makes the editor unusable pretty quickly. This is in a ts, tsx, js file etc.
 rufus2021
on 25 Jun 2020
rufus2021
on 25 Jun 2020
I have the same issue.
electron_node tsserver.js spikes to > 100% for some reason. and the fan goes crazy.
Version:          Code 1.48.2 (a0479759d6e9ea56afa657e454193f72aef85bd0, 2020-08-25T10:09:08.021Z)
OS Version:       Darwin x64 19.6.0
CPUs:             Intel(R) Core(TM) i7-9750H CPU @ 2.60GHz (12 x 2600)
Memory (System):  16.00GB (0.35GB free)
Load (avg):       1, 2, 2
VM:               0%
Screen Reader:    no
Process Argv:     -psn_0_57358
GPU Status:       2d_canvas:                     enabled
                  flash_3d:                      enabled
                  flash_stage3d:                 enabled
                  flash_stage3d_baseline:        enabled
                  gpu_compositing:               enabled
                  metal:                         disabled_off
                  multiple_raster_threads:       enabled_on
                  oop_rasterization:             disabled_off
                  protected_video_decode:        unavailable_off
                  rasterization:                 enabled
                  skia_renderer:                 disabled_off_ok
                  video_decode:                  enabled
                  viz_display_compositor:        enabled_on
                  viz_hit_test_surface_layer:    disabled_off_ok
                  webgl:                         enabled
                  webgl2:                        enabled

CPU %   Mem MB     PID  Process
    0      115     337  code main
    1       82    2358     gpu-process
    0       33    2360     utility
    0      180    2764     shared-process
    0        0   13239       /bin/ps -ax -o pid=,ppid=,pcpu=,pmem=,command=
    0      311    3072     window (types.ts — some-project-api)
    0      279    3073       extensionHost
    0       33    3085         electron_node serverMain.js
    0       66    3090         electron_node server.js
    0       49    3336         /Applications/Visual Studio Code.app/Contents/Frameworks/Code Helper (Renderer).app/Contents/MacOS/Code Helper (Renderer) /Applications/Visual Studio Code.app/Contents/Resources/app/extensions/json-language-features/server/dist/node/jsonServerMain --node-ipc --clientProcessId=3073
    0       82    6183         electron_node tsserver.js
    0      164    6184         electron_node tsserver.js
    0       66    6190           electron_node typingsInstaller.js typesMap.js
    0       49    6188         electron_node eslintServer.js
    0       66    3074       watcherService
    0        0    3120       /bin/zsh -l
    0       33   11385         npm
    0       33   11386           node /Users/novym/repos/test-project/some-project-api/node_modules/.bin/nodemon server/index.ts
    0      180   11388             node /Users/novym/repos/test-project/some-project-api/node_modules/.bin/ts-node server/index.ts
    3      377    3443     window (package.json — some-project-web)
    0      311    3449       extensionHost
    0       33    3472         electron_node serverMain.js
    0       82    3475         electron_node server.js
    0      115    6151         electron_node eslintServer.js
    0       82    6153         electron_node tsserver.js
  101      410    6154         electron_node tsserver.js
    0       66    6157           electron_node typingsInstaller.js typesMap.js
    0       49    6159         /Applications/Visual Studio Code.app/Contents/Frameworks/Code Helper (Renderer).app/Contents/MacOS/Code Helper (Renderer) /Applications/Visual Studio Code.app/Contents/Resources/app/extensions/json-language-features/server/dist/node/jsonServerMain --node-ipc --clientProcessId=3449
    0       82    3450       watcherService
    0       33    3465       searchService
    0        0    3662       /bin/zsh -l
    0       49   11812         node /usr/local/Cellar/yarn/1.22.5/libexec/bin/yarn.js start
    0       16   11816           /Users/novym/.nvm/versions/node/v14.7.0/bin/node /Users/novym/repos/test-project/some-project-web/node_modules/.bin/react-scripts start
    0      344   11819             /Users/novym/.nvm/versions/node/v14.7.0/bin/node /Users/novym/repos/test-project/some-project-web/node_modules/react-scripts/scripts/start.js
    2      180   11843               /Users/novym/.nvm/versions/node/v14.7.0/bin/node --max-old-space-size=2048 /Users/novym/repos/test-project/some-project-web/node_modules/fork-ts-checker-webpack-plugin/lib/service.js
    0        0   12804       /bin/zsh -l
    0        0   13224         bash /usr/local/bin/code --status
   13       33   13234           electron_node cli.js

Workspace Stats:
|  Window (package.json — some-project-web)
|  Window (types.ts — some-project-api)
|    Folder (some-project-api): 22 files
|      File types: ts(8) json(3) env(1) gitignore(1)
|      Conf files: package.json(1) tsconfig.json(1)
|    Folder (some-project-web): 44 files
|      File types: ts(13) json(4) png(4) tsx(3) css(2) gitignore(1) ico(1)
|                  html(1) txt(1) jpg(1)
|      Conf files: package.json(1) tsconfig.json(1)
 novym
on 27 Aug 2020
novym
on 27 Aug 2020
come back again 😪, Had the same issue 6 month ago, it's been unpleasant experience until next release, the trigger was doing a commit or generally using git commands within vscode from source control panel. then the CPU start crying.
Samk13
on 28 Aug 2020
Locking to make it clear that if you see performance issues, open a new issue.
CPU usage is a super generic symptom with many possible root causes. We need to investigate each case on its own and will then mark it as a duplicate if needed.
mjbvz
on 28 Aug 2020
Related issues
 v-pavanp
·
3Comments
v-pavanp
·
3Comments
 mrkiley
·
3Comments
mrkiley
·
3Comments
 biij5698
·
3Comments
biij5698
·
3Comments
 sijad
·
3Comments
sijad
·
3Comments
 sirius1024
·
3Comments
sirius1024
·
3Comments
Most helpful comment
This is happening for me pretty consistently. it's showing that
electron_node tsserver.jsspikes to 100% in the process explorer. it happens immediately when i hit enter to go to a newline. It comes back down after about 10 seconds. It seems to be related to key strokes for me, which makes the editor unusable pretty quickly. This is in ats, tsx, jsfile etc.