Vscode: VSCode’s renderer helper process using 100% of CPU when saving a file
Issue Type: Bug
First of all I’m using VSCode on a new 16" Macbook Pro without any extensions installed. The issue happens for me using the following steps:
- Open a project.
- Open JavaScript or MD (markdown) file from the project.
- Hit save.
- Watch CPU usage go up to 200% first for Node, then after that “Code Helper (renderer)” will immediately use 100% of CPU for a period of about half a minute.
- Wait for the CPU usage to stop and without doing any changes, hit Cmd+S again on the same file. Same thing is always repeated.
This issue has literally made VSCode completely unusable on my new machine. If it helps, I have Node.js v12.13.1 installed on this laptop. This issue did not exist for me in the previous 15" laptop so wondering if there’s some incompatibility with the new hardware like the GPU or if that’s even possible.
VS Code version: Code 1.41.1 (26076a4de974ead31f97692a0d32f90d735645c0, 2019-12-18T14:57:51.166Z)
OS version: Darwin x64 19.2.0
System Info
|Item|Value|
|---|---|
|CPUs|Intel(R) Core(TM) i9-9980HK CPU @ 2.40GHz (16 x 2400)|
|GPU Status|2d_canvas: enabled
flash_3d: enabled
flash_stage3d: enabled
flash_stage3d_baseline: enabled
gpu_compositing: enabled
metal: disabled_off
multiple_raster_threads: enabled_on
oop_rasterization: disabled_off
protected_video_decode: unavailable_off
rasterization: enabled
skia_renderer: disabled_off
surface_control: disabled_off
surface_synchronization: enabled_on
video_decode: enabled
viz_display_compositor: enabled_on
viz_hit_test_surface_layer: disabled_off
webgl: enabled
webgl2: enabled|
|Load (avg)|3, 2, 2|
|Memory (System)|64.00GB (39.86GB free)|
|Process Argv|.|
|Screen Reader|no|
|VM|0%|
Extensions: none
Saved a file:

After roughly half a minute:

Saving again without doing any changes. First node usage goes up:

Then VSCode process is again taking 100% of CPU for roughly half a minute:

 viljamis
All 19 comments
Updated the description. Seems to happen for any file type.
viljamis
on 21 Dec 2019
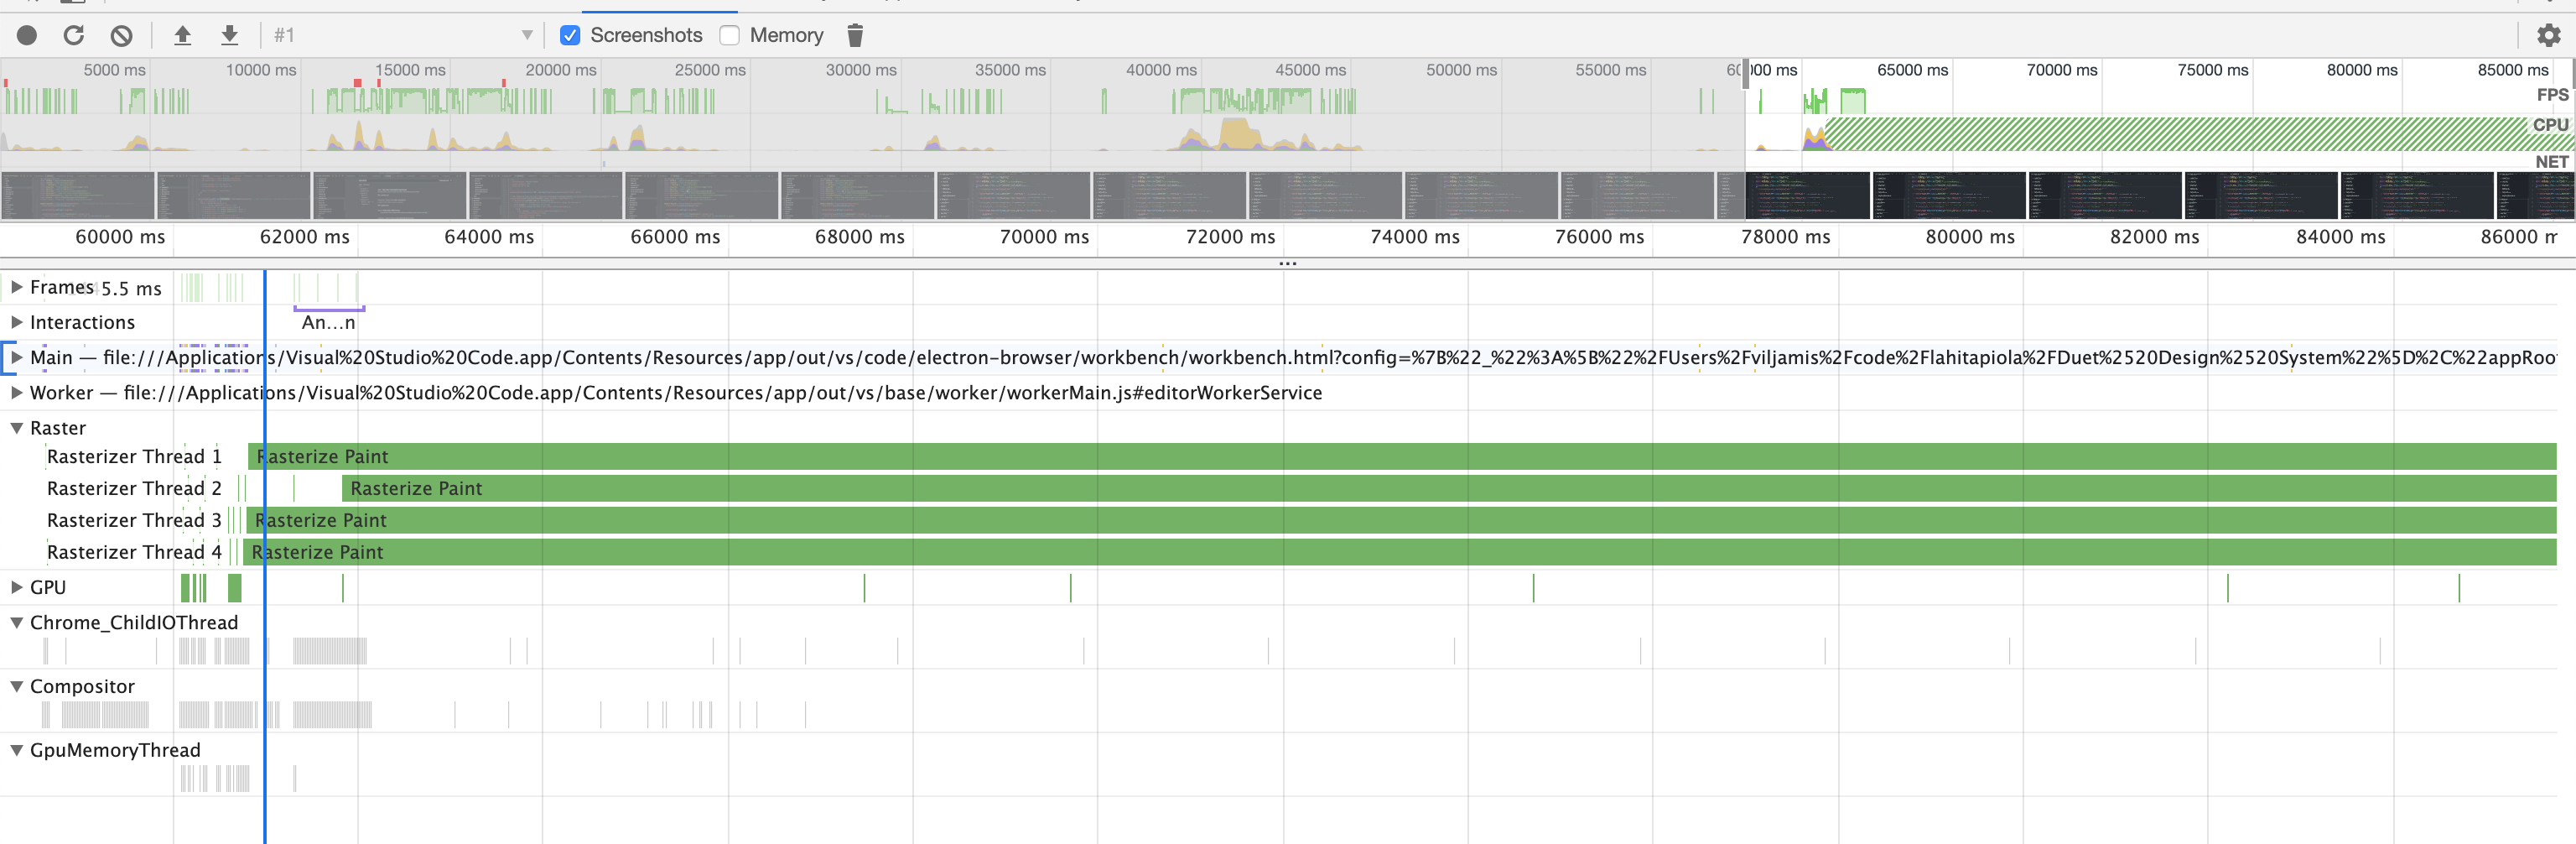
Looking at the performance tab of dev tools shows 4 Rasterizer Threads processing for ~25 seconds when you save a file which I believe is associated with this high CPU usage:
viljamis
on 21 Dec 2019
After some further debugging, seems like the whole issue is somehow related to typescript:

Looks like this is related: https://github.com/Microsoft/TypeScript/issues/31248
viljamis
on 21 Dec 2019
Solved for now by disabling the "TypeScript and JavaScript Language Features" built-in extension. While might lose some features, at least this makes VS Code usable again.
viljamis
on 21 Dec 2019
I've been having this same issue for well over a year. It was happening on an older MacBook Pro. Now I have the new 16" and it still happens. Fans spin like crazy! I'll try disabling TypeScript.
 mvolkmann
on 23 Dec 2019
mvolkmann
on 23 Dec 2019
I disabled the "TypeScript and JavaScript Language Features" built-in extension and restarted VS Code, but I still have a "Code Helper (Renderer)" process using a lot of CPU. This seems to be a problem that just won't go away.
mvolkmann
on 27 Dec 2019
@mvolkmann Maybe the root cause is something else in your case? My VSCode has been fine ever since I disabled that, although I guess this shouldn’t really be the long term fix for this. :-)
viljamis
on 4 Jan 2020
@mvolkmann I suggest you open a separate issue on that with more information, e.g. what process is consuming lots of performance for you.
 bpasero
on 4 Jan 2020
bpasero
on 4 Jan 2020
I already did that quite a while ago. See https://github.com/microsoft/vscode/issues/74755. The last suggestion I saw was that I should report an issue against the "VSCode Helper" extension. I didn't know that was considered an extension. I can't find a GitHub page for that.
mvolkmann
on 4 Jan 2020
@mvolkmann didn't that lead to https://github.com/microsoft/vscode/issues/74960 where you figured out it was caused by an extension? Does it reproduce when you run without extensions?
bpasero
on 4 Jan 2020
I wasn't able to narrow it to an extension. I believe I can reproduce this
with no extensions. There doesn't seem to be a pattern for when it happens.
I can be working in VS Code for hours with no issues and then out of the
blue the fans in my new MacBook Pro 16" start spinning like crazy. I check
the Activity Monitor and see that once again I have multiple "Code Helper
(Render)" processes using large percentages of CPU. I wish I could narrow
it down. I wonder if this issue only happens on Macs.
On Sat, Jan 4, 2020 at 10:27 AM Benjamin Pasero notifications@github.com
wrote:
@mvolkmann https://github.com/mvolkmann didn't that lead to #74960
https://github.com/microsoft/vscode/issues/74960 where you figured out
it was caused by an extension? Does it reproduce when you run without
extensions?—
You are receiving this because you were mentioned.
Reply to this email directly, view it on GitHub
https://github.com/microsoft/vscode/issues/87509?email_source=notifications&email_token=AAATLUF7E5IIOBJWLY6RZZDQ4C2GZA5CNFSM4J6F6DW2YY3PNVWWK3TUL52HS4DFVREXG43VMVBW63LNMVXHJKTDN5WW2ZLOORPWSZGOEIC3FHY#issuecomment-570798751,
or unsubscribe
https://github.com/notifications/unsubscribe-auth/AAATLUGIRIYQEYFHOVWMQD3Q4C2GZANCNFSM4J6F6DWQ
.
--
R. Mark Volkmann
Object Computing, Inc.
mvolkmann
on 4 Jan 2020
Ok, please keep us updated when you figured out a pattern for us to reproduce.
bpasero
on 5 Jan 2020
Closing as we need more info to investigate this
If you can repo this in VS Code insiders with all extensions disabled, let us know
 mjbvz
on 27 Jan 2020
mjbvz
on 27 Jan 2020
I'm having a similar issue but can't find any way to reproduce it. To make things worse, if I quit VS Code, the "Code Helper (Renderer)" continues to use > 100% CPU usage and never terminates unless I forcibly do so.
 mivade
on 29 Jan 2020
mivade
on 29 Jan 2020
This is happening to me too. Code Helper (Renderer) goes nuts and stays running even if you quit VSCode. I can reliably reproduce it by File->Open and opening my home directory on my Mac.

Every time I do it, it's a different process one time it was a a watcher:
steve 11974 224.6 6.2 5966732 1042936 ?? R 10:10PM 1:30.31 /Applications/Visual Studio Code.app/Contents/Frameworks/Code Helper (Renderer).app/Contents/MacOS/Code Helper (Renderer) /Applications/Visual Studio Code.app/Contents/Resources/app/out/bootstrap-fork --type=watcherService
one time it was one of my plugins:
steve 12254 146.2 1.0 4921388 175060 ?? R 10:12PM 2:10.16 /Applications/Visual Studio Code.app/Contents/Frameworks/Code Helper (Renderer).app/Contents/MacOS/Code Helper (Renderer) /Users/steve/.vscode/extensions/keesschollaart.vscode-home-assistant-1.5.0/out/server/server.js --node-ipc --clientProcessId=12163
But I can make it happen 100% though... could be because I have a very large home dir? ~/opt/anaconda3 is many many many files...
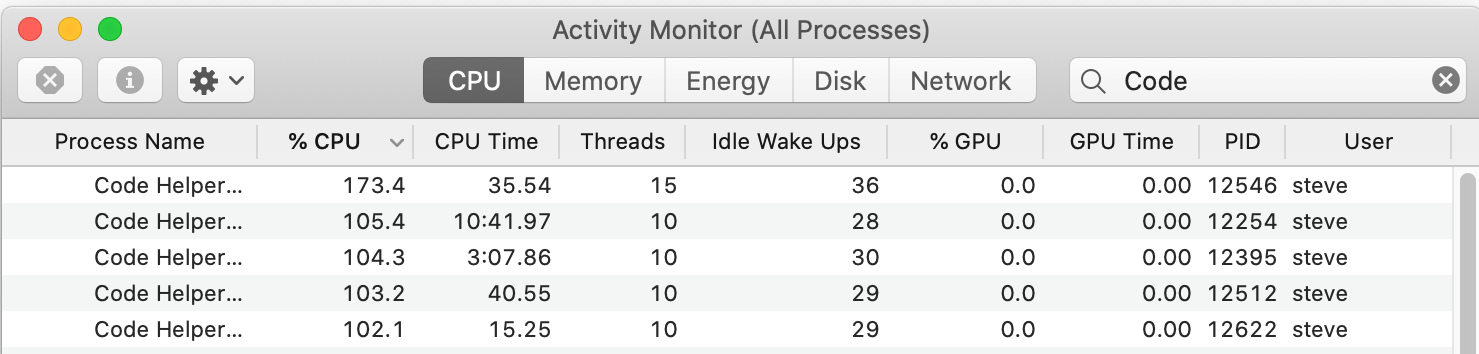
If I quit and re-launch VSCode, it leaves the old Code Helper running and starts a new one - both running 100%. I can keep it going ad infinitum:
 steve28
on 1 Feb 2020
steve28
on 1 Feb 2020
happening here as well.. looks like its the same extension causing my issues.
extensions/keesschollaart.vscode-home-assistant-1.5.0/out/server/server.js causing my problem just like the post above mine.
 ctrl50
on 21 Feb 2020
ctrl50
on 21 Feb 2020
Also seeing this happen:
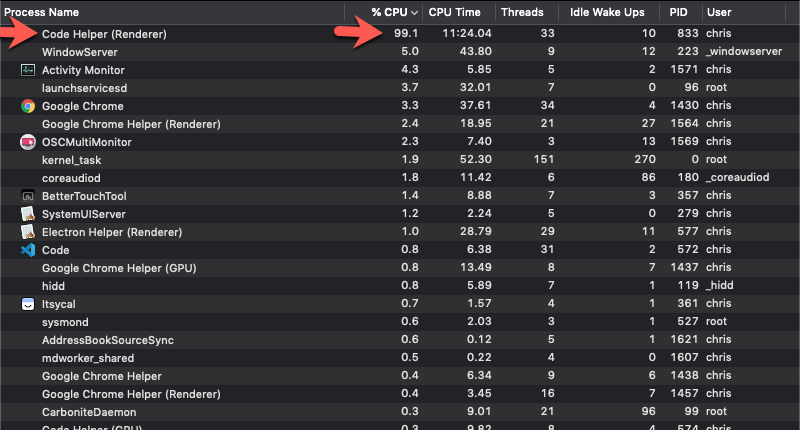
In my case, I'm running using VSCode with a React Native project and it results in the app hanging with the simulator reporting
Downloading JavaScript bundle 100% (7353/7353)
Eventually, the bundler reports, Error: not opened at WebSocket.send...
Happy to help diagnose by providing whatever other info I can. This is super annoying.
 chrischiaro
on 10 Mar 2020
chrischiaro
on 10 Mar 2020
Same Issue here please open this
 Shafran123
on 10 Mar 2020
Shafran123
on 10 Mar 2020
If you are see perf problems, please open separate issues. They are very likely have different root causes than what the OP reported
mjbvz
on 10 Mar 2020
Related issues
 shanalikhan
·
3Comments
shanalikhan
·
3Comments
 trstringer
·
3Comments
trstringer
·
3Comments
 DovydasNavickas
·
3Comments
DovydasNavickas
·
3Comments
 lukehoban
·
3Comments
lukehoban
·
3Comments
 v-pavanp
·
3Comments
v-pavanp
·
3Comments
Most helpful comment
I'm having a similar issue but can't find any way to reproduce it. To make things worse, if I quit VS Code, the "Code Helper (Renderer)" continues to use > 100% CPU usage and never terminates unless I forcibly do so.