Issue Type: Performance Issue
Closed everything but the cpu usage is still about 20%
VS Code version: Code - Insiders 1.39.0-insider (e0762af258c0b20320ed03f3871a41967acc4421, 2019-09-27T05:26:42.235Z)
OS version: Windows_NT x64 10.0.18990
System Info
|Item|Value|
|---|---|
|CPUs|Intel(R) Core(TM) i7-8750H CPU @ 2.20GHz (12 x 2208)|
|GPU Status|2d_canvas: enabled
flash_3d: enabled
flash_stage3d: enabled
flash_stage3d_baseline: enabled
gpu_compositing: enabled
metal: disabled_off
multiple_raster_threads: enabled_on
oop_rasterization: disabled_off
protected_video_decode: enabled
rasterization: enabled
skia_renderer: disabled_off
surface_control: disabled_off
surface_synchronization: enabled_on
video_decode: enabled
viz_display_compositor: enabled_on
viz_hit_test_surface_layer: disabled_off
webgl: enabled
webgl2: enabled|
|Load (avg)|undefined|
|Memory (System)|47.76GB (38.62GB free)|
|Process Argv||
|Screen Reader|no|
|VM|0%|
Process Info
CPU %   Mem MB     PID  Process
    0       91   14816  code-insiders main
    0       54    5928     electron-crash-reporter
    0      132   10228     window (Welcome - Visual Studio Code - Insiders)
    0       92   16920       extensionHost
   10       88   10280     shared-process
    0       63   11512     utility
    0      147   14452     gpu-process
    0       85   18720     window (Issue Reporter)
Workspace Info
;
Extensions: none
 sxd111
All 28 comments
(Experimental duplicate detection)
Thanks for submitting this issue. Please also check if it is already covered by an existing one, like:
![vscodebot[bot] picture](https://avatars2.githubusercontent.com/in/2406?v=4&s=40) vscodebot[bot]
on 27 Sep 2019
vscodebot[bot]
on 27 Sep 2019
Just to add that a datapoint that speaks against this being a duplicate of an old issue is that it happened for me as well after running upgrade half an hour ago.
I'm off to disable my extensions one by one to see if one of them are responsible, but so far this seems to be related to the latest update in insiders.
Update:
Disabling both Auto-Using for C# and C# seems to have helped somewhat, it now only uses half as much CPU as before. (FWIW I also disabled a couple of other extensions first, but they seemed to have now effect.)
Update 2:
I've now disabled all extensions and it still eats CPU, just half as much as before I disabled the Auto-Using for C# and C# extensions.
Update 3:
I've now cut it down to no active extensions and a completely empty folder.
It still eats CPU.
I've checked the logs and the most interesting thing I can find is this:
[2019-09-27 10:47:06.901] [sharedprocess] [info] Starting to clean up unused language packs
at the end of Log (Shared). It shows up after every restart now, but I cannot remember if it used to be there.
I'm leaving this here for now to install the normal VSCode (i.e. not insiders) for now.
 eitland
on 27 Sep 2019
eitland
on 27 Sep 2019
I'm seeing this too, right after the very same update; shared-process eats one CPU core.
VS Code version: Code - Insiders 1.39.0-insider (e0762af258c0b20320ed03f3871a41967acc4421, 2019-09-27T05:26:42.235Z)
OS version: Windows_NT x64 10.0.18362
Process Monitor reveals that VSCode is constantly doing bad I/O and failing, e.g. Code - Insiders.exe CreateFile C:\C: NAME INVALID (there's a constant pattern of commands that repeats indefinitely), perhaps the clean up code is not quite handling I/O stuff properly.
 d0ggie
on 27 Sep 2019
d0ggie
on 27 Sep 2019
Seeing the same after this very last update. 1 core pinned by the shared process, disablingc extensions doesn't meaningfully impact it.
Version: 1.39.0-insider (user setup)
Commit: e0762af258c0b20320ed03f3871a41967acc4421
Date: 2019-09-27T05:26:42.235Z
Electron: 6.0.9
Chrome: 76.0.3809.146
Node.js: 12.4.0
V8: 7.6.303.31-electron.0
OS: Windows_NT x64 10.0.18985
 GoNZooo
on 27 Sep 2019
GoNZooo
on 27 Sep 2019
Seeing similar think here. Running on a Win 10 VM, having a high CPU in Windows is causing VMWare to max out also.

CPU %   Mem MB     PID  Process
    0       79    4624  code-insiders main
    0      146     500     gpu-process
   16       74     812     shared-process
    0      159    6004     window (Program.cs - JsonParseTest - Visual Studio Code - Insiders)
    0       34     924       searchService
    0       76    6360       extensionHost
    0        4    3028         cmd /s /c ""C:\Users\John Tsombakos\.vscode-insiders\extensions\ms-vscode.csharp-1.21.3\                                                      .omnisharp\1.34.4-beta.7\OmniSharp.exe" -s "c:\Users\John Tsombakos\Desktop\JsonParseTest" --hostPID 6360 DotNet:enable                                                      PackageRestore=false --encoding utf-8 --loglevel information --plugin "C:\Users\John Tsombakos\.vscode-insiders\extensi                                                      ons\ms-vscode.csharp-1.21.3\.razor\OmniSharpPlugin\Microsoft.AspNetCore.Razor.OmniSharpPlugin.dll" FileOptions:SystemEx                                                      cludeSearchPatterns:0=**/.git FileOptions:SystemExcludeSearchPatterns:1=**/.svn FileOptions:SystemExcludeSearchPatterns:2=**/.hg FileOptions:SystemExcludeSearchPatterns:3=**/CVS FileOptions:SystemExcludeSearchPatterns:4=**/.DS_Store RoslynExtensionsOptions:EnableAnalyzersSupport=true formattingOptions:useTabs=false formattingOptions:tabSize=4 formattingOptions:indentationSize=4"                                                                                                                                              0       11    4864           console-window-host (Windows internal process)                                                                                                  0      144    9208           "C:\Users\John Tsombakos\.vscode-insiders\extensions\ms-vscode.csharp-1.21.3\.omnisharp\1.34.4-beta.7\OmniSharp.exe"  -s "c:\Users\John Tsombakos\Desktop\JsonParseTest" --hostPID 6360 DotNet:enablePackageRestore=false --encoding utf-8 --loglevel information --plugin "C:\Users\John Tsombakos\.vscode-insiders\extensions\ms-vscode.csharp-1.21.3\.razor\OmniSharpPlugin\Microsoft.AspNetCore.Razor.OmniSharpPlugin.dll" FileOptions:SystemExcludeSearchPatterns:0=**/.git FileOptions:SystemExcludeSearchPatterns:1=**/.svn FileOptions:SystemExcludeSearchPatterns:2=**/.hg FileOptions:SystemExcludeSearchPatterns:3=**/CVS FileOptions:SystemExcludeSearchPatterns:4=**/.DS_Store RoslynExtensionsOptions:EnableAnalyzersSupport=true formattingOptions:useTabs=false formattingOptions:tabSize=4 formattingOptions:indentationSize=4                     0       11    7572       watcherService                                                                                                                                      0       11    6956         console-window-host (Windows internal process)                                                                                                    0       14    8492     electron-crash-reporter
As a comparison, the latest version of the "Exploration" version shows:

Version: 1.39.0-exploration (user setup)
Commit: a715df3459718a501686bd03414f69929bf6e9a2
Date: 2019-09-13T06:41:33.699Z
Electron: 6.0.9
Chrome: 76.0.3809.146
Node.js: 12.4.0
V8: 7.6.303.31-electron.0
OS: Windows_NT x64 10.0.18362
 jtsom
on 27 Sep 2019
jtsom
on 27 Sep 2019
Could someone seeing this on the latest VS Code Insiders open the dev tools for the shared process (F1 > Developer: Toggle Shared Process), run the JavaScript profiler (smilar to https://github.com/microsoft/vscode/wiki/Performance-Issues#profiling-the-renderer-process) and attach the profile here?
 chrmarti
on 27 Sep 2019
chrmarti
on 27 Sep 2019
Hope it helps.
CPU-20190927T191234.834Z.cpuprofile.txt
jtsom
on 27 Sep 2019
Here's another one.
GoNZooo
on 27 Sep 2019
seeing the same
Version: 1.39.0-insider (user setup)
Commit: e0762af258c0b20320ed03f3871a41967acc4421
Date: 2019-09-27T05:26:42.235Z
Electron: 6.0.9
Chrome: 76.0.3809.146
Node.js: 12.4.0
V8: 7.6.303.31-electron.0
OS: Windows_NT x64 10.0.17763
nothing obvious in Resource Monitor
 pocesar
on 28 Sep 2019
pocesar
on 28 Sep 2019
Status:
Version:          Code - Insiders 1.39.0-insider (e0762af258c0b20320ed03f3871a41967acc4421, 2019-09-27T05:26:42.235Z)
OS Version:       Windows_NT x64 10.0.18362
CPUs:             Intel(R) Core(TM) i7-6700HQ CPU @ 2.60GHz (8 x 2592)
Memory (System):  7.90GB (3.42GB free)
VM:               0%
Screen Reader:    no
Process Argv:
GPU Status:       2d_canvas:                     enabled
                  flash_3d:                      enabled
                  flash_stage3d:                 enabled
                  flash_stage3d_baseline:        enabled
                  gpu_compositing:               enabled
                  metal:                         disabled_off
                  multiple_raster_threads:       enabled_on
                  oop_rasterization:             disabled_off
                  protected_video_decode:        unavailable_off
                  rasterization:                 enabled
                  skia_renderer:                 disabled_off
                  surface_control:               disabled_off
                  surface_synchronization:       enabled_on
                  video_decode:                  enabled
                  viz_display_compositor:        enabled_on
                  viz_hit_test_surface_layer:    disabled_off
                  webgl:                         enabled
                  webgl2:                        enabled

CPU %   Mem MB     PID  Process
    0       74   11684  code-insiders main
    0       89    6496     gpu-process
   14       98   11716     shared-process
    0      128   12128     window (Welcome - Visual Studio Code - Insiders)
    0       89   12064       extensionHost
    0       36    8592         electron_node server.js
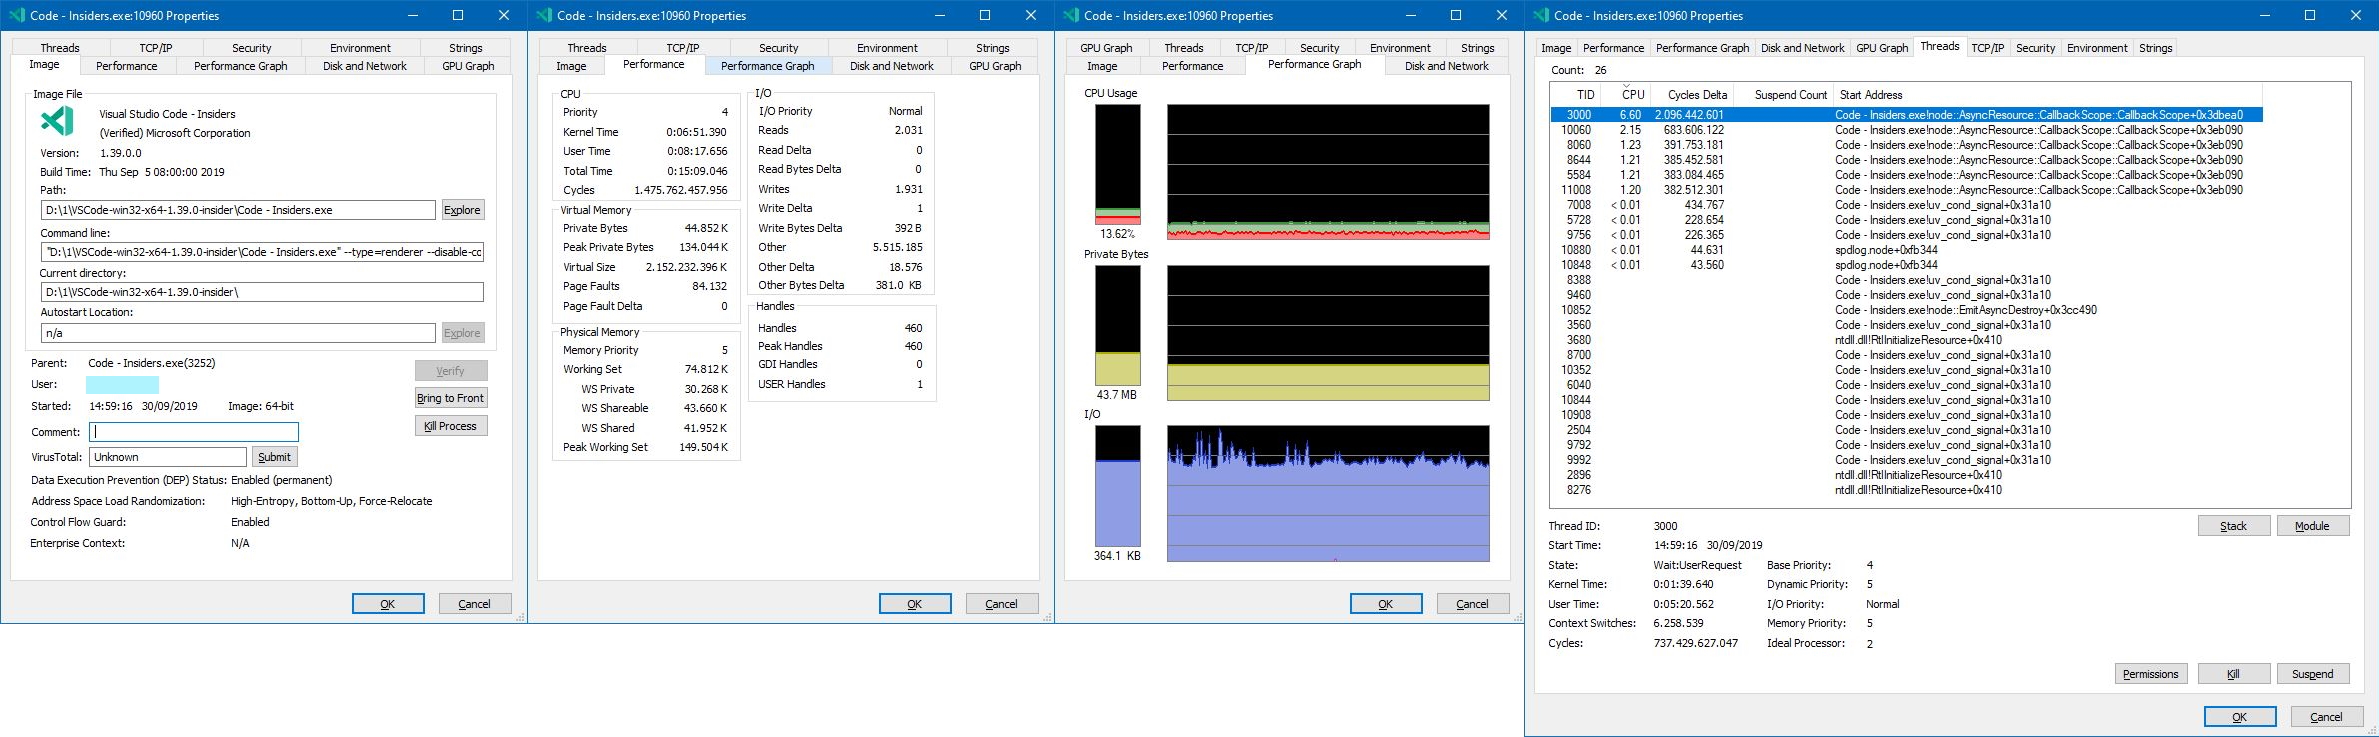
Shared process CPU profile (~60 seconds):
 velut
on 28 Sep 2019
velut
on 28 Sep 2019
Same Issue
I can confirm exactly the same behavior.
The cpu usage was absolutely normal most definitely up to the 2019-09-25 release.
It definitely started after the 2019-09-27 update.
1 core constantly pinned down by the shared process,
Disabling extensions doesn't meaningfully impact it.
System Info
CPUs Intel(R) Core(TM) i7 CPU Q 720 @ 1.60GHz (8 x 1596)
GPU Status 2d_canvas: enabled
flash_3d: enabled
flash_stage3d: enabled
flash_stage3d_baseline: enabled
gpu_compositing: enabled
metal: disabled_off
multiple_raster_threads: enabled_on
oop_rasterization: disabled_off
protected_video_decode: unavailable_off
rasterization: unavailable_off
skia_renderer: disabled_off
surface_control: disabled_off
surface_synchronization: enabled_on
video_decode: enabled
viz_display_compositor: enabled_on
viz_hit_test_surface_layer: disabled_off
webgl: enabled
webgl2: enabled
Load (avg) undefined
Memory (System) 7.99GB (3.63GB free)
Process Argv
Screen Reader no
VM 50%
Version Info
Version: 1.39.0-insider
Commit: e0762af258c0b20320ed03f3871a41967acc4421
Date: 2019-09-27T05:26:42.235Z
Electron: 6.0.9
Chrome: 76.0.3809.146
Node.js: 12.4.0
V8: 7.6.303.31-electron.0
OS: Windows_NT x64 10.0.18362
Screenshots


Shared process CPU profile (~60 seconds)
CPU-20190929T121003.cpuprofile.txt
Previous Versions Available?
BTW, is there a directory from where we can download previous versions of the 1.39 insider branch?
I have been looking but cannot find anything but the latest version.
This would temporarily solve the issue for us (high cpu usage and fan noise on top of it).
Thanks in advance.
 John-McClane
on 29 Sep 2019
John-McClane
on 29 Sep 2019
This just started happening to me too

Version: 1.39.0-insider (user setup)
Commit: e0762af258c0b20320ed03f3871a41967acc4421
Date: 2019-09-27T05:26:42.235Z
Electron: 6.0.9
Chrome: 76.0.3809.146
Node.js: 12.4.0
V8: 7.6.303.31-electron.0
OS: Windows_NT x64 10.0.18362
Just rendered my workflow unusable.
How do I revert the upgrade?
Edit: Code 1.38.1 from the web site seems to have all the wsl support I need and does not have the issue.
 offero
on 29 Sep 2019
offero
on 29 Sep 2019
Same setup as offero except OS:Windows_NT x64 10.0.17134
With the same symptoms like all others.
 fuckFH
on 29 Sep 2019
fuckFH
on 29 Sep 2019
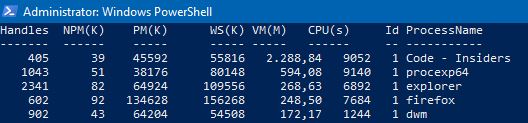
Exactly the same here. Started inside empty folder from command prompt - code-insiders . --disable-extensions. The shared-process reported by code-insiders --status uses 100% of one of my CPU cores:
Version:          Code - Insiders 1.39.0-insider (e0762af258c0b20320ed03f3871a41967acc4421, 2019-09-27T05:26:42.235Z)
OS Version:       Windows_NT x64 10.0.18362
CPUs:             Intel(R) Core(TM) i7-6700HQ CPU @ 2.60GHz (8 x 2592)
Memory (System):  7.80GB (2.99GB free)
VM:               0%
Screen Reader:    no
Process Argv:     . --disable-extensions
GPU Status:       2d_canvas:                     enabled
                  flash_3d:                      enabled
                  flash_stage3d:                 enabled
                  flash_stage3d_baseline:        enabled
                  gpu_compositing:               enabled
                  metal:                         disabled_off
                  multiple_raster_threads:       enabled_on
                  oop_rasterization:             disabled_off
                  protected_video_decode:        unavailable_off
                  rasterization:                 enabled
                  skia_renderer:                 disabled_off
                  surface_control:               disabled_off
                  surface_synchronization:       enabled_on
                  video_decode:                  enabled
                  viz_display_compositor:        enabled_on
                  viz_hit_test_surface_layer:    disabled_off
                  webgl:                         enabled
                  webgl2:                        enabled

CPU %   Mem MB     PID  Process
    0       82    8972  code-insiders main
    0      127    2660     window (empty - Visual Studio Code - Insiders)
    0       57    1136       extensionHost
    0       11   12564       watcherService
    0       11    9184         console-window-host (Windows internal process)
    0       14    6932     electron-crash-reporter
   14       70    8252     shared-process
    0      103   10132     gpu-process

Workspace Stats:
|  Window (empty - Visual Studio Code - Insiders)
|    Folder (empty): 0 files
|      File types:
|      Conf files:
Command line of the process that uses 100% CPU:
"C:\Users\Svincho\AppData\Local\Programs\Microsoft VS Code Insiders\Code - Insiders.exe" --type=renderer --disable-color-correct-rendering --field-trial-handle=1896,5753891113811261791,4998443115046434544,131072 --disable-features=LayoutNG,SpareRendererForSitePerProcess --lang=en-US --standard-schemes --secure-schemes=vscode-resource --bypasscsp-schemes --cors-schemes=vscode-resource --fetch-schemes=vscode-resource --service-worker-schemes --app-user-model-id=Microsoft.VisualStudioCodeInsiders --app-path="C:\Users\Svincho\AppData\Local\Programs\Microsoft VS Code Insiders\resources\app" --node-integration --no-sandbox --no-zygote --background-color=#1e1e1e --disable-blink-features=Auxclick --device-scale-factor=1 --num-raster-threads=4 --enable-main-frame-before-activation --service-request-channel-token=14099556932833274872 --renderer-client-id=6 --no-v8-untrusted-code-mitigations --mojo-platform-channel-handle=2900 /prefetch:1
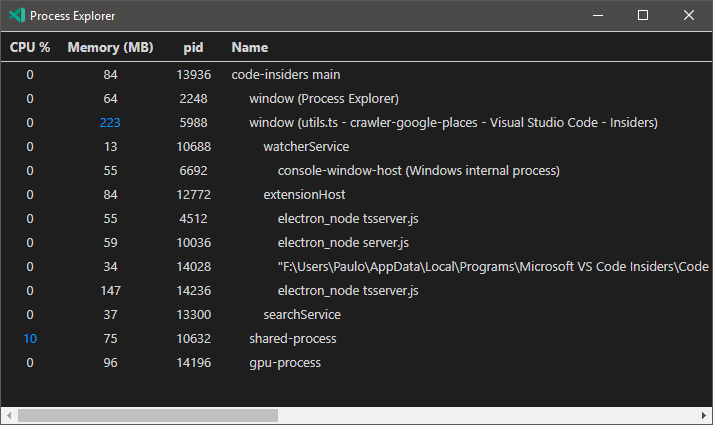
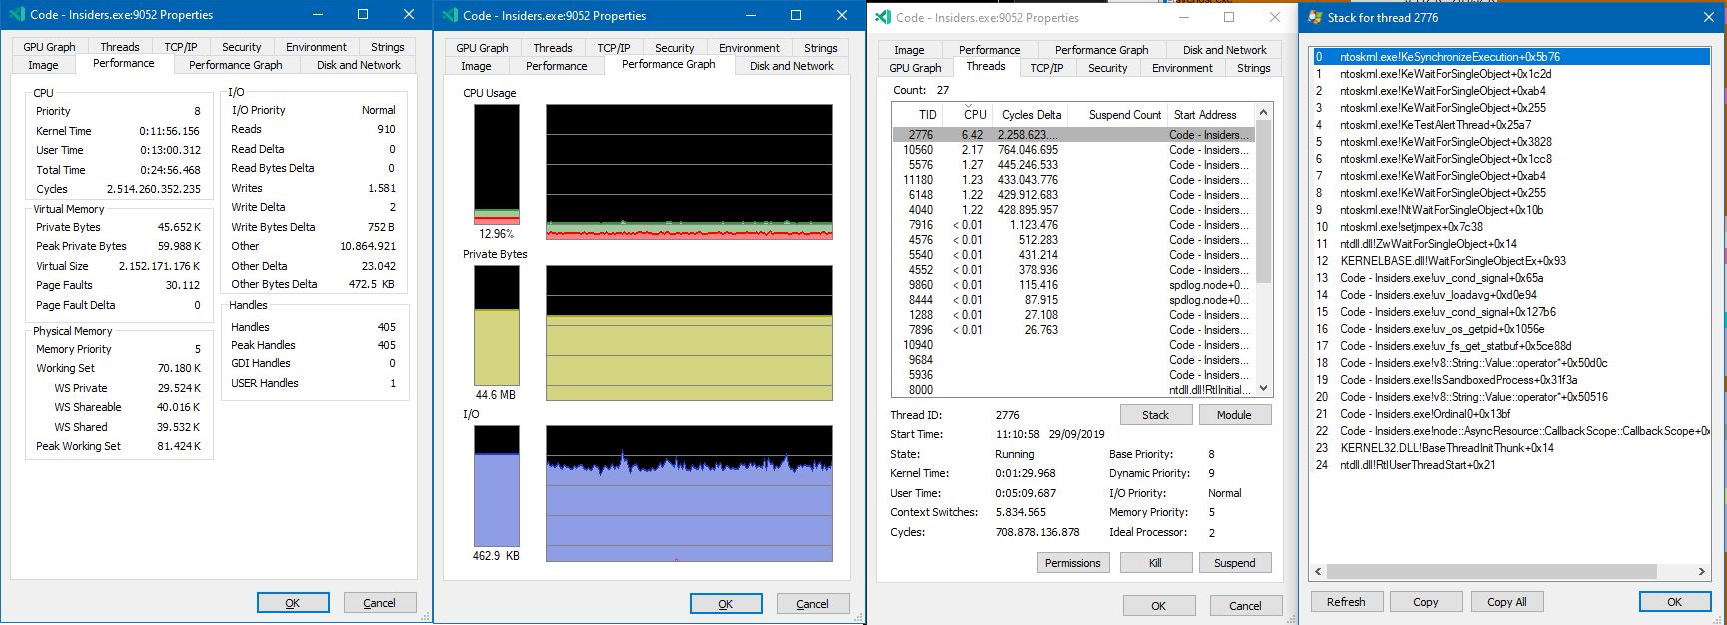
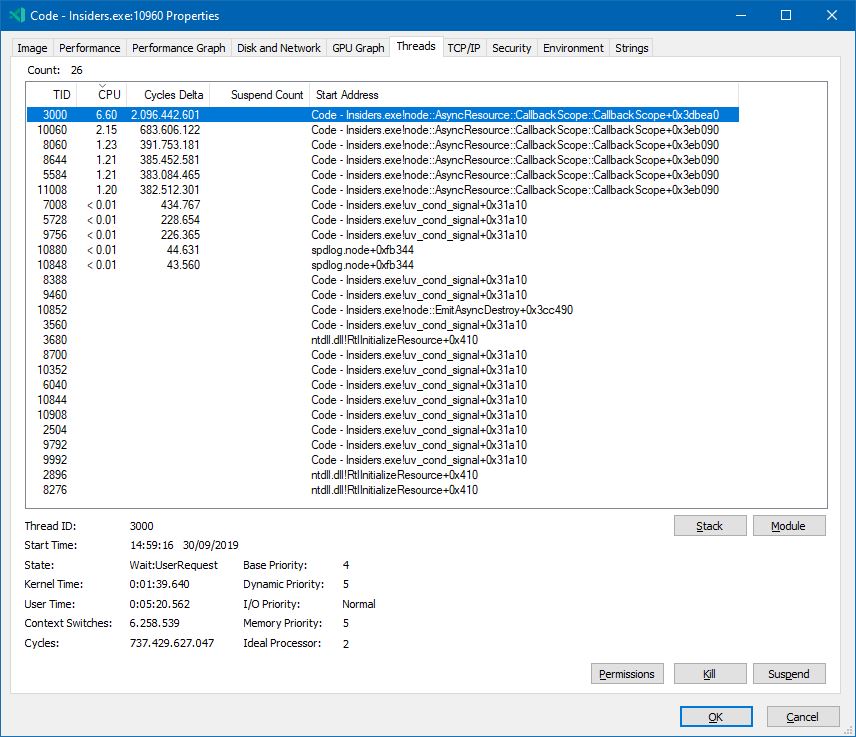
Here is a screenshot from Process Explorer of the thread that causes main CPU usage and its call stack:

 varadero
on 29 Sep 2019
varadero
on 29 Sep 2019
@John-McClane Windows User Setup for the Thursday build is here.
Lots of mkdirp activity in some of the CPU profiles. Can't find a hint where this originates from.
/cc @jrieken @bpasero @sandy081
chrmarti
on 29 Sep 2019
Same problem - 10-14% CPU usage generated by "shared-process" process.
Version: VSCode Insiders 1.39.0
CPU/GPU: Ryzen 5 2500U / integrated
 mbledkowski
on 29 Sep 2019
mbledkowski
on 29 Sep 2019
I can reproduce and it is indeed tons of calls to mkdirp. @sandy081 assigning to you since I think you are the most recent person adding code to the shared process for user settings sync.
Unfortunately I cannot debug who is the initiator of the mkdirp call :(

Something fishy going on with paths it seems:

 bpasero
on 30 Sep 2019
bpasero
on 30 Sep 2019
None of the settings sync code should be active and I do not think it makes mkdirp calls. But to be sure will investigate.
@bpasero Does these mkdirp calls are coming from file system service or directly getting called?
 sandy081
on 30 Sep 2019
sandy081
on 30 Sep 2019
I cannot debug this unfortunately, need to try to reproduce running out of sources.
bpasero
on 30 Sep 2019
Looks like the culprit is the new log service i created for user data sync that is giving an invalid path to spdlog. Fixed it.
sandy081
on 30 Sep 2019
Any chance of a new Insiders release, to get this fix out?
jtsom
on 30 Sep 2019
Looks like the culprit is the new log service i created for user data sync that is giving an invalid path to spdlog. Fixed it.
Nope! Not Fixed!
At least not on the 2019-09-30 build pushed out today.
Still the same issue.
System Info
CPUs Intel(R) Core(TM) i7 CPU Q 720 @ 1.60GHz (8 x 1596)
GPU Status 2d_canvas: enabled
flash_3d: enabled
flash_stage3d: enabled
flash_stage3d_baseline: enabled
gpu_compositing: enabled
metal: disabled_off
multiple_raster_threads: enabled_on
oop_rasterization: disabled_off
protected_video_decode: unavailable_off
rasterization: unavailable_off
skia_renderer: disabled_off
surface_control: disabled_off
surface_synchronization: enabled_on
video_decode: enabled
viz_display_compositor: enabled_on
viz_hit_test_surface_layer: disabled_off
webgl: enabled
webgl2: enabled
Load (avg) undefined
Memory (System) 7.99GB (3.51GB free)
Process Argv
Screen Reader no
VM 50%
Extensions: none
Version Info
Version: 1.39.0-insider
Commit: 601e3e0762ac93e03cfef8336be8223bf32754e1
Date: 2019-09-30T07:41:01.671Z
Electron: 6.0.9
Chrome: 76.0.3809.146
Node.js: 12.4.0
V8: 7.6.303.31-electron.0
OS: Windows_NT x64 10.0.18362
Screenshots


Shared process CPU profile (~60 seconds)
CPU-20190930T150229.cpuprofile.txt


Old Version
BTW, I have dug up this version from 2019-09-24, and it's working normal, cpu usage almost nil.
Old Version Info
Version: 1.39.0-insider
Commit: 9f6a745027fc7b2a12495970f64625e24f410224
Date: 2019-09-24T05:26:22.699Z
Electron: 6.0.9
Chrome: 76.0.3809.146
Node.js: 12.4.0
V8: 7.6.303.31-electron.0
OS: Windows_NT x64 10.0.18362


John-McClane
on 30 Sep 2019
That’s why I asked if a new build could be pushed out. The 9/30 build doesn’t include that fix (based on the commit in the about box vs. the commit of the fix.)
jtsom
on 30 Sep 2019
Yes its not available in latest insiders. Will release new one with the fix and let you know.
sandy081
on 30 Sep 2019
Released new insiders. Please check it out.
sandy081
on 30 Sep 2019
Seems to be better for me.
(Looks like Electron was revered back to v4 for this version too)
jtsom
on 30 Sep 2019
Seems to be better for me.
(Looks like Electron was revered back to v4 for this version too)
Definitely Better!
Yes, it definitely looks better, cpu-usage-wise.
Version: 1.39.0-insider
Commit: 313ede61cbad8f9dc748907b3384e059ddddb79a
Date: 2019-10-01T07:29:05.652Z
Electron: 4.2.10
Chrome: 69.0.3497.128
Node.js: 10.11.0
V8: 6.9.427.31-electron.0
OS: Windows_NT x64 10.0.18362

Version: 1.39.0-insider
Commit: 9f6a745027fc7b2a12495970f64625e24f410224
Date: 2019-09-24T05:26:22.699Z
Electron: 6.0.9
Chrome: 76.0.3809.146
Node.js: 12.4.0
V8: 7.6.303.31-electron.0
OS: Windows_NT x64 10.0.18362

But...
But I can't help wondering why it was required to go back to year(s)-old versions of Electron, Chrome and Node.js.
The 1.39 2019-09-24 version that worked OK has more up-to-date components.
And why the extra child process on identical conditions?
Just wondering...
John-McClane
on 1 Oct 2019
@John-McClane Electron version was downgraded because of different reasons
Please provide your feedback in that issue. Thanks.
sandy081
on 1 Oct 2019
Related issues
 vsccarl
·
3Comments
vsccarl
·
3Comments
 lukehoban
·
3Comments
lukehoban
·
3Comments
 DovydasNavickas
·
3Comments
DovydasNavickas
·
3Comments
 trstringer
·
3Comments
trstringer
·
3Comments
 borekb
·
3Comments
borekb
·
3Comments
Most helpful comment
Seeing the same after this very last update. 1 core pinned by the shared process, disablingc extensions doesn't meaningfully impact it.
Version: 1.39.0-insider (user setup)
Commit: e0762af258c0b20320ed03f3871a41967acc4421
Date: 2019-09-27T05:26:42.235Z
Electron: 6.0.9
Chrome: 76.0.3809.146
Node.js: 12.4.0
V8: 7.6.303.31-electron.0
OS: Windows_NT x64 10.0.18985