Vscode: Breakpoints are not working under macOS Catalina
- VSCode Version: 1.36.1
- OS Version: macOS 10.15 Beta (19A512f)
Steps to Reproduce:
- Create hello.js
- Set breakpoint on first line
- Launch under debugger
Does this issue occur when all extensions are disabled?: Yes
hello.js:
console.log('Hello');
launch.json:
{
  "version": "0.2.0",
  "configurations": [
    {
      "type": "node",
      "request": "launch",
      "name": "Launch Program",
      "program": "${workspaceFolder}/hello.js",
    }
  ]
}
 BryanHunt
All 65 comments
I can not reproduce this issue on my macOS Catalina.
I am using node 10.16
@BryanHunt can you reproduce with latest vscode insiders https://code.visualstudio.com/insiders/
What node version are you using?
 isidorn
on 30 Jul 2019
isidorn
on 30 Jul 2019
I have the same issue, and I can confirm the insiders version doesn't fix this.
I use the same version of Catalina as @BryanHunt (19A512f), that is, Beta 4.
Same format in launch.json file.
Node version is 12.1.0.
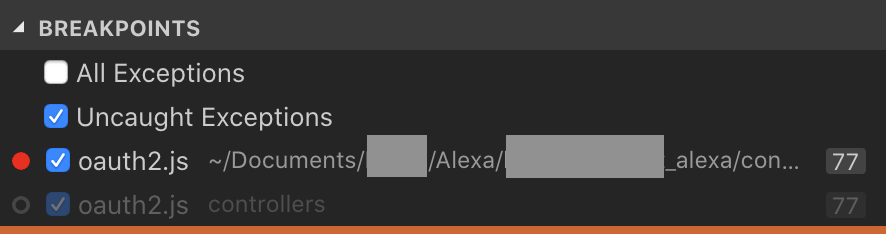
However, I found something that could be helpful: when using Cmd+P to quickly open files in my workspace some appear twice, showing either an absolute path or a relative one. Breakpoints do work if set on those that have an absolute path but won't work on the ones with a relative one even if they reference the same file. Also, I have no idea why this duplication only happens on some files.
Here is an example of this behavior:

 Arasthel
on 30 Jul 2019
Arasthel
on 30 Jul 2019
@Arasthel might it be that the casing in the path is not the same as it is on disk?
@BryanHunt is your issues the same as @Arasthel do you aslo see duplicated files in quick open?
fyi @weinand @bpasero
isidorn
on 31 Jul 2019
I can reproduce the problem with the insiders build.
I can reproduce the problem on both node 10.x and 12.x.
I don't use quick open so I can't comment on that right now. I'll give that a try later tonight.
BryanHunt
on 31 Jul 2019
When I use quick open, I only see one path to the file and it's the non fully qualified one (at least for my test typescript project).
BryanHunt
on 1 Aug 2019
Not sure if this is related, but I've also noticed that files don't appear in the explorer when generated by a command-line tool like ember g unless you click refresh.
BryanHunt
on 1 Aug 2019
I'm still seeing this problem on the latest Catalina beta (19A526h). I discovered that if I change my code to:
console.log("Hello");
throw new Error("error");
I can get the debugger to break on Uncaught Exceptions. When the debugger is stopped on the throw statement and I set a breakpoint on console.log(), the next run will trigger the breakpoint.
BryanHunt
on 2 Aug 2019
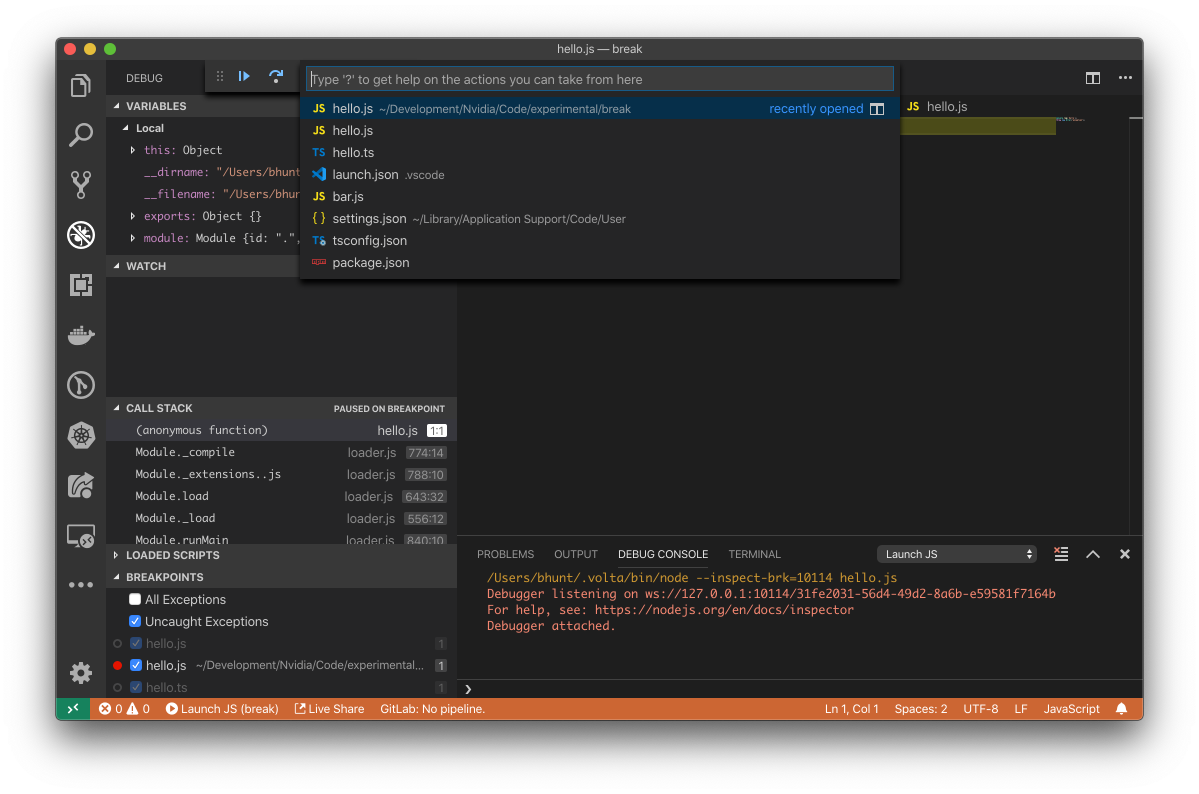
I also discovered that after doing this, quick open will show hello.js twice: once with the short name and once with the fully qualified path. I also notice that the breakpoint is set on the file with the fully qualified path.
BryanHunt
on 2 Aug 2019
@BryanHunt instead of throw new Error("error"); you could add a "debugger;" statement to your code which should make the debugger stop.
 weinand
on 2 Aug 2019
weinand
on 2 Aug 2019
This issue has been closed automatically because it needs more information and has not had recent activity. See also our issue reporting guidelines.
Happy Coding!
![vscodebot[bot] picture](https://avatars2.githubusercontent.com/in/2406?v=4&s=40) vscodebot[bot]
on 9 Aug 2019
vscodebot[bot]
on 9 Aug 2019
Adding debugger works in the case of JS, but I don't think that is a good test since now that vscode has the full path to the file, regular breakpoints work.
I tried the same experiment with typescript using debugger and it fails.
BryanHunt
on 9 Aug 2019
Let's reopen this issue since more users might be hitting this.
isidorn
on 12 Aug 2019
@BryanHunt I had the same issue with typescript, and I needed to add "sourceMap": true in order for vscode to understand there are .map files to use and debug typescript
 Plamen5kov
on 16 Aug 2019
Plamen5kov
on 16 Aug 2019
I have "sourceMap": true set.
I just tried again using Typescript and I changed my throw to debugger. vscode stopped on the debugger statement, but breakpoints are still not working in the original ts file.
One thing that is very interesting is that when the debugger stops, the hello.ts file is loaded into a new tab and has a different path when you hover over the tab. When I hover over the hello.ts file that comes up when double clicking the file in the explorer, I get:
/System/Volumes/Data/Users/bhunt/Development/...
when I hover the hello.ts file brought up after hitting the debugger statement, I get:
~/Development/...
Could this be possibly be related to Issue #76503?
BryanHunt
on 22 Aug 2019
@isidorn What shell are you using when you can't reproduce the bug? I'm guessing if you switch to zsh, you can reproduce the bug.
BryanHunt
on 22 Aug 2019
I am using zsh, however I do not see how this is related when debugging a program for the launch.json that you provided.
isidorn
on 22 Aug 2019
Bummer, there goes that theory. Here is the launch.json I used in my Typescript test:
{
"version": "0.2.0",
"configurations": [
{
"type": "node",
"request": "launch",
"name": "Launch TS",
"program": "${workspaceFolder}/dist/hello.js",
"preLaunchTask": "tsc: build - tsconfig.json",
"outFiles": [
"${workspaceFolder}/dist/**/*.js"
]
}
]
}
@isidorn When you open a file from the explorer and hover over the tab, what do you get?
BryanHunt
on 22 Aug 2019
@BryanHunt the file path discrepancy is a great find. That would explain the issues you are seeing. And issue #76503 is a consequence from the same problem.
But what I don't understand is why I do not see that discrepancy on my Cataline system... I will try another time to reproduce this...
weinand
on 22 Aug 2019
@BryanHunt what version of Catalina are you using? I'm using 19A487m
weinand
on 22 Aug 2019
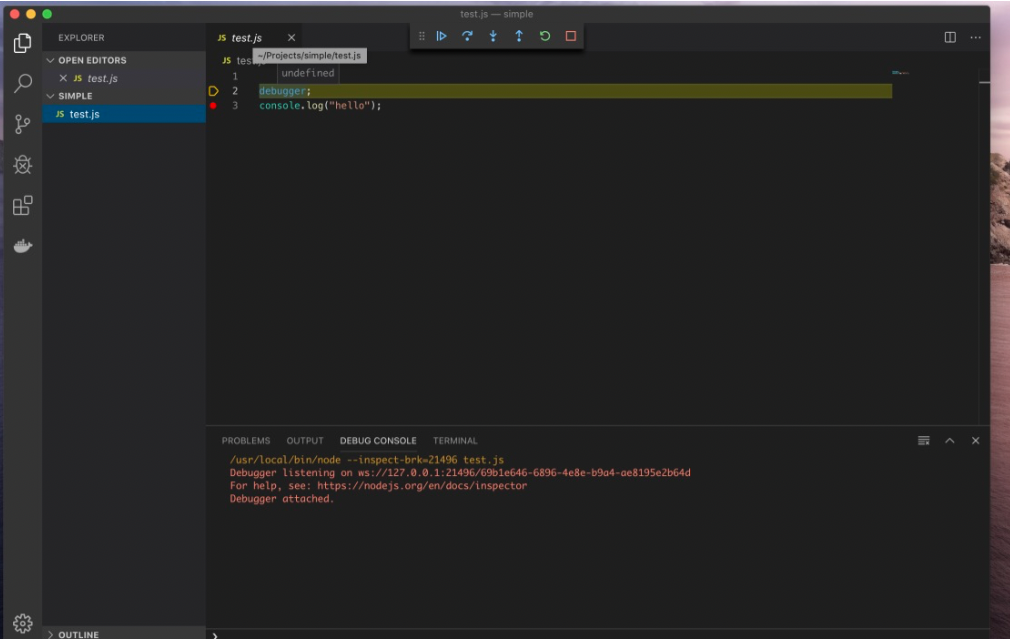
@BryanHunt When opening a file from the explorer and hovering over the tab, I see the correct path:
weinand
on 22 Aug 2019
How are you launching VS Code?
When you run pwd in VS Code's integrated terminal, what is the result?
weinand
on 22 Aug 2019
@weinand I'm using build 19A536g. I launch VS Code by clicking on the icon in the dock.
pwd: /Users/bhunt/Development/Nvidia/Code/experimental/break
BryanHunt
on 22 Aug 2019
If you are opening a file from the VS Code explorer and hover over its tab, then you are seeing a path that looks like this: /System/Volumes/Data/Users/bhunt/Development/..., correct?
Are you using any symbolic links in your setup?
Are you opening your project in VS Code via a workspace file?
weinand
on 22 Aug 2019
Correct, hovering over the tab after opening from the explorer shows /System/Volumes/Data/Users/bhunt/Development/...
I checked all of the directories in the path /Users/bhunt/Development/... and there are no symbolic links.
I am not using a workspace file
BryanHunt
on 22 Aug 2019
So the problem is not the debugging, but VS Code's file service:
a file opened from the VS Code's explorer has a different path ("/System/Volumes/Data/Users/bhunt/Development/...") than the file seen by the node.js ("/Users/bhunt/Development/...") which results in breakpoints not being hit.
Does it help if you substitute the two occurrences of the variable${workspaceFolder} in your launch config by the "long" workspace path starting with "/System/Volumes/Data/Users/bhunt/Development/..."?
weinand
on 22 Aug 2019
Just discovered that if a create a new directory under .../experimental/... and then create a new file in the explorer that is has the correct path: ~/Development/...
So, how did the other project pick up the wrong base path?
I'll try the `${workspaceFolder} substitution.
BryanHunt
on 22 Aug 2019
Substituting /System/Volumes/Data/... for ${workspaceFolder} does not fix the problem for that project.
BryanHunt
on 22 Aug 2019
The debugger works in the new project I created as expected.
BryanHunt
on 22 Aug 2019
great! So what exactly is the (path) difference between the two directories?
weinand
on 22 Aug 2019
I just opened one of my work project workspaces and it shows all of the files with the prefix /System/Volumes/Data/...
BryanHunt
on 22 Aug 2019
@bpasero any idea what the problem could be?
weinand
on 22 Aug 2019
On disk the project that fails is:
/Users/bhunt/Development/Nvidia/Code/experimental/break
the one that works is:
/Users/bhunt/Development/Nvidia/Code/experimental/foo
BryanHunt
on 22 Aug 2019
If I open one of my work projects outside of the workspace, it has the correct prefix of ~/Development
BryanHunt
on 22 Aug 2019
BTW, if anybody wants to look at this real-time, I think our WebEx works outside of our firewall
BryanHunt
on 22 Aug 2019
Ah, the workspace file has the path to each of the projects prefixed with /System/Volumes/Data/...
This explains the difference I get when opening the workspace vs the individual projects.
It's still a mystery how the /System/Volumes/Data/... prefix got picked up to begin with and why I have one project (no workspace) that uses that bad prefix.
BryanHunt
on 22 Aug 2019
I just figured out how my trivial project is not working. At some point, VS Code picked up the full path to the project as /System/Volumes/Data/... and I have been opening the project from File -> Open Recent where it still has that path. If I use File -> Open... to open the project, all of the files are correctly prefixed with ~/Development.
BryanHunt
on 22 Aug 2019
I wonder if the bad prefix was picked up when I was still using bash for the default shell? I might try switching back later to test this theory.
BryanHunt
on 22 Aug 2019
@BryanHunt to clarify you ended up here because of a vscode-multi-root-workspace-file that has /System... paths?
 bpasero
on 22 Aug 2019
bpasero
on 22 Aug 2019
@bpasero in some comment from above Bryan said that he is not using a workspace file.
weinand
on 22 Aug 2019
@BryanHunt can you distill reproducible steps how you ended up getting the bad path into VSCode?
Still, I wonder how breakpoint paths could have been using the other path. @weinand @isidorn is there some logic that normalizes the path when adding a breakpoint or are you taking the model resource as it is?
So the problem is not the debugging, but VS Code's file service:
a file opened from the VS Code's explorer has a different path ("/System/Volumes/Data/Users/bhunt/Development/...") than the file seen by the node.js ("/Users/bhunt/Development/...") which results in breakpoints not being hit.
How so? Where is that code?
bpasero
on 23 Aug 2019
@bpasero I think we are using the model resource without modification when setting breakpoints.
@isidorn please correct me, if my assumption is not correct.
But independent from debugging, Bryan saw the "long alternative path" when hovering over the editor tab (and I assume that the hover shows the model path?).
weinand
on 23 Aug 2019
That hover is coming from the label service, also in @isidorn land
I think the best truth is to invoke the action to copy the full path into clipboard and inspect from there.
bpasero
on 23 Aug 2019
@weinand we are not normalising the paths coming in for breakpoints. We use them as they are.
Yes the hover is also polished by the uri label service.
The copy path also uses the label service. It is everywhere hehe.
isidorn
on 23 Aug 2019
Ok understood. So then I am still puzzled why:
- users opens a folder
/System/Volumes/... - explorer (and any following operations from there) treats this folder as
/Users/bhunt/Development
I think that is the gist of this issue right?
bpasero
on 23 Aug 2019
@bpasero I believe that's the gist of what is going wrong with VS Code.
Somehow the path /System/Volumes/... made its way into my projects. In that case, VS Code is still able to open the projects and load the files into the editor, but that is when breakpoints won't work.
I think you can reproduce the problem by creating a workspace and manually setting the path to the project to be /System/Volumes/....
I still don't know how I got the path /System/Volumes/... in the first place. I have two theories:
- There was a bug in the early releases of Catalina that caused that path to be picked up.
- It was a problem with bash. I believe I used VS Code when I still had bash as my default shell, then recently switched to the recommended zsh.
BryanHunt
on 23 Aug 2019
@BryanHunt maybe this is a macOS Catalina specific thing as I do not see /System/Volumes on my macOS.
The thing is: it should be perfectly fine to open a workspace from /System/Volumes and set breakpoints. I see this like a link on a file system and we do support folders that have linked targets.
Here is what I would expect, maybe you could try an experiment:
- open
/System/Volumesfolder from the command line into code - open a file from the explorer
- check what the path says, is it the one you started with?
bpasero
on 23 Aug 2019
Ok, here is a way to reproduce the problem:
- Create a hello world project
- Create a workspace and prefix the path to the project with
/System/Volumes/Data/ - Load the workspace
- Set a breakpoint
- Debug
Example workspace:
{
"folders": [
{
"path": "/System/Volumes/Data/Users/bhunt/Development/OpenSource/test"
}
],
"settings": {}
}
@BryanHunt when you hover over a file in the explorer of VSCode, which path do you get then?
bpasero
on 25 Aug 2019
@bpasero /System/Volumes/Data/Users/bhunt/Development/OpenSource/test/hello.js
BryanHunt
on 25 Aug 2019
@BryanHunt ok another experiment:
- add a beakpoint into a file of that folder
- invoke the command "Developer: Log Storage Database Contents"
- from the opening developer tools in the console find and copy this entry:

If the path in there the same path with /System...?
bpasero
on 26 Aug 2019
when following the steps listed in https://github.com/microsoft/vscode/issues/78127#issuecomment-524640067 I can observe this:
- opening the integrated terminal and running the
pwdcommand results in a/Users/...path which is different from the folder path specified in the workspace file (/System/Volumes/Data/User/...). So there is a discrepancy between the workspace folder path and the current working directory of the workspace. - since
node.jsis launched in the current working directory, it will produce paths based on/Users/...which do not match the paths that VS Code uses when registering breakpoints. This explains why breakpoints are not hit.
Breakpoints not being hit is the expected debugging behavior in the described setup.
The real question is "why is the working directory a different path than the workspace folder path specified in the workspace file".
weinand
on 26 Aug 2019
@BryanHunt when you open a terminal on /System/Volumes/Data/User/ and run pwd, what do you see?
And if that matches the directory, can you try downloading node (10.16.0), run it from the /System/Volumes/Data/User/ folder and print the output of process.cwd()?
bpasero
on 26 Aug 2019
@bpasero I"ll give that a try when I get home later tonight
BryanHunt
on 26 Aug 2019
@bpasero Here is what I see with node 10.16.0:
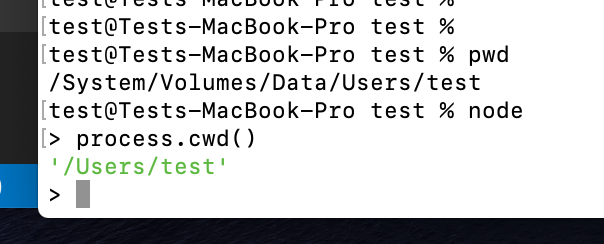
So node.js started in the long-path directory shows the short path with process.cwd()
weinand
on 26 Aug 2019
@weinand interesting, that may qualify for a bug against node.js possibly?
bpasero
on 26 Aug 2019
@bpasero I get the same result aw @weinand when using node 12:
➜ test cd /System/Volumes/Data/Users/bhunt/Development/OpenSource/test
➜ test pwd
/System/Volumes/Data/Users/bhunt/Development/OpenSource/test
➜ test node
Welcome to Node.js v12.9.1.
Type ".help" for more information.
> process.cwd()
'/Users/bhunt/Development/OpenSource/test'
This is not only related to node projects. I've got the same problem when trying to debug compiled C programs.
I'm running macOS Catalina 10.15.1 and vscode 1.40.0.
I get the same result as @BryanHunt when checking the directories.
 roblunx
on 9 Nov 2019
roblunx
on 9 Nov 2019
I have the same issue when debugging cpp in macOS Catalina.
I use clang++, lldb in tasks.json and launch.json
Version information
> sw_vers
ProductName:   Mac OS X
ProductVersion: 10.15.1
BuildVersion:   19B88
> clang++ --version
Apple clang version 11.0.0 (clang-1100.0.33.12)
Target: x86_64-apple-darwin19.0.0
Thread model: posix
InstalledDir: /Library/Developer/CommandLineTools/usr/bin
> lldb --version
lldb-1100.0.30.6
Apple Swift version 5.1.2 (swiftlang-1100.0.278 clang-1100.0.33.9)
> code --version
1.40.1
8795a9889db74563ddd43eb0a897a2384129a619
x64
launch.json
{
    "version": "0.2.0",
    "configurations": [
        {
            "name": "clang++ build and debug active file",
            "type": "cppdbg",
            "request": "launch",
            "program": "${fileDirname}/${fileBasenameNoExtension}",
            "args": [],
            "stopAtEntry": false,
            "cwd": "${workspaceFolder}",
            "environment": [],
            "externalConsole": false,
            "MIMode": "lldb",
            "preLaunchTask": "clang++ build active file"
        }
    ]
}
````

### tasks.json

```json
{
    "tasks": [
        {
            "type": "shell",
            "label": "clang++ build active file",
            "command": "/usr/bin/clang++",
            "args": [
                "-g",
                "${file}",
                "-o",
                "${fileDirname}/${fileBasenameNoExtension}"
            ],
            "options": {
                "cwd": "/usr/bin"
            }
        }
    ],
    "version": "2.0.0"
}
 lamontu
on 14 Nov 2019
lamontu
on 14 Nov 2019
I have the same issue when debugging cpp in macOS Catalina.
I use clang++, lldb in tasks.json and launch.jsonVersion information
> sw_vers
ProductName:   Mac OS X
ProductVersion: 10.15.1
BuildVersion:   19B88
> clang++ --version
Apple clang version 11.0.0 (clang-1100.0.33.12)
Target: x86_64-apple-darwin19.0.0
Thread model: posix
InstalledDir: /Library/Developer/CommandLineTools/usr/bin
> lldb --version
lldb-1100.0.30.6
Apple Swift version 5.1.2 (swiftlang-1100.0.278 clang-1100.0.33.9)
> code --version
1.40.1
8795a9889db74563ddd43eb0a897a2384129a619
x64
launch.json
{
    "version": "0.2.0",
    "configurations": [
        {
            "name": "clang++ build and debug active file",
            "type": "cppdbg",
            "request": "launch",
            "program": "${fileDirname}/${fileBasenameNoExtension}",
            "args": [],
            "stopAtEntry": false,
            "cwd": "${workspaceFolder}",
            "environment": [],
            "externalConsole": false,
            "MIMode": "lldb",
            "preLaunchTask": "clang++ build active file"
        }
    ]
}
tasks.json
{
    "tasks": [
        {
            "type": "shell",
            "label": "clang++ build active file",
            "command": "/usr/bin/clang++",
            "args": [
                "-g",
                "${file}",
                "-o",
                "${fileDirname}/${fileBasenameNoExtension}"
            ],
            "options": {
                "cwd": "/usr/bin"
            }
        }
    ],
    "version": "2.0.0"
}
have you already fix this bug?
 ILTShade
on 23 Nov 2019
ILTShade
on 23 Nov 2019
I have the same issue when debugging cpp in macOS Catalina.
I use clang++, lldb in tasks.json and launch.jsonVersion information
> sw_vers
ProductName: Mac OS X ProductVersion: 10.15.1 BuildVersion: 19B88
> clang++ --version
Apple clang version 11.0.0 (clang-1100.0.33.12) Target: x86_64-apple-darwin19.0.0 Thread model: posix InstalledDir: /Library/Developer/CommandLineTools/usr/bin
> lldb --version
lldb-1100.0.30.6 Apple Swift version 5.1.2 (swiftlang-1100.0.278 clang-1100.0.33.9)
> code --version
1.40.1 8795a9889db74563ddd43eb0a897a2384129a619 x64launch.json
{
    "version": "0.2.0",
    "configurations": [
        {
            "name": "clang++ build and debug active file",
            "type": "cppdbg",
            "request": "launch",
            "program": "${fileDirname}/${fileBasenameNoExtension}",
            "args": [],
            "stopAtEntry": false,
            "cwd": "${workspaceFolder}",
            "environment": [],
            "externalConsole": false,
            "MIMode": "lldb",
            "preLaunchTask": "clang++ build active file"
        }
    ]
}
tasks.json
{
    "tasks": [
        {
            "type": "shell",
            "label": "clang++ build active file",
            "command": "/usr/bin/clang++",
            "args": [
                "-g",
                "${file}",
                "-o",
                "${fileDirname}/${fileBasenameNoExtension}"
            ],
            "options": {
                "cwd": "/usr/bin"
            }
        }
    ],
    "version": "2.0.0"
}
have you already fix this bug?
There is a workaround in the cpptools issue.
You can use extension CodeLLDB for CPP debugging, this can work for me.
lamontu
on 27 Nov 2019
Installing the codelldb extension and compiling with gcc -g (-g flag being the key) (yields an additional debug symbols file a.out.dSYM) got breakpoints working for me.
 colvint
on 18 Jan 2020
colvint
on 18 Jan 2020
i'm having this problem as well: on catalina, vscode is stopping on breakpoints but there's no stack or code
i'm debugging python.
when i try codelldb i get
Internal debugger error: 'foo.py' doesn't contain any 'host' platform architectures: x86_64h, x86_64, i386
 popmonkey
on 2 Mar 2020
popmonkey
on 2 Mar 2020
@popmonkey please file an issue against the Python extension. This bug is for node.js only.
weinand
on 2 Mar 2020
please file an issue against the Python extension
@weinand will do
however, can we change the title of this issue to mention node in that case? it looks very generic. not to mention there's cpp versions of this bug mentioned in the comments as well.
i have a feeling the issue is the same across all the debuggers because of the way the file system changes in Catalina affect source code location.
popmonkey
on 2 Mar 2020
Related issues
 borekb
·
3Comments
borekb
·
3Comments
 DovydasNavickas
·
3Comments
DovydasNavickas
·
3Comments
 NikosEfthias
·
3Comments
NikosEfthias
·
3Comments
 lukehoban
·
3Comments
lukehoban
·
3Comments
 philipgiuliani
·
3Comments
philipgiuliani
·
3Comments
Most helpful comment
I have the same issue when debugging cpp in macOS Catalina.
I use clang++, lldb in tasks.json and launch.json
Version information
> sw_versProductName: Mac OS X ProductVersion: 10.15.1 BuildVersion: 19B88> clang++ --versionApple clang version 11.0.0 (clang-1100.0.33.12) Target: x86_64-apple-darwin19.0.0 Thread model: posix InstalledDir: /Library/Developer/CommandLineTools/usr/bin> lldb --versionlldb-1100.0.30.6 Apple Swift version 5.1.2 (swiftlang-1100.0.278 clang-1100.0.33.9)> code --version1.40.1 8795a9889db74563ddd43eb0a897a2384129a619 x64launch.json