Vscode: Debug console scrolls near top after each evaluated line after exception raised in debug console
Issue Type: Bug
See also https://github.com/Microsoft/vscode-python/issues/4725 - but note that vscode-python people say they
do not control the scrolling behavior of the debug console in VS Code
Expected behaviour
Debug console behaves normally
Actual behaviour
Debug console scrolls to top after each evaluated line
Steps to reproduce:
- Save this code as Bug.py:
import sys
sys.exit()
- Enable breakpoints at "Uncaught exceptions"
- Debug
Bug.pyin VS Code - When hitting SystemExit exception, run
print(1)in Debug console. - Run
sys.exit()a bunch of times (1-5 times) in the Debug console. - Notice that at one point, Debug console scrolls to top
- Scroll to bottom of Debug console output
- Run
print(2)in Debug console. - Notice that you don't see
2due to Debug console scrolling near top again.
VS Code version: Code 1.32.1 (05f146c7a8f7f78e80261aa3b2a2e642586f9eb3, 2019-03-08T00:51:49.278Z)
OS version: Windows_NT x64 10.0.17763
System Info
|Item|Value|
|---|---|
|CPUs|Intel(R) Core(TM) i5-4310M CPU @ 2.70GHz (4 x 2694)|
|GPU Status|2d_canvas: enabled
checker_imaging: disabled_off
flash_3d: enabled
flash_stage3d: enabled
flash_stage3d_baseline: enabled
gpu_compositing: enabled
multiple_raster_threads: enabled_on
native_gpu_memory_buffers: disabled_software
rasterization: unavailable_off
surface_synchronization: enabled_on
video_decode: enabled
webgl: enabled
webgl2: unavailable_off|
|Memory (System)|7.91GB (2.69GB free)|
|Process Argv||
|Screen Reader|no|
|VM|0%|
Extensions (5)
Extension|Author (truncated)|Version
---|---|---
latex-workshop|Jam|6.2.0
svn-scm|joh|1.47.1
python|ms-|2019.2.5558
multi-command|ryu|1.3.0
code-settings-sync|Sha|3.2.7
 bersbersbers
All 26 comments
(Experimental duplicate detection)
Thanks for submitting this issue. Please also check if it is already covered by an existing one, like:
![vscodebot[bot] picture](https://avatars2.githubusercontent.com/in/2406?v=4&s=40) vscodebot[bot]
on 12 Mar 2019
vscodebot[bot]
on 12 Mar 2019
Yes, looks like #69207 is a duplicate of this one, although #69207 does not have specific reproduction steps. This one does.
Also, it looks like they investigated 1.32.0-insider, while I am still seeing this in 1.32.1. Also, I can repro this in the latest insider build with only the Python extension and no settings changed whatsoever (see below). Finally, I must admit finding repro steps was a bit difficult. So I am not fully convinced this issue is fixed, as implied by #69207.
Version: 1.33.0-insider
Commit: 49c10b916705b6006f04d0701875098b26d1d70b
Date: 2019-03-12T06:17:28.991Z
Electron: 3.1.6
Chrome: 66.0.3359.181
Node.js: 10.2.0
V8: 6.6.346.32
OS: Windows_NT x64 10.0.17763
I can not reproduce this.
Can you attach a gif / video showing this
@DonJayamanne can you repro this using python?
 isidorn
on 13 Mar 2019
isidorn
on 13 Mar 2019
Sure, here's a GIF:

bersbersbers
on 13 Mar 2019
I can not reproduce with node.
@DonJayamanne please try reproducing with python
@bersbersbers if you F1 > developer tools > put a breakpoint here what do you see as scrollTop, scrollHeight and renderHeight at the exact moment when the debug console scrolls unexpectedly?
isidorn
on 13 Mar 2019
I encountered exactly the same issue as @bersbersbers.
 razhangwei
on 13 Mar 2019
razhangwei
on 13 Mar 2019
@razhangwei then you can also try to answer the quesionts i asked @bersbersbers . Get your hands dirty and do some debugging. Thanks
isidorn
on 13 Mar 2019
@bersbersbers if you F1 > developer tools > put a breakpoint here what do you see as scrollTop, scrollHeight and renderHeight at the exact moment when the debug console scrolls unexpectedly?
Breakpoint is hit twice per manual sys.exit().
After the first time manually entering sys.exit(), with the breakpoint hit at line 85:
scrollTop = 0, scrollHeight = 19, renderHeight = 214
scrollTop = 0, scrollHeight = 480, renderHeight = 214
After the second time manually entering sys.exit():
scrollTop = 266, scrollHeight = 480, renderHeight = 214
scrollTop = 266, scrollHeight = 80, renderHeight = 214 (+)
After (+), debug console is scrolled to top. I noticed that during (+), the debug console is empty, but not during any of the other breakpoint hits.
I double-checked: 80 is not a typo of 480, the above numbers are correct.
bersbersbers
on 13 Mar 2019
Yes, I too can replicate this issue on my Mac
 DonJayamanne
on 13 Mar 2019
DonJayamanne
on 13 Mar 2019
Ok, thanks for help everybody.
I can repro on my mac. Investigating...
isidorn
on 13 Mar 2019
After investigating and discussion with @joaomoreno we figured out it is a dup of https://github.com/Microsoft/vscode/issues/68385
isidorn
on 13 Mar 2019
Version: 1.34.0-insider
Commit: 750680d2f7ae563529501f8ec419d83ccf8ec325
Date: 2019-04-19T19:59:19.092Z
Electron: 3.1.8
Chrome: 66.0.3359.181
Node.js: 10.2.0
V8: 6.6.346.32
OS: Darwin x64 18.2.0
This issue is not fixed in latest Insider and bugs me every day:
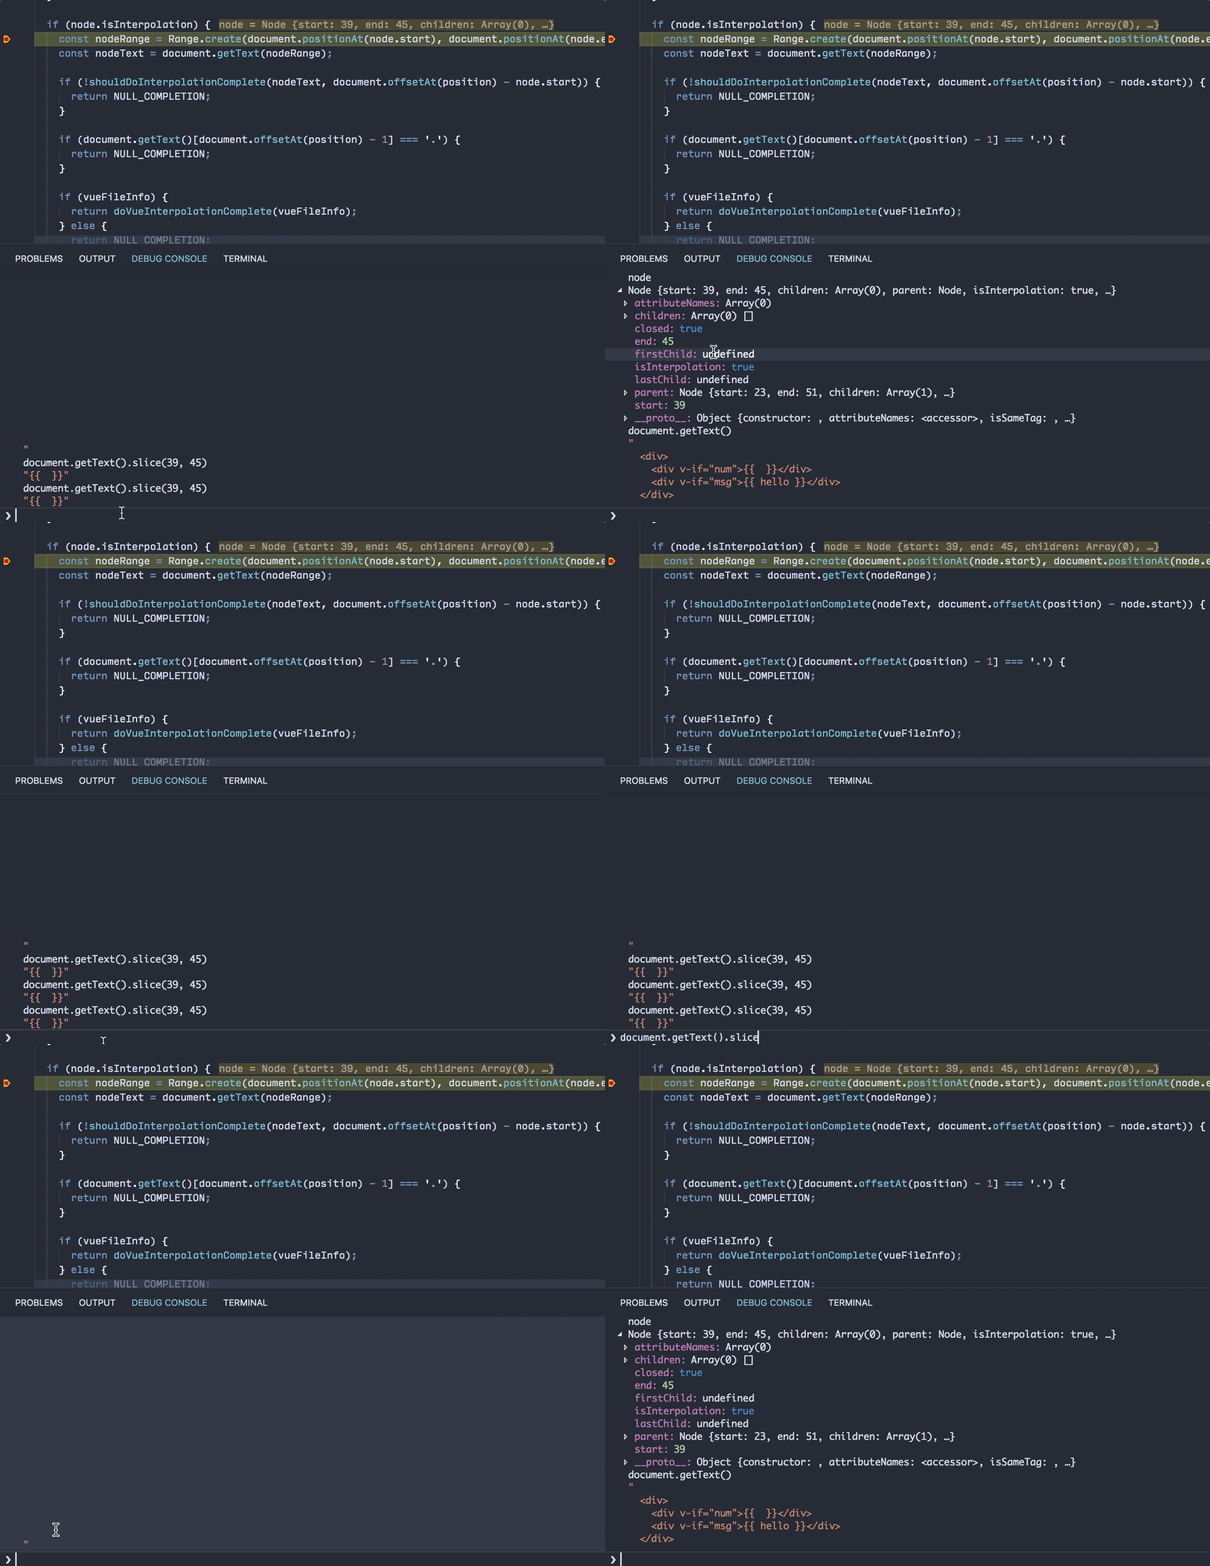
 octref
on 21 Apr 2019
octref
on 21 Apr 2019
I'm facing this since few months now. Any clue on how to avoid this issue?
Please do not keep on closing this issue as it is real.
 pranav08
on 22 Apr 2019
pranav08
on 22 Apr 2019
https://github.com/Microsoft/vscode/issues/71737
Check the insider release and see if it's fixed for you (it was for me). It seems the maintainers have chosen to leave this broken for everyone until their next major release next month which is unfortunate.
 kepeterson
on 22 Apr 2019
kepeterson
on 22 Apr 2019
@kepeterson I'm on Insiders, it's not fixed for me..
Version: 1.34.0-insider
Commit: 750680d
Date: 2019-04-19T19:59:19.092Z
Electron: 3.1.8
Chrome: 66.0.3359.181
Node.js: 10.2.0
V8: 6.6.346.32
OS: Darwin x64 18.2.0
octref
on 23 Apr 2019
I have the same issue.
Version: 1.33.1
Commit: 51b0b28134d51361cf996d2f0a1c698247aeabd8
Date: 2019-04-11T08:20:22.771Z
Electron: 3.1.6
Chrome: 66.0.3359.181
Node.js: 10.2.0
V8: 6.6.346.32
OS: Linux x64 4.15.0-34-generic snap
 alexrada
on 1 May 2019
alexrada
on 1 May 2019
@kepeterson I'm having this issue even on the latest Insiders version (1.34.20-insider)
See gif here :
https://github.com/microsoft/vscode/issues/71737#issuecomment-492986211
 nbara
on 16 May 2019
nbara
on 16 May 2019
Same issue here.
Version: 1.33.1 (system setup)
Commit: 51b0b28134d51361cf996d2f0a1c698247aeabd8
Date: 2019-04-11T08:27:09.080Z
Electron: 3.1.6
Chrome: 66.0.3359.181
Node.js: 10.2.0
V8: 6.6.346.32
OS: Windows_NT ia32 10.0.17134
 wot48
on 17 May 2019
wot48
on 17 May 2019
please do not close this issue. I am experiencing same problem:
VSCode version: 1.33.1
System Software Overview:
  System Version: macOS 10.14.4 (18E226)
  Kernel Version: Darwin 18.5.0
  Boot Volume: Mac OS
  Boot Mode: Normal
  Computer Name: iMac001
  Secure Virtual Memory: Enabled
  System Integrity Protection: Enabled
  Time since boot: 7 days 6 minutes
 nazariydolfin
on 17 May 2019
nazariydolfin
on 17 May 2019
@octref sorry that this is a pain. I am looking into it but can not reproduce.
Can you provide exact steps please?
isidorn
on 24 May 2019
Hi @isidorn, OP here. I can still repro the bug in official 1.34.0, so this is certainly not fixed. However, my repro steps from the original description do not work any longer as running sys.exit() actually ends the process that is debugged. I managed to repro the same issue with throw 1. So these are my current repro steps:
- Save this code as Bug.py:
breakpoint()
print(0)
- Debug
Bug.pyin VS Code - When hitting the breakpoint, run
print(1)in Debug console. - Run
throw 1a bunch of times (1-5 times) in the Debug console. - Notice that at one point, Debug console scrolls up quite a bit
- Scroll to bottom of Debug console output
- Run
print(2)in Debug console. - Notice that you don't see
2due to Debug console scrolling near top again.
Here's a gif as well. (The gif misses step 6, but I think it gets the main issue across.)
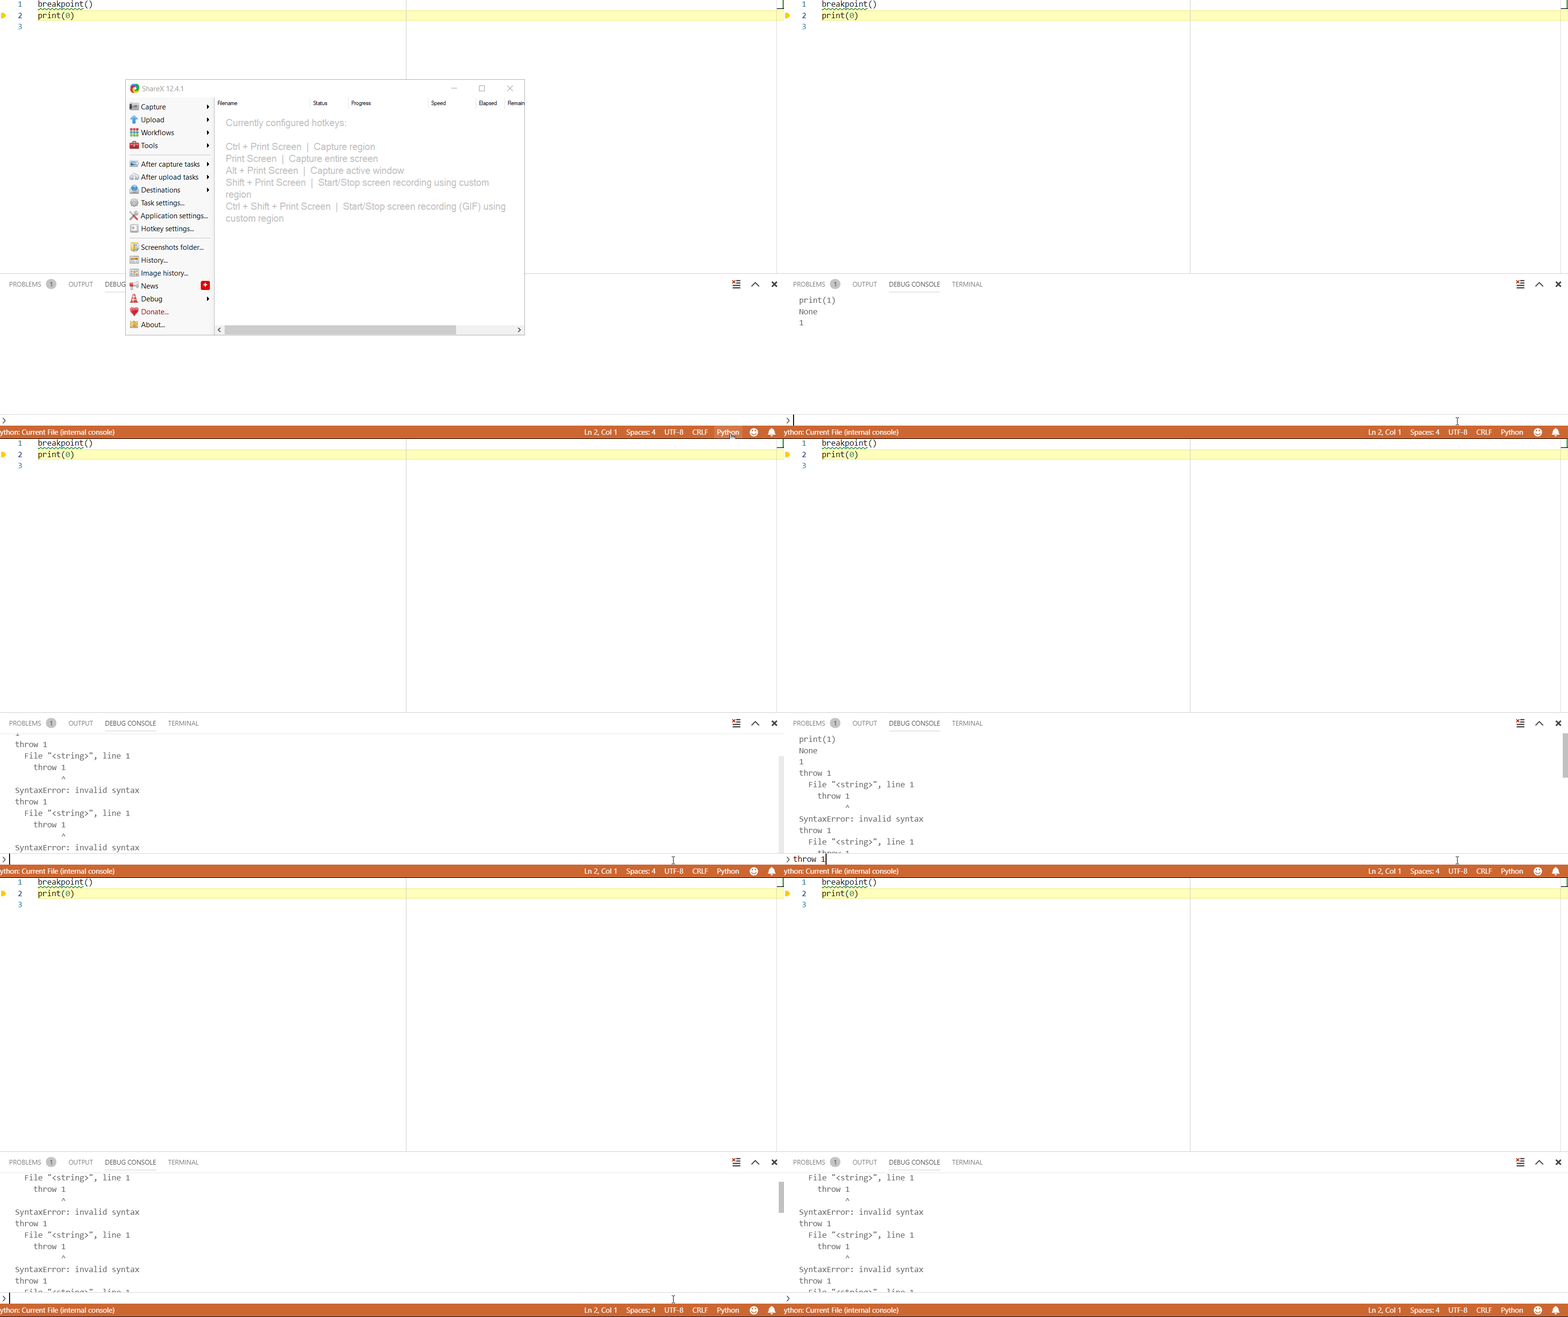
bersbersbers
on 24 May 2019
Thanks for the steps, I will look into this this or next week.
isidorn
on 27 May 2019
@bersbersbers we have pushed a fix with the help of @jeanp413
Please try it with VSCode insiders starting from Tuesday which will have the fix. Thank you
isidorn
on 10 Jun 2019
I have just checked
Version: 1.36.0-insider (user setup)
Commit: e80dd4f217db6e230d311a87fdf4276f740f6445
Date: 2019-06-25T05:19:01.461Z
Electron: 4.2.5
Chrome: 69.0.3497.128
Node.js: 10.11.0
V8: 6.9.427.31-electron.0
OS: Windows_NT x64 10.0.18362
and it seems to me the issue is gone, thank you! (Of course, I will be more confident once an actual release has the fix as I haven't re-setup insiders the exact same way I use my release version - let's hope for the best!)
bersbersbers
on 25 Jun 2019
Thanks. Adding verified label. Let us know how it goes once you get the stable update.
isidorn
on 25 Jun 2019
Stable looks good to me, too, thanks!
bersbersbers
on 3 Jul 2019
Related issues
 ryan-wong
·
3Comments
ryan-wong
·
3Comments
 philipgiuliani
·
3Comments
philipgiuliani
·
3Comments
 trstringer
·
3Comments
trstringer
·
3Comments
 shanalikhan
·
3Comments
shanalikhan
·
3Comments
 NikosEfthias
·
3Comments
NikosEfthias
·
3Comments
Most helpful comment
Ok, thanks for help everybody.
I can repro on my mac. Investigating...