Vscode: Requesting `copy()` command in debug console
Chrome devtools have a nice copy(arg) command which copies the variable arg into clipboard.
Its described here: https://superuser.com/a/792240
I would so nice to have a similar feature in vscode debug console.
Currently this doesn't work:
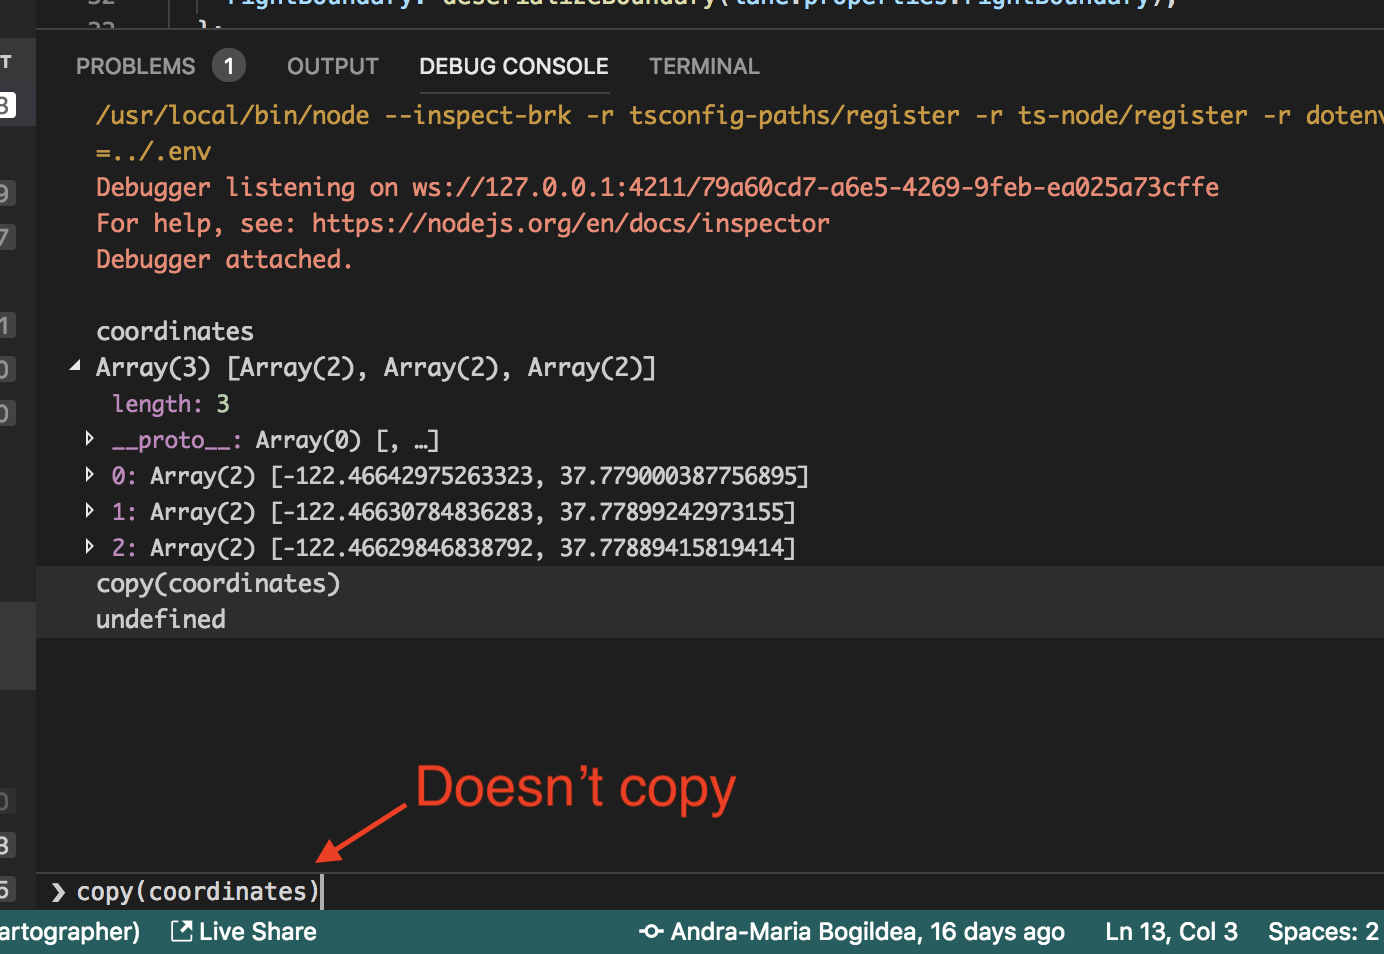
Would love to have this copy() feature in debug console.
 shobhitg
All 22 comments
(Experimental duplicate detection)
Thanks for submitting this issue. Please also check if it is already covered by an existing one, like:
![vscodebot[bot] picture](https://avatars2.githubusercontent.com/in/2406?v=4&s=40) vscodebot[bot]
on 3 Mar 2019
vscodebot[bot]
on 3 Mar 2019
(Experimental duplicate detection)
Thanks for submitting this issue. Please also check if it is already covered by an existing one, like:
This feature request is not a duplicate of the detected duplicate.
The other issue is about copy all text from debug console to clipboard.
This issue is about the copy() utility function which is implemented in Chrome dev tools (https://developers.google.com/web/tools/chrome-devtools/console/utilities#copyobject).
I am requesting it to be in vscode debug console.
shobhitg
on 3 Mar 2019
Came up in discussion with Pine today. Thinking about it some more, I think it would make sense to have this be implemented on the debug adapter side, rather than vscode. For instance, though copy(foo) makes sense for Js, in clojure I might want to have an S-expression (copy foo) instead. Additionally, if the user has a copy variable in their scope, that should take precedence, which the debugger is better suiting for figuring out. Likewise data formatting/stringification may well be different between languages.
I was considering how we might implement this in js-debug. Having a custom event send over DAP and intercepted by the existing to put that string into the clipboard would be the direct, possible-today approach. I don't think it's necessary appropriate for a copy command to be implemented in DAP itself; not all environments have clipboards, and I view it as a UI artifact rather than something instrinsic to a debugger.
 connor4312
on 17 Dec 2019
connor4312
on 17 Dec 2019
@connor4312 good point. As you suggest the debug eadapter could tackle this.
Since this feature request is mostly for node, I will forwarding this issue to you and I suggest to do something like you suggested:
The debug adapter would specially interpreet the copy() evaluation which has the context repl. Then the debug adapter can use some node module to write the appropriate data to the clipboard.
Some node modules which might be useful:
https://www.npmjs.com/package/copy-to-clipboard
https://www.npmjs.com/package/copy-text-to-clipboard
fyi @roblourens @weinand
 isidorn
on 17 Dec 2019
isidorn
on 17 Dec 2019
It doesn't make sense to have the DA directly copy to the clipboard because the DA might run remotely (where no clipboard exists).
I suggest this approach: the DA detects the "copy(...)" as part of the "evaluate" request and sends an DAP "output" event of a new category "clipboard" back to VS Code, which puts the payload from the output event into the clipboard.
@connor4312 @roblourens @isidorn does this make sense?
If yes, I will create a new a new issue for the DAP protocol addition.
 weinand
on 17 Dec 2019
weinand
on 17 Dec 2019
That works for me and sounds reasonable.
isidorn
on 17 Dec 2019
A clipboard category for output sounds great 👍
connor4312
on 17 Dec 2019
We now have a clipboard category and adopted this a while ago in js-debug. However I don't think this feature was ever 'verified' (it was initially implemented when js-debug was vscode-pwa) so I'll have this in the sept milestone.
@shobhitg copy() now works in the latest VS Code versions.
connor4312
on 8 Sep 2020
@connor4312 I am on latest stable vscode (Version: 1.48.2) but copy still doesn't work for me in debug console. Is it only available on insider?
 mikaoelitiana
on 9 Sep 2020
mikaoelitiana
on 9 Sep 2020
It's available everywhere. Are you debugging JavaScript and using the new debugger? (debug.javascript.usePreview: true)
connor4312
on 9 Sep 2020
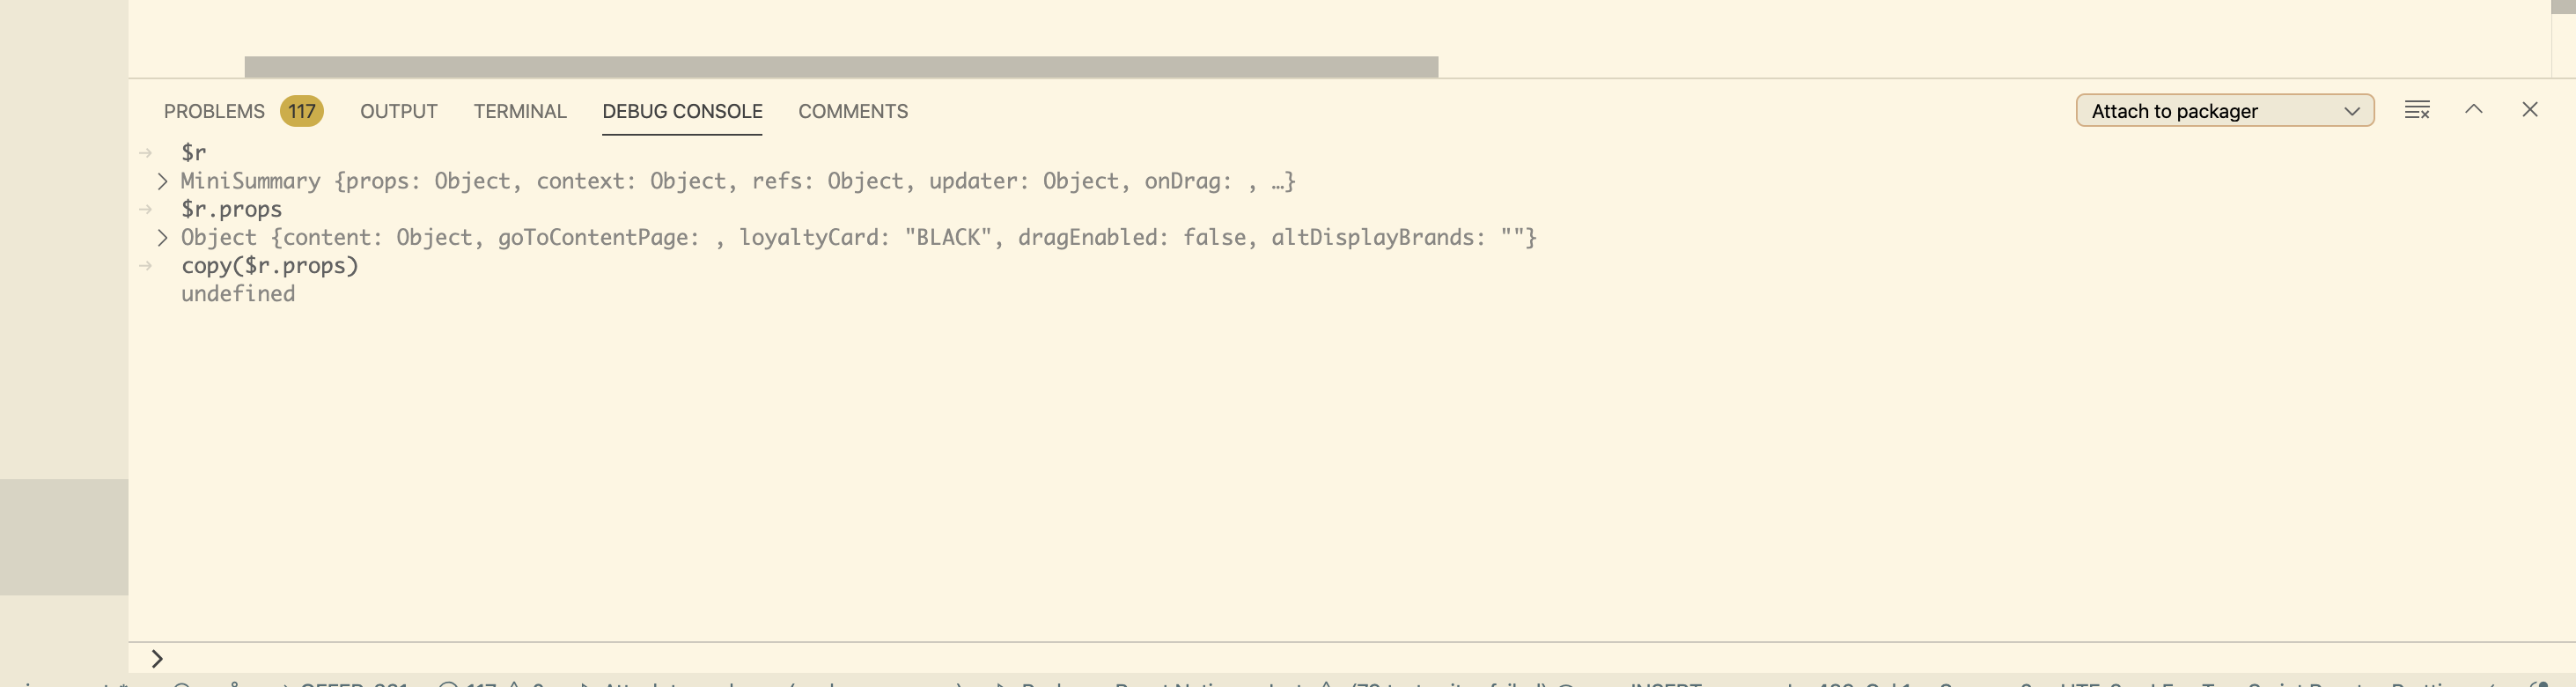
In my case I am attaching the debugger to React Native packager and I try to use copy() in the Debug Console.
mikaoelitiana
on 9 Sep 2020
That looks okay -- no output is expected from the copy command. The contents should then be placed on your clipboard.
However I know react native is a weird environment which we don't directly support, there might be something things that don't work there...
connor4312
on 9 Sep 2020
Yes I guess this is something related to React Native debugging because the clipboard does not change at all.
mikaoelitiana
on 9 Sep 2020
Can you create an issue here and share the log file using instructions in the bug template? That should let me verify what's happening for you: https://github.com/microsoft/vscode-js-debug/issues/new/choose
connor4312
on 9 Sep 2020
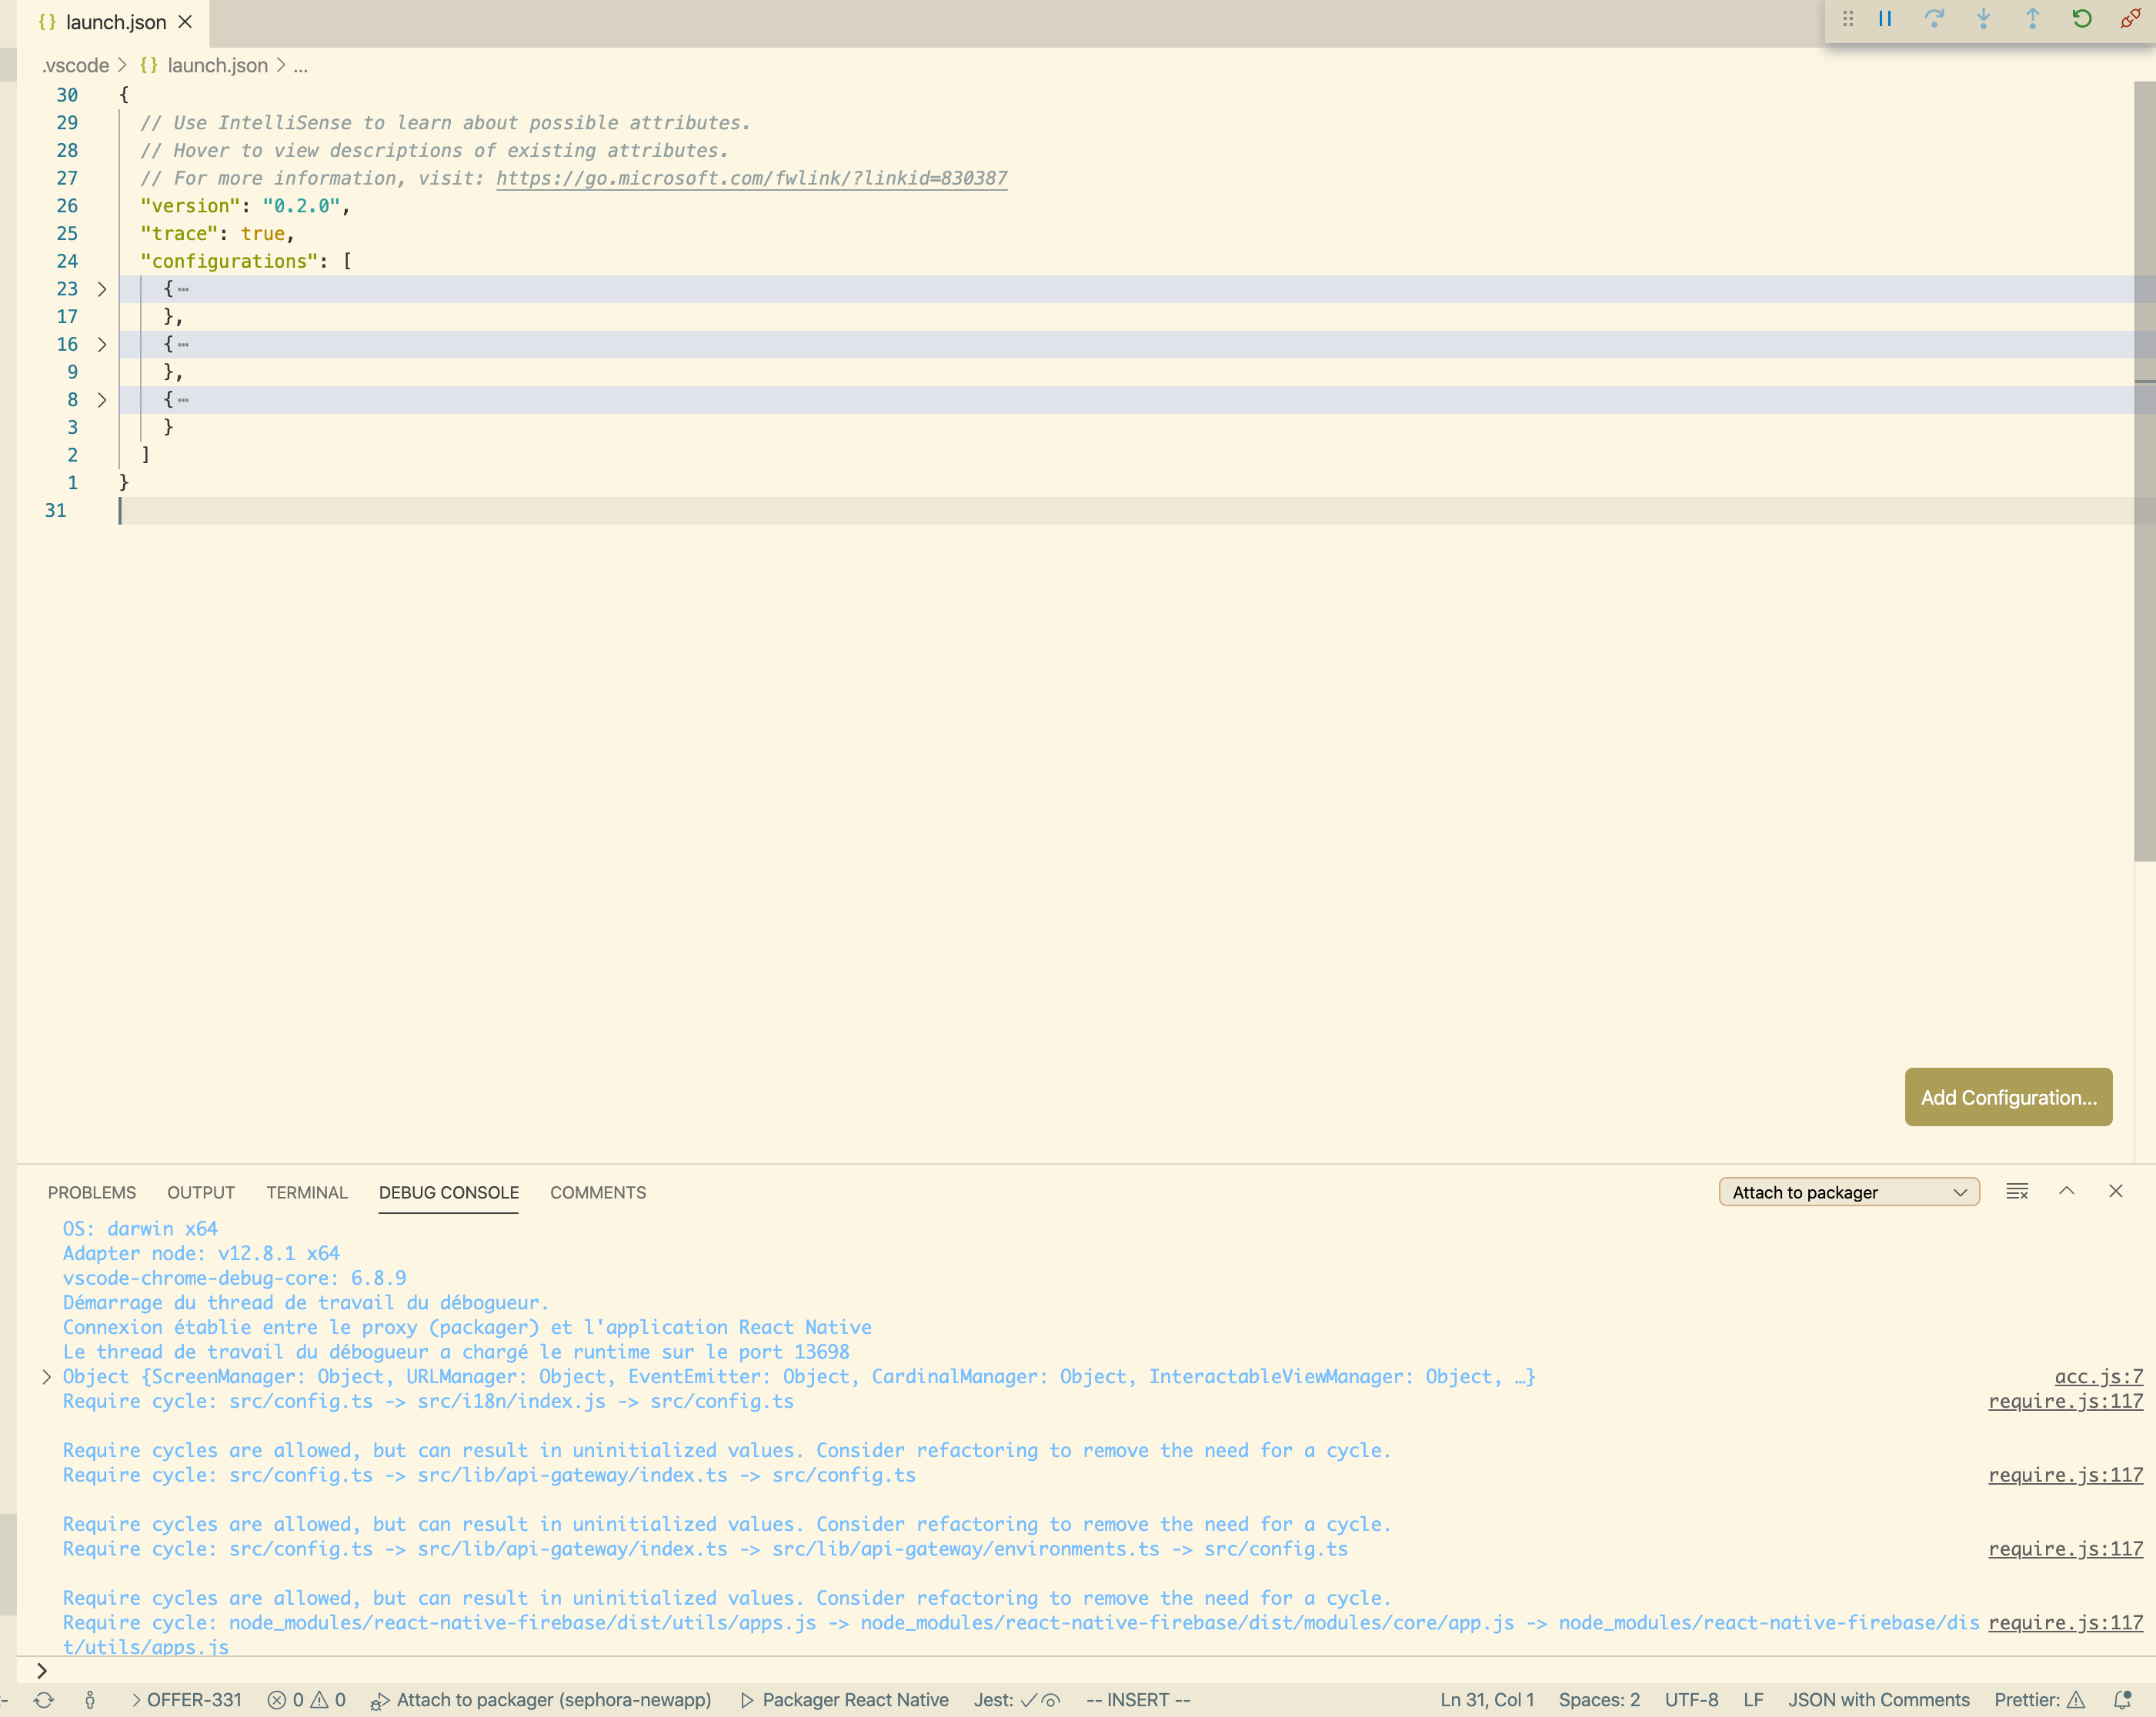
Unfortunately, the location of the log file is not displayed in Debug Console and I can't find it
mikaoelitiana
on 9 Sep 2020
What's your launch configuration?
connor4312
on 9 Sep 2020
Here is my lauch file content :
{
  // Use IntelliSense to learn about possible attributes.
  // Hover to view descriptions of existing attributes.
  // For more information, visit: https://go.microsoft.com/fwlink/?linkid=830387
  "version": "0.2.0",
  "trace": true,
  "configurations": [
    {
      "name": "Debug Android",
      "cwd": "${workspaceFolder}",
      "type": "reactnative",
      "request": "launch",
      "platform": "android"
    },
    {
      "name": "Debug iOS",
      "cwd": "${workspaceFolder}",
      "type": "reactnative",
      "request": "launch",
      "platform": "ios"
    },
    {
      "name": "Attach to packager",
      "cwd": "${workspaceFolder}",
      "type": "reactnative",
      "request": "attach",
    }
  ]
}
Ah, okay. You're using the reactnative debugger, I'm guessing they don't have support for it yet.
VS Code now has all the tools debuggers need to implement copy(), but it's up to the debugger to actually do it.
connor4312
on 10 Sep 2020
thanks @connor4312
mikaoelitiana
on 10 Sep 2020
Verifier: follow the steps in the inital comment, and make sure that copy() in the debug console copies content to the clipboard
isidorn
on 29 Sep 2020
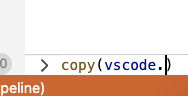
Verified with extension development, I am not getting intellisense here though:
 bpasero
on 30 Sep 2020
bpasero
on 30 Sep 2020
Yeah we do some hacks to get the inteli-sense working in the debug input, and if you have a trailing character things break down a bit...
isidorn
on 30 Sep 2020
Related issues
 omidgolparvar
·
3Comments
omidgolparvar
·
3Comments
 lukehoban
·
3Comments
lukehoban
·
3Comments
 philipgiuliani
·
3Comments
philipgiuliani
·
3Comments
 DovydasNavickas
·
3Comments
DovydasNavickas
·
3Comments
 v-pavanp
·
3Comments
v-pavanp
·
3Comments
Most helpful comment
This feature request is not a duplicate of the detected duplicate.
The other issue is about
copy alltext from debug console to clipboard.This issue is about the
copy()utility function which is implemented in Chrome dev tools (https://developers.google.com/web/tools/chrome-devtools/console/utilities#copyobject).I am requesting it to be in vscode debug console.