Issue Type: Bug
If I launch VS Code and use "Open Folder" on a certain project's folder then VS Code repeatedly and indefinitely spawns a child WMI process very ~1 second that eats up a lot of CPU. The query it runs is "wmic process get CommandLine,CreationDate,ParentProcessId,ProcessId".
I tried to track it down myself to no avail. I've tried --disable-extensions as well as -n, same issue.
Can't see what's special about the project either (Not using autoAttachChildProcesses).
Any idea what could be causing this?
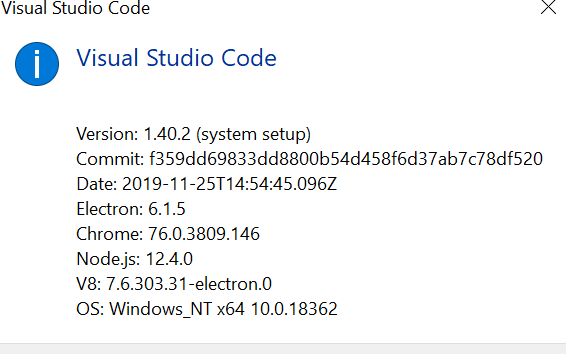
VS Code version: Code 1.27.2 (f46c4c469d6e6d8c46f268d1553c5dc4b475840f, 2018-09-12T16:17:45.060Z)
OS version: Windows_NT x64 10.0.17134
All 18 comments
Do you still get the issue on 1.28.0?
Sorry I didn't realize there was a never version! I just updated to 1.28.0 and unfortunately the issue still occurs.
Can you follow this wiki and post the results back here to understand more about why performance is so bad for you: https://github.com/Microsoft/vscode/wiki/Performance-Issues
Thanks!
I've read through the linked Wiki and I'm a bit unsure as to some of the steps for this particular issue.
If you look at the status dump below you'll see the wmic instance launched as a child of the extensionHost process, and not by a particular extension process (right?).
I don't think profiling extensions would reveal much of value, considering the actual VS Code instance is not actually consuming that many resources. It's purely wmic.exe that eats up my CPU. Been searching and searching but can't actually find anywhere where VS Code would invoke wmic.exe with these parameters.
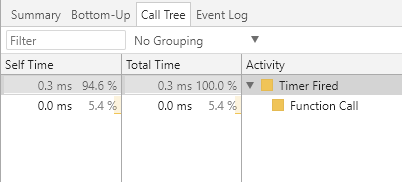
I ran a performance session in Chrome Developer Tools to see if I could find the originator of this call, but all I could see was this: Some timer running on an interval (which seem to correspond to the invocations of wmic). Nothing else seems to be doing any processing at all.

Not sure what else I can do to help, but I'm happy to do more investigation given some pointers.
C:\>code --status


Version:          Code 1.28.0 (431ef9da3cf88a7e164f9d33bf62695e07c6c2a9, 2018-10-05T14:58:53.203Z)
OS Version:       Windows_NT x64 10.0.17134
CPUs:             Intel(R) Core(TM) i7-6820HQ CPU @ 2.70GHz (8 x 2712)
Memory (System):  15.56GB (5.47GB free)
VM:               0%
Screen Reader:    no
Process Argv:     --disable-extensions --verbose
GPU Status:       2d_canvas:                    enabled
                  checker_imaging:              disabled_off
                  flash_3d:                     enabled
                  flash_stage3d:                enabled
                  flash_stage3d_baseline:       enabled
                  gpu_compositing:              enabled
                  multiple_raster_threads:      enabled_on
                  native_gpu_memory_buffers:    disabled_software
                  rasterization:                enabled
                  video_decode:                 enabled
                  video_encode:                 enabled
                  webgl:                        enabled
                  webgl2:                       enabled
CPU %   Mem MB     PID  Process
    0       88   20040  code main
    0      102   13040     gpu-process
    0      160   19968     window (deployer - Visual Studio Code)
    0        6   11284       winpty-process
    0       62   14612         C:\Windows\System32\WindowsPowerShell\v1.0\powershell.exe
    0        9   24740         console-window-host (Windows internal process)
    0       13   16760       electron-crash-reporter
    0       11   25076       watcherService
    0       10   20524         console-window-host (Windows internal process)
    0       65   30528       extensionHost
    0       38    3100         "C:\Users\simongustavsson\AppData\Local\Programs\Microsoft VS Code\Code.exe" "c:\Users\simongustavsson\AppData\Local\Programs\Microsoft VS Code\resources\app\extensions\json-language-features\server\dist\jsonServerMain" --node-ipc --clientProcessId=30528
    0       19   27108         C:\Windows\System32\wbem\WMIC.exe process get CommandLine,CreationDate,ParentProcessId,ProcessId
    0       10   28468           console-window-host (Windows internal process)
    0       67   25200     shared-process

Workspace Stats:
|  Window (deployer - Visual Studio Code)
|    Folder (deployer): 102 files
|      File types: yaml(25) json(14) ts(9) js(8) map(8) cs(5) cache(5) cmd(2)
|                  ps1(2) gitignore(1)
|      Conf files: package.json(1) tslint.json(1) launch.json(1)
|                  settings.json(1) tasks.json(1) tsconfig.json(1) csproj(1)
|      Launch Configs: node(2)
@SimonGustavsson actually I think you already gave a good hint: The query it runs is "wmic process get CommandLine,CreationDate,ParentProcessId,ProcessId".
This sounds diagnostics related. Moving to @RMacfarlane
A coworker of mine discovered that we had the workspace setting "debug.node.autoAttach" set to true.
Setting this to either "off" or "disabled" stops the wmic.exe "spam".
I tracked it down to here: https://github.com/Microsoft/vscode-node-debug/blob/493460bf3a96f31887f35dc5fd52a092bc04a670/src/node/extension/processTree.ts#L76
Which is called repeatedly within a setTimeout with a timeout of 1000 here: https://github.com/Microsoft/vscode-node-debug/blob/master/src/node/extension/autoAttach.ts#L148
Interesting that I even ran into this issue because that extension's README says
Node debug (legacy) is the debugger for Node.js versions < 8.0.
I'm using Node.js v10.9.0.
Not sure if you'd like me to just close this issue and create an issue in that repository instead.
Please advice. :-)
@weinand Can you take a look at this since this is from the autoAttach feature? The Process Explorer and other diagnostic code is now using the windows-process-tree module instead of wmic
@RMacfarlane yes, "wmic" is used for the "auto-attach" feature. Since this feature is implemented in an extension, it cannot use the "windows-process-tree" module because that uses native code.
@SimonGustavsson So the workaround is: turn auto-attach off if it results in lots of CPU load. In general the "wmic" call does not produce significant load. But a few users see a lot of load for unknown reasons.
@weinand What if we need auto-attach ? Is there a plan to fix this ? I would be more than happy to provide insights if needed.
In my case, it eats up 100% of one core during ~1s CPU each 2 seconds when using auto-attach.
FYI i also experienced something that seems very similar to #45320 (a reboot fixed the issue).
I also have similar problem. After disable all installed extension, code --status returns following info:
C:\>code --status

Version:          Code 1.33.1 (51b0b28134d51361cf996d2f0a1c698247aeabd8, 2019-04-11T08:27:14.102Z)
OS Version:       Windows_NT x64 10.0.17134
CPUs:             Intel(R) Core(TM) i7-4771 CPU @ 3.50GHz (8 x 3492)
Memory (System):  11.87GB (2.11GB free)
VM:               0%
Screen Reader:    no
Process Argv:
GPU Status:       2d_canvas:                    enabled
                  checker_imaging:              disabled_off
                  flash_3d:                     enabled
                  flash_stage3d:                enabled
                  flash_stage3d_baseline:       enabled
                  gpu_compositing:              enabled
                  multiple_raster_threads:      enabled_on
                  native_gpu_memory_buffers:    disabled_software
                  rasterization:                enabled
                  surface_synchronization:      enabled_on
                  video_decode:                 enabled
                  webgl:                        enabled
                  webgl2:                       enabled

CPU %   Mem MB     PID  Process
    0       88   13076  code main
    0       70   22180     gpu-process
    0      123   23760     window (Welcome - Visual Studio Code)
    0       61    8500       extensionHost
    1       28   24336         C:\WINDOWS\System32\wbem\WMIC.exe process get CommandLine,CreationDate,ParentProcessId,ProcessId
    0       10   24400           console-window-host (Windows internal process)
    0       13   16544       electron-crash-reporter
    0       65   24416     shared-process
@SimonGustavsson Thank you so much (and thank your coworker), you saved me from hours of continued frustration with "WMIC.exe" and high CPU consumption. I indeed, had recently changed that debug setting to true, resulting in this, and failing to pinpoint the source:

Changing that setting to "off" and the WMIC.exe process is gone, finally.
You now have a permanent line in my settings file! 😉
// 'Setting this to either "off" or "disabled" stops the wmic.exe "spam"'
//  and high CPU usage when this is "true". (thx2 @SimonGustavsson)
// "debug.node.autoAttach" set to true.
any updates?
Same issue. Thanks for the tip. Still would be good with a fix.
I just fixed my WMIC issue by turning of auto attach with the following versions (thx for the tip)

Disabling the node auto attach worked for me as well after about a week of trouble. The issue may have started for me when I installed nvm and started switching node versions a while back. I've been running node 12.13.1 and was having nearly constant 100% CPU usage merely opening vscode before even running any node processes. I almost switched to VIM. So glad for this github issue that saved me.
Disabling the node auto attach worked for me as well after about a week of trouble. The issue may have started for me when I installed nvm and started switching node versions a while back. I've been running node 12.13.1 and was having nearly constant 100% CPU usage merely opening vscode before even running any node processes. I almost switched to VIM. So glad for this github issue that saved me.
Oh wow, I've been lamenting for the past few weeks how my laptop has _constant_ fan when it's plugged in and a VS Code instance is running. Unplug the laptop --> fan near-instantly off. I've been using my plugged-in laptop (doing nothing in VS Code, but it was open-launched) for the past hour and the fan has been on the whole time. I just pressed _Auto Attach_ in the status bar (toggled it to _Off_) fan stopped in <10 seconds!
(In the past weeks I tried modifying my laptop's plugged-in power settings to be like the battery settings, but that never seemed to help with reducing the fan while it was plugged in).
I have been experiencing very high cpu usage due to this issue as well. Is there any plan to fix this?
If you are using VS Code's new JS debugger, it is already fixed.
Please see: https://code.visualstudio.com/updates/v1_46#_new-javascript-debugger
Most helpful comment
A coworker of mine discovered that we had the workspace setting "debug.node.autoAttach" set to true.
Setting this to either "off" or "disabled" stops the wmic.exe "spam".
I tracked it down to here: https://github.com/Microsoft/vscode-node-debug/blob/493460bf3a96f31887f35dc5fd52a092bc04a670/src/node/extension/processTree.ts#L76
Which is called repeatedly within a setTimeout with a timeout of 1000 here: https://github.com/Microsoft/vscode-node-debug/blob/master/src/node/extension/autoAttach.ts#L148
Interesting that I even ran into this issue because that extension's README says
I'm using Node.js v10.9.0.
Not sure if you'd like me to just close this issue and create an issue in that repository instead.
Please advice. :-)