Vscode: [windows] Slow opening (vscode, file, folder...)
Issue Type: Performance Issue
Hi,
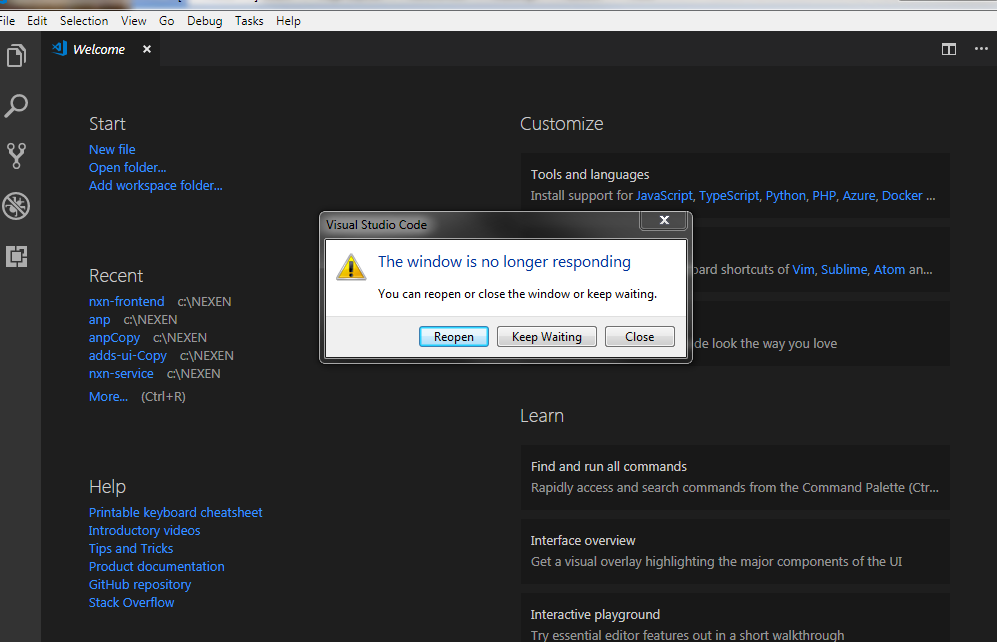
Since the last july update and the switch to the user version (vs. all users version) of vscode, everything is slow. Vscode takes like 20 seconds to open and then when I click on a file it takes another 10 seconds to open it.
I tried to disable all extensions, nothing changed.
The problem came right after I downloaded the "user version" of vscode. Before that, I had the "all users version" installed and everything was ok. Maybe it's because I'm on an entreprise computer linked to a windows domain and our user PATH is special and located on a network drive.
Thanks in advance for your help !
Regards
Clément
VS Code version: Code 1.26.0 (4e9361845dc28659923a300945f84731393e210d, 2018-08-13T16:29:31.933Z)
OS version: Windows_NT x64 10.0.16299
System Info
|Item|Value|
|---|---|
|CPUs|Intel(R) Core(TM) i7-4800MQ CPU @ 2.70GHz (8 x 2694)|
|GPU Status|2d_canvas: enabled
checker_imaging: disabled_off
flash_3d: enabled
flash_stage3d: enabled
flash_stage3d_baseline: enabled
gpu_compositing: enabled
multiple_raster_threads: enabled_on
native_gpu_memory_buffers: disabled_software
rasterization: unavailable_software
video_decode: enabled
video_encode: enabled
webgl: enabled
webgl2: unavailable_off|
|Memory (System)|7.91GB (0.76GB free)|
|Process Argv|C:\Users\clement.boillat\AppData\Local\Programs\Microsoft VS Code\Code.exe --prof-startup|
|Screen Reader|no|
|VM|0%|
Process Info
CPU %   Mem MB     PID  Process
    0      119   15100  code main
    1       64    1360     window (Issue Reporter)
    0      134    5676     shared-process
    0      157   13184     window (Untitled-1)
    0      152   13748       extensionHost
    0       38   16416       searchService
    0       16   18372       electron-crash-reporter
    0      145   13336     gpu-process
    0       25   14028     utility
Workspace Info
;
Extensions (21)
Extension|Author (truncated)|Version
---|---|---
vscode-color|ans|0.4.5
path-intellisense|chr|1.4.2
open-html-in-browser|cod|0.1.21
bracket-pair-colorizer|Coe|1.0.59
vscode-eslint|dba|1.4.12
vscode-html-css|ecm|0.2.0
vsc-material-theme|Equ|2.3.0
prettier-vscode|esb|1.6.1
beautify|Hoo|1.3.2
smarty|imp|0.3.0
sftp|lix|1.3.9
prettify-json|moh|0.0.3
vscode-apache|mrm|1.1.1
sublime-keybindings|ms-|4.0.0
color-highlight|nau|2.3.0
vetur|oct|0.12.6
code-settings-sync|Sha|3.0.0
trailing-spaces|sha|0.2.11
stylelint|shi|0.39.0
quokka-vscode|Wal|1.0.137
html-css-class-completion|Zig|1.17.1
 cboillat
All 95 comments
Please follow this guide to track down what's slow https://github.com/Microsoft/vscode/wiki/Performance-Issues
 sandy081
on 17 Aug 2018
sandy081
on 17 Aug 2018
I did follow this guide, that why I ended opening an issue here.
I've disabled all extensions, I'v emptied my user settings ({}), my workspace contains only 1 file.
The devtools console says only :
INFO no standard startup: panel is active
Here is my code --status log :
Version: Code 1.26.0 (4e9361845dc28659923a300945f84731393e210d, 2018-08-13T16:29:31.933Z)
OS Version: Windows_NT x64 10.0.16299
CPUs: Intel(R) Core(TM) i7-4800MQ CPU @ 2.70GHz (8 x 2694)
Memory (System): 7.91GB (1.07GB free)
VM: 0%
Screen Reader: no
Process Argv: C:\Users\clement.boillat\AppData\Local\Programs\Microsoft VS Code\Code.exe
GPU Status: 2d_canvas: enabled
checker_imaging: disabled_off
flash_3d: enabled
flash_stage3d: enabled
flash_stage3d_baseline: enabled
gpu_compositing: enabled
multiple_raster_threads: enabled_on
native_gpu_memory_buffers: disabled_software
rasterization: unavailable_software
video_decode: enabled
video_encode: enabled
webgl: enabled
webgl2: unavailable_off
CPU % Mem MB PID Process
0 83 5752 code main
0 192 12796 gpu-process
0 164 14792 window (Untitled-1 - Visual Studio Code)
0 39 1476 searchService
0 6 7336 winpty-process
0 8 5980 console-window-host (Windows internal process)
0 60 14156 C:\WINDOWS\System32\WindowsPowerShell\v1.0\powershell.exe
0 4 15416 C:\WINDOWS\system32\cmd.exe /c ""C:\Users\clement.boillat\AppData\Local\Programs\Microsoft VS Code\bincode.cmd" --status"
0 38 6192 electron_node cli.js
0 56 3180 "C:\Users\clement.boillat\AppData\Local\Programs\Microsoft VS Code\Code.exe" --status
0 11 15724 gpu-process
0 120 9056 extensionHost
0 16 12396 electron-crash-reporter
0 134 16064 shared-process
0 25 18232 utility
[3180:0817/101846.111:ERROR:browser_gpu_channel_host_factory.cc(103)] Failed to launch GPU process.
The code --prof-startup gives me this :
code --prof-startup[ [ { Error: connect ECONNREFUSED 127.0.0.1:9223
at Object._errnoException (util.js:1024:11)
at _exceptionWithHostPort (util.js:1046:20)
at TCPConnectWrap.afterConnect [as oncomplete] (net.js:1182:14)
code: 'ECONNREFUSED',
errno: 'ECONNREFUSED',
syscall: 'connect',
address: '127.0.0.1',
port: 9223 },
{ Error: connect ECONNREFUSED 127.0.0.1:9223
at Object._errnoException (util.js:1024:11)
at _exceptionWithHostPort (util.js:1046:20)
at TCPConnectWrap.afterConnect [as oncomplete] (net.js:1182:14)
code: 'ECONNREFUSED',
errno: 'ECONNREFUSED',
syscall: 'connect',
address: '127.0.0.1',
port: 9223 },
{ Error: connect ECONNREFUSED 127.0.0.1:9223
at Object._errnoException (util.js:1024:11)
at _exceptionWithHostPort (util.js:1046:20)
at TCPConnectWrap.afterConnect [as oncomplete] (net.js:1182:14)
code: 'ECONNREFUSED',
errno: 'ECONNREFUSED',
syscall: 'connect',
address: '127.0.0.1',
port: 9223 },
{ Error: connect ECONNREFUSED 127.0.0.1:9223
at Object._errnoException (util.js:1024:11)
at _exceptionWithHostPort (util.js:1046:20)
at TCPConnectWrap.afterConnect [as oncomplete] (net.js:1182:14)
code: 'ECONNREFUSED',
errno: 'ECONNREFUSED',
syscall: 'connect',
address: '127.0.0.1',
port: 9223 },
{ Error: connect ECONNREFUSED 127.0.0.1:9223
at Object._errnoException (util.js:1024:11)
at _exceptionWithHostPort (util.js:1046:20)
at TCPConnectWrap.afterConnect [as oncomplete] (net.js:1182:14)
code: 'ECONNREFUSED',
errno: 'ECONNREFUSED',
syscall: 'connect',
address: '127.0.0.1',
port: 9223 },
{ Error: connect ECONNREFUSED 127.0.0.1:9223
at Object._errnoException (util.js:1024:11)
at _exceptionWithHostPort (util.js:1046:20)
at TCPConnectWrap.afterConnect [as oncomplete] (net.js:1182:14)
code: 'ECONNREFUSED',
errno: 'ECONNREFUSED',
syscall: 'connect',
address: '127.0.0.1',
port: 9223 },
{ Error: connect ECONNREFUSED 127.0.0.1:9223
at Object._errnoException (util.js:1024:11)
at _exceptionWithHostPort (util.js:1046:20)
at TCPConnectWrap.afterConnect [as oncomplete] (net.js:1182:14)
code: 'ECONNREFUSED',
errno: 'ECONNREFUSED',
syscall: 'connect',
address: '127.0.0.1',
port: 9223 },
{ Error: connect ECONNREFUSED 127.0.0.1:9223
at Object._errnoException (util.js:1024:11)
at _exceptionWithHostPort (util.js:1046:20)
at TCPConnectWrap.afterConnect [as oncomplete] (net.js:1182:14)
code: 'ECONNREFUSED',
errno: 'ECONNREFUSED',
syscall: 'connect',
address: '127.0.0.1',
port: 9223 },
{ Error: connect ECONNREFUSED 127.0.0.1:9223
at Object._errnoException (util.js:1024:11)
at _exceptionWithHostPort (util.js:1046:20)
at TCPConnectWrap.afterConnect [as oncomplete] (net.js:1182:14)
code: 'ECONNREFUSED',
errno: 'ECONNREFUSED',
syscall: 'connect',
address: '127.0.0.1',
port: 9223 },
{ Error: connect ECONNREFUSED 127.0.0.1:9223
at Object._errnoException (util.js:1024:11)
at _exceptionWithHostPort (util.js:1046:20)
at TCPConnectWrap.afterConnect [as oncomplete] (net.js:1182:14)
code: 'ECONNREFUSED',
errno: 'ECONNREFUSED',
syscall: 'connect',
address: '127.0.0.1',
port: 9223 } ] ]
Finally, you can also find attached my JavaScript Profiler file (during a "F1>Reload Window") :
CPU-20180817T102315.cpuprofile.txt
cboillat
on 17 Aug 2018
I've experienced the same issue. Upgraded on two machines - 1) Windows 10 Enterprise 64-bit, 2) Windows 2008 R2 64-bit. Problem appeared when upgrading to 1.26.1 (July?). I've uninstalled and gone back to an earlier version as it's taking about 19 seconds before the main window appears then about another 10-15 seconds before the application loads the files/folders.
I tried both User and "All" versions and it appears in both, since I first noticed when upgrading to the User version.
 AndySteel-kcom
on 17 Aug 2018
AndySteel-kcom
on 17 Aug 2018
@AndySteel-kcom thank you for your feedback !
Same here, I tried to switch back to "All" version but it does not change. Both versions are slow. But I also first noticed after upgrading to the User version.
cboillat
on 17 Aug 2018
My output from Windows 10 Enterprise (not VM)
log.ts:159 INFO No grammar found for scope text.html.javadoc
C:\Program Files\Microsoft VS Code\resources\appnode_modules.asarvscode-textmate\release\main.js:2883 [2] - Grammar is in an endless loop - Grammar pushed the same rule without advancing
scanNext @ C:\Program Files\Microsoft VS Code\resources\appnode_modules.asarvscode-textmate\release\main.js:2883
C:\Program Files\Microsoft VS Code\resources\appnode_modules.asarvscode-textmate\release\main.js:2883 [2] - Grammar is in an endless loop - Grammar pushed the same rule without advancing
scanNext @ C:\Program Files\Microsoft VS Code\resources\appnode_modules.asarvscode-textmate\release\main.js:2883
C:\Program Files\Microsoft VS Code\resources\appnode_modules.asarvscode-textmate\release\main.js:2883 [2] - Grammar is in an endless loop - Grammar pushed the same rule without advancing
scanNext @ C:\Program Files\Microsoft VS Code\resources\appnode_modules.asarvscode-textmate\release\main.js:2883
C:\Program Files\Microsoft VS Code\resources\appnode_modules.asarvscode-textmate\release\main.js:2883 [2] - Grammar is in an endless loop - Grammar pushed the same rule without advancing
scanNext @ C:\Program Files\Microsoft VS Code\resources\appnode_modules.asarvscode-textmate\release\main.js:2883
C:\Program Files\Microsoft VS Code\resources\appnode_modules.asarvscode-textmate\release\main.js:2883 [2] - Grammar is in an endless loop - Grammar pushed the same rule without advancing
scanNext @ C:\Program Files\Microsoft VS Code\resources\appnode_modules.asarvscode-textmate\release\main.js:2883
C:\Program Files\Microsoft VS Code\resources\appnode_modules.asarvscode-textmate\release\main.js:2883 [2] - Grammar is in an endless loop - Grammar pushed the same rule without advancing
scanNext @ C:\Program Files\Microsoft VS Code\resources\appnode_modules.asarvscode-textmate\release\main.js:2883
C:\Program Files\Microsoft VS Code\resources\appnode_modules.asarvscode-textmate\release\main.js:2883 [2] - Grammar is in an endless loop - Grammar pushed the same rule without advancing
scanNext @ C:\Program Files\Microsoft VS Code\resources\appnode_modules.asarvscode-textmate\release\main.js:2883
C:\Program Files\Microsoft VS Code\resources\appnode_modules.asarvscode-textmate\release\main.js:2883 [2] - Grammar is in an endless loop - Grammar pushed the same rule without advancing
scanNext @ C:\Program Files\Microsoft VS Code\resources\appnode_modules.asarvscode-textmate\release\main.js:2883
C:\Program Files\Microsoft VS Code\resources\appnode_modules.asarvscode-textmate\release\main.js:2883 [2] - Grammar is in an endless loop - Grammar pushed the same rule without advancing
scanNext @ C:\Program Files\Microsoft VS Code\resources\appnode_modules.asarvscode-textmate\release\main.js:2883
C:\Program Files\Microsoft VS Code\resources\appnode_modules.asarvscode-textmate\release\main.js:2883 [2] - Grammar is in an endless loop - Grammar pushed the same rule without advancing
scanNext @ C:\Program Files\Microsoft VS Code\resources\appnode_modules.asarvscode-textmate\release\main.js:2883
C:\Program Files\Microsoft VS Code\resources\appnode_modules.asarvscode-textmate\release\main.js:2883 [2] - Grammar is in an endless loop - Grammar pushed the same rule without advancing
scanNext @ C:\Program Files\Microsoft VS Code\resources\appnode_modules.asarvscode-textmate\release\main.js:2883
C:\Program Files\Microsoft VS Code\resources\appnode_modules.asarvscode-textmate\release\main.js:2883 [2] - Grammar is in an endless loop - Grammar pushed the same rule without advancing
scanNext @ C:\Program Files\Microsoft VS Code\resources\appnode_modules.asarvscode-textmate\release\main.js:2883
C:\Program Files\Microsoft VS Code\resources\appnode_modules.asarvscode-textmate\release\main.js:2883 [2] - Grammar is in an endless loop - Grammar pushed the same rule without advancing
scanNext @ C:\Program Files\Microsoft VS Code\resources\appnode_modules.asarvscode-textmate\release\main.js:2883
C:\Program Files\Microsoft VS Code\resources\appnode_modules.asarvscode-textmate\release\main.js:2883 [2] - Grammar is in an endless loop - Grammar pushed the same rule without advancing
scanNext @ C:\Program Files\Microsoft VS Code\resources\appnode_modules.asarvscode-textmate\release\main.js:2883
C:\Program Files\Microsoft VS Code\resources\appnode_modules.asarvscode-textmate\release\main.js:2883 [2] - Grammar is in an endless loop - Grammar pushed the same rule without advancing
scanNext @ C:\Program Files\Microsoft VS Code\resources\appnode_modules.asarvscode-textmate\release\main.js:2883
C:\Program Files\Microsoft VS Code\resources\appnode_modules.asarvscode-textmate\release\main.js:2883 [2] - Grammar is in an endless loop - Grammar pushed the same rule without advancing
scanNext @ C:\Program Files\Microsoft VS Code\resources\appnode_modules.asarvscode-textmate\release\main.js:2883
log.ts:159 INFO no standard startup: panel is active
extensionService.ts:145 Error received from starting extension host
(anonymous) @ extensionService.ts:145
extensionService.ts:146 timeout
(anonymous) @ extensionService.ts:146
extensionService.ts:374 Extension host terminated unexpectedly. Code: 0 Signal: null
w._onExtensionHostCrashed @ extensionService.ts:374
notificationsAlerts.ts:41 Extension host terminated unexpectedly.
t.onDidNotificationChange @ notificationsAlerts.ts:41
actions.ts:314 Startup Performance Measurement
actions.ts:316 OS: win32 (10.0.15063)
actions.ts:317 CPUs: Intel(R) Core(TM) i5-7300HQ CPU @ 2.50GHz (4 x 2496)
actions.ts:318 Memory (System): 15.84GB (7.92GB free)
actions.ts:319 Memory (Process): 235.66MB working set (255.68MB peak, 185.88MB private, 61.24MB shared)
actions.ts:320 VM (likelyhood): 31%
actions.ts:321 Initial Startup: true
actions.ts:322 Screen Reader Active: false
actions.ts:323 Empty Workspace: false
actions.ts:331
actions.ts:344 Extension Activation Stats
actions.ts:353
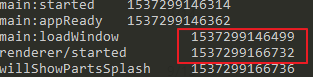
actions.ts:356 Raw Startup Timers (CSV)
actions.ts:362 Name Start
main:started 1534498709062
main:appReady 1534498709108
main:loadWindow 1534498709334
renderer/started 1534498729647
willShowPartsSplash 1534498729648
willAccessLocalStorage 1534498729648
didAccessLocalStorage 1534498729648
didShowPartsSplash 1534498729655
willLoadWorkbenchMain 1534498729669
didLoadWorkbenchMain 1534498730054
main/startup 1534498730054
willReadWorkspaceIdentifier 1534498730091
didReadWorkspaceIdentifier 1534498730091
willStartWorkbench 1534498730091
willLoadExtensions 1534498730094
LifecyclePhase/Restoring 1534498730101
willRestoreEditors 1534498730167
willRestoreViewlet 1534498730167
didRestoreViewlet 1534498730186
didRestoreEditors 1534498731884
LifecyclePhase/Running 1534498731884
didStartWorkbench 1534498731900
willReadLocalStorage 1534498731901
didReadLocalStorage 1534498731901
extensionHostReady 1534498732038
didLoadExtensions 1534498732038
LifecyclePhase/Eventually 1534498814162
AndySteel-kcom
on 17 Aug 2018
Another output from Windows 2008 R2 (vm)
/C:/Program Files/Microsoft VS Code/resources/app/out/vs/workbench/workbench.main.js:1397 INFO no standard startup: panel is active
/C:/Program Files/Microsoft VS Code/resources/app/out/vs/workbench/workbench.main.js:4572 Startup Performance Measurement
/C:/Program Files/Microsoft VS Code/resources/app/out/vs/workbench/workbench.main.js:4572 OS: win32 (6.1.7601)
/C:/Program Files/Microsoft VS Code/resources/app/out/vs/workbench/workbench.main.js:4572 CPUs: Intel(R) Xeon(R) CPU E5-2630 0 @ 2.30GHz (4 x 2294)
/C:/Program Files/Microsoft VS Code/resources/app/out/vs/workbench/workbench.main.js:4572 Memory (System): 8.00GB (2.15GB free)
/C:/Program Files/Microsoft VS Code/resources/app/out/vs/workbench/workbench.main.js:4573 Memory (Process): 241.92MB working set (241.92MB peak, 208.30MB private, 53.57MB shared)
/C:/Program Files/Microsoft VS Code/resources/app/out/vs/workbench/workbench.main.js:4573 VM (likelyhood): 20%
/C:/Program Files/Microsoft VS Code/resources/app/out/vs/workbench/workbench.main.js:4573 Initial Startup: true
/C:/Program Files/Microsoft VS Code/resources/app/out/vs/workbench/workbench.main.js:4573 Screen Reader Active: false
/C:/Program Files/Microsoft VS Code/resources/app/out/vs/workbench/workbench.main.js:4573 Empty Workspace: false
/C:/Program Files/Microsoft VS Code/resources/app/out/vs/workbench/workbench.main.js:4573
/C:/Program Files/Microsoft VS Code/resources/app/out/vs/workbench/workbench.main.js:4573 Extension Activation Stats
/C:/Program Files/Microsoft VS Code/resources/app/out/vs/workbench/workbench.main.js:4573
/C:/Program Files/Microsoft VS Code/resources/app/out/vs/workbench/workbench.main.js:4574 Raw Startup Timers (CSV)
/C:/Program Files/Microsoft VS Code/resources/app/out/vs/workbench/workbench.main.js:4574 Name Start
main:started 1534499314166
main:appReady 1534499314212
main:loadWindow 1534499314626
renderer/started 1534499334880
willShowPartsSplash 1534499334881
willAccessLocalStorage 1534499334881
didAccessLocalStorage 1534499334881
didShowPartsSplash 1534499334913
willLoadWorkbenchMain 1534499334933
didLoadWorkbenchMain 1534499335584
main/startup 1534499335584
willReadWorkspaceIdentifier 1534499335601
didReadWorkspaceIdentifier 1534499335601
willStartWorkbench 1534499335601
willLoadExtensions 1534499335606
LifecyclePhase/Restoring 1534499335619
willRestoreEditors 1534499335722
willRestoreViewlet 1534499335722
didRestoreViewlet 1534499335756
didRestoreEditors 1534499337124
LifecyclePhase/Running 1534499337125
didStartWorkbench 1534499337141
willReadLocalStorage 1534499337141
didReadLocalStorage 1534499337141
extensionHostReady 1534499337391
didLoadExtensions 1534499337391
LifecyclePhase/Eventually 1534499340143
AndySteel-kcom
on 17 Aug 2018
On the Win 2008 R2 machine I just clicked on the Terminal window and it took almost a minute to activate itself with the command line prompt.
It then popped up with a warning - "The standard renderer for integrated terminal appears to be slow on your computer. Would you like to switch to the alternate DOM-based renderer which may improve performance."
I chose to revert to DOM-based and it improved the terminal rendering but the remainder of the app very very slow. For example just selected File...Open Folder and chose a folder. It then took 18 seconds of doing nothing before starting to load the folder. It let me continue editing files in the meantime.
AndySteel-kcom
on 17 Aug 2018
Please follow this guide (https://github.com/Microsoft/vscode/wiki/Performance-Issues#visual-studio-code-starts-up-slowly) and attach the CPU profiles you get when starting with --prof-startup
 jrieken
on 17 Aug 2018
jrieken
on 17 Aug 2018
What guide sorry ? I thought I had provided the output of the --prof-startup above?
AndySteel-kcom
on 17 Aug 2018
Ops, forget to paste the link... The --prof-startup generates three files, those are needed to understand what's slow
jrieken
on 17 Aug 2018
@jrieken when launching vscode from the terminal with _code --prof-startup_ here's what is spittied out :
[ [ { Error: connect ECONNREFUSED 127.0.0.1:9222
at Object._errnoException (util.js:1024:11)
at _exceptionWithHostPort (util.js:1046:20)
at TCPConnectWrap.afterConnect [as oncomplete] (net.js:1182:14)
code: 'ECONNREFUSED',
errno: 'ECONNREFUSED',
syscall: 'connect',
address: '127.0.0.1',
port: 9222 },
{ Error: connect ECONNREFUSED 127.0.0.1:9222
at Object._errnoException (util.js:1024:11)
at _exceptionWithHostPort (util.js:1046:20)
at TCPConnectWrap.afterConnect [as oncomplete] (net.js:1182:14)
code: 'ECONNREFUSED',
errno: 'ECONNREFUSED',
syscall: 'connect',
address: '127.0.0.1',
port: 9222 },
{ Error: connect ECONNREFUSED 127.0.0.1:9222
at Object._errnoException (util.js:1024:11)
at _exceptionWithHostPort (util.js:1046:20)
at TCPConnectWrap.afterConnect [as oncomplete] (net.js:1182:14)
code: 'ECONNREFUSED',
errno: 'ECONNREFUSED',
syscall: 'connect',
address: '127.0.0.1',
port: 9222 },
{ Error: connect ECONNREFUSED 127.0.0.1:9222
at Object._errnoException (util.js:1024:11)
at _exceptionWithHostPort (util.js:1046:20)
at TCPConnectWrap.afterConnect [as oncomplete] (net.js:1182:14)
code: 'ECONNREFUSED',
errno: 'ECONNREFUSED',
syscall: 'connect',
address: '127.0.0.1',
port: 9222 },
{ Error: connect ECONNREFUSED 127.0.0.1:9222
at Object._errnoException (util.js:1024:11)
at _exceptionWithHostPort (util.js:1046:20)
at TCPConnectWrap.afterConnect [as oncomplete] (net.js:1182:14)
code: 'ECONNREFUSED',
errno: 'ECONNREFUSED',
syscall: 'connect',
address: '127.0.0.1',
port: 9222 },
{ Error: connect ECONNREFUSED 127.0.0.1:9222
at Object._errnoException (util.js:1024:11)
at _exceptionWithHostPort (util.js:1046:20)
at TCPConnectWrap.afterConnect [as oncomplete] (net.js:1182:14)
code: 'ECONNREFUSED',
errno: 'ECONNREFUSED',
syscall: 'connect',
address: '127.0.0.1',
port: 9222 },
{ Error: connect ECONNREFUSED 127.0.0.1:9222
at Object._errnoException (util.js:1024:11)
at _exceptionWithHostPort (util.js:1046:20)
at TCPConnectWrap.afterConnect [as oncomplete] (net.js:1182:14)
code: 'ECONNREFUSED',
errno: 'ECONNREFUSED',
syscall: 'connect',
address: '127.0.0.1',
port: 9222 },
{ Error: connect ECONNREFUSED 127.0.0.1:9222
at Object._errnoException (util.js:1024:11)
at _exceptionWithHostPort (util.js:1046:20)
at TCPConnectWrap.afterConnect [as oncomplete] (net.js:1182:14)
code: 'ECONNREFUSED',
errno: 'ECONNREFUSED',
syscall: 'connect',
address: '127.0.0.1',
port: 9222 },
{ Error: connect ECONNREFUSED 127.0.0.1:9222
at Object._errnoException (util.js:1024:11)
at _exceptionWithHostPort (util.js:1046:20)
at TCPConnectWrap.afterConnect [as oncomplete] (net.js:1182:14)
code: 'ECONNREFUSED',
errno: 'ECONNREFUSED',
syscall: 'connect',
address: '127.0.0.1',
port: 9222 },
{ Error: connect ECONNREFUSED 127.0.0.1:9222
at Object._errnoException (util.js:1024:11)
at _exceptionWithHostPort (util.js:1046:20)
at TCPConnectWrap.afterConnect [as oncomplete] (net.js:1182:14)
code: 'ECONNREFUSED',
errno: 'ECONNREFUSED',
syscall: 'connect',
address: '127.0.0.1',
port: 9222 } ] ]
cboillat
on 20 Aug 2018
It's that it cannot find a free port... Can you retry after restarting your computer?
jrieken
on 20 Aug 2018
@jrieken nothing changed after the reboot, still the same error.
cboillat
on 20 Aug 2018
Anything on your system that would prevent us from connecting to port 9222? Firewall? Another service etc?
jrieken
on 20 Aug 2018
@jrieken ok, I managed to launch vscode with code -prof--startup but no sign of profile files. Where should they be located ?
cboillat
on 21 Aug 2018
You can find attached a video showing how slow the startup is and that I do not have any files generated after a --prof-startup launch.
FYI, before the last update I never had any problem with vscode.
Video:
vscode-sloooowwwww.zip
cboillat
on 21 Aug 2018
Where should they be located ?
In your home directory. The --prof-startup command doesn't seem to work you, you should get into a different flow, being prompted from the editor... Let's take that to another issue.
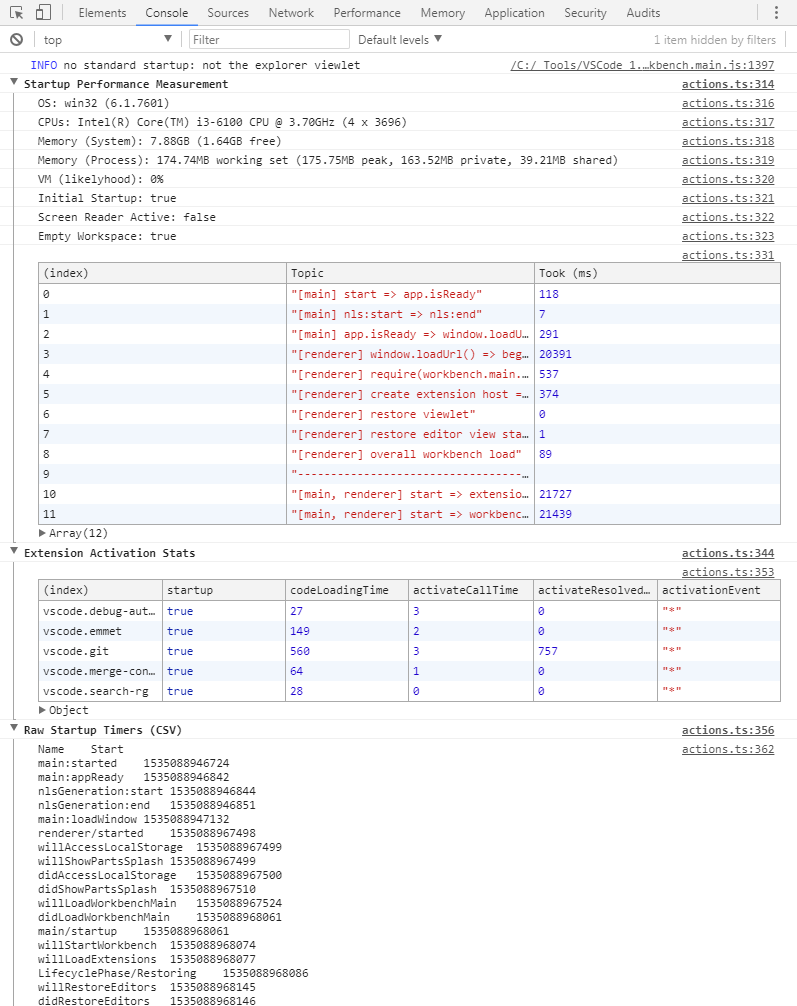
Wrt the perf problem. Have you tried insiders vs stable? Can you start, do F1 > Startup Performance and copy the output here (enclosed in triple backticks, please)
jrieken
on 21 Aug 2018
Fresh installation of insiders version did not changed anything :-(
Here is the F1 > Startup Performance from my Insiders version :
/C:/Program Files/Microsoft VS Code Insiders/resources/app/out/vs/workbench/workbench.main.js:1403  INFO no standard startup: not just one text editor
/C:/Program Files/Microsoft VS Code Insiders/resources/app/out/vs/workbench/workbench.main.js:5007 Startup Performance Measurement
/C:/Program Files/Microsoft VS Code Insiders/resources/app/out/vs/workbench/workbench.main.js:5007 OS: win32(10.0.16299)
/C:/Program Files/Microsoft VS Code Insiders/resources/app/out/vs/workbench/workbench.main.js:5007 CPUs: Intel(R) Core(TM) i7-4800MQ CPU @ 2.70GHz(8 x 2694)
/C:/Program Files/Microsoft VS Code Insiders/resources/app/out/vs/workbench/workbench.main.js:5007 Memory(System): 7.91 GB(1.07GB free)
/C:/Program Files/Microsoft VS Code Insiders/resources/app/out/vs/workbench/workbench.main.js:5007 Memory(Process): 185.41 MB working set(185.93MB peak, 164.44MB private, 40.40MB shared)
/C:/Program Files/Microsoft VS Code Insiders/resources/app/out/vs/workbench/workbench.main.js:5007 VM(likelyhood): 0%
/C:/Program Files/Microsoft VS Code Insiders/resources/app/out/vs/workbench/workbench.main.js:5007 Initial Startup: true
/C:/Program Files/Microsoft VS Code Insiders/resources/app/out/vs/workbench/workbench.main.js:5007 Has 0 other windows
/C:/Program Files/Microsoft VS Code Insiders/resources/app/out/vs/workbench/workbench.main.js:5007 Screen Reader Active: false
/C:/Program Files/Microsoft VS Code Insiders/resources/app/out/vs/workbench/workbench.main.js:5008 Empty Workspace: true
/C:/Program Files/Microsoft VS Code Insiders/resources/app/out/vs/workbench/workbench.main.js:5008
/C:/Program Files/Microsoft VS Code Insiders/resources/app/out/vs/workbench/workbench.main.js:5008 Extension Activation Stats
/C:/Program Files/Microsoft VS Code Insiders/resources/app/out/vs/workbench/workbench.main.js:5008
/C:/Program Files/Microsoft VS Code Insiders/resources/app/out/vs/workbench/workbench.main.js:5008 Raw Startup Timers (CSV)
/C:/Program Files/Microsoft VS Code Insiders/resources/app/out/vs/workbench/workbench.main.js:5008 Name Start
main:started    1534942241015
main:appReady   1534942241065
main:loadWindow     1534942241281
renderer/started    1534942261518
willShowPartsSplash     1534942261519
willAccessLocalStorage  1534942261519
didAccessLocalStorage   1534942261519
didShowPartsSplash  1534942261523
willLoadWorkbenchMain   1534942261534
didLoadWorkbenchMain    1534942261929
main/startup    1534942261929
willStartWorkbench  1534942261938
willLoadExtensions  1534942262018
LifecyclePhase/Restoring    1534942262028
LifecyclePhase/Starting/createContrib:start     1534942262048
LifecyclePhase/Starting/createContrib:end   1534942262052
LifecyclePhase/Restoring/createContrib:start    1534942262052
LifecyclePhase/Restoring/createContrib:end  1534942262052
willRestoreEditors  1534942262116
didRestoreEditors   1534942262116
willRestoreViewlet  1534942262116
didRestoreViewlet   1534942262130
LifecyclePhase/Running  1534942262130
LifecyclePhase/Running/createContrib:start  1534942262138
LifecyclePhase/Running/createContrib:end    1534942262141
didStartWorkbench   1534942262141
extensionHostReady  1534942263542
didLoadExtensions   1534942263542
LifecyclePhase/Eventually   1534942265143
LifecyclePhase/Eventually/createContrib:start   1534942265143
LifecyclePhase/Eventually/createContrib:end     1534942265148
cboillat
on 22 Aug 2018
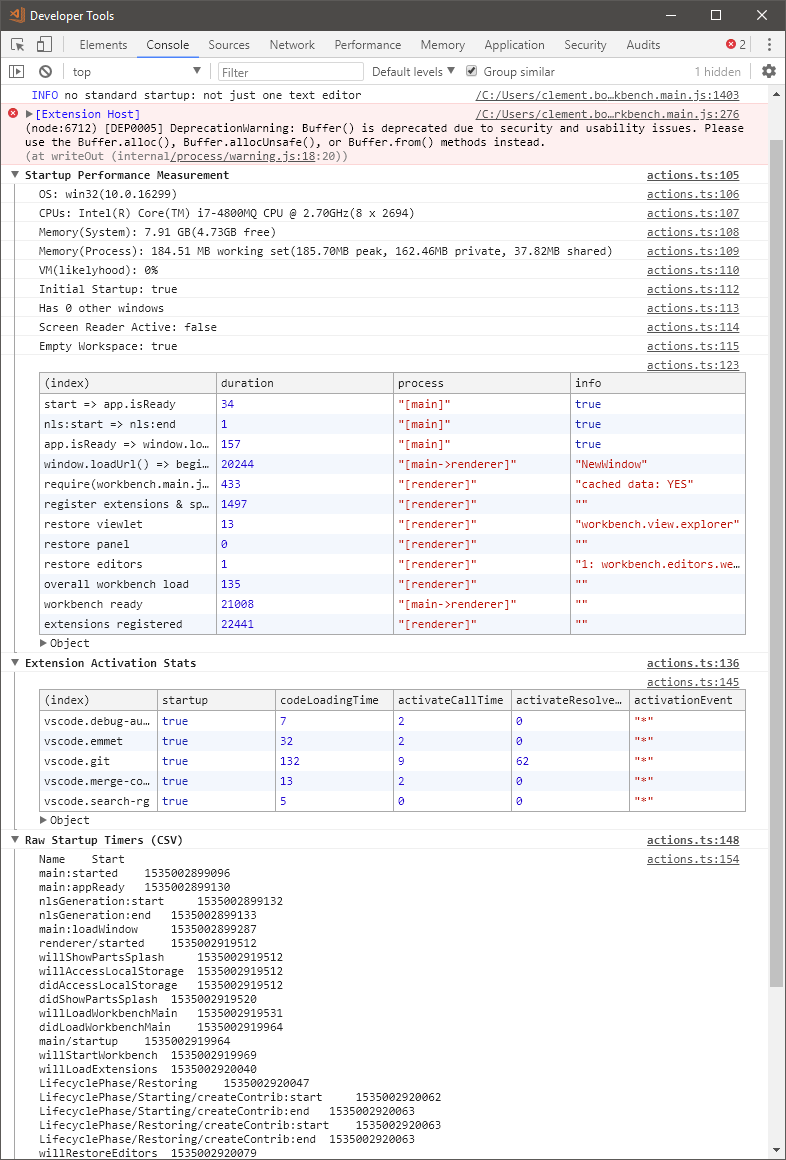
What? There should be a table like this. Please open dev tools first, wait a little, leave dev tools open and run 'Startup Performance' again

jrieken
on 22 Aug 2018
Here it is :

cboillat
on 22 Aug 2018
Thanks - great. It takes shockingly ~20seconds to create the renderer process. Thats often caused by über-eager anti virus software or other OS specific things
jrieken
on 22 Aug 2018
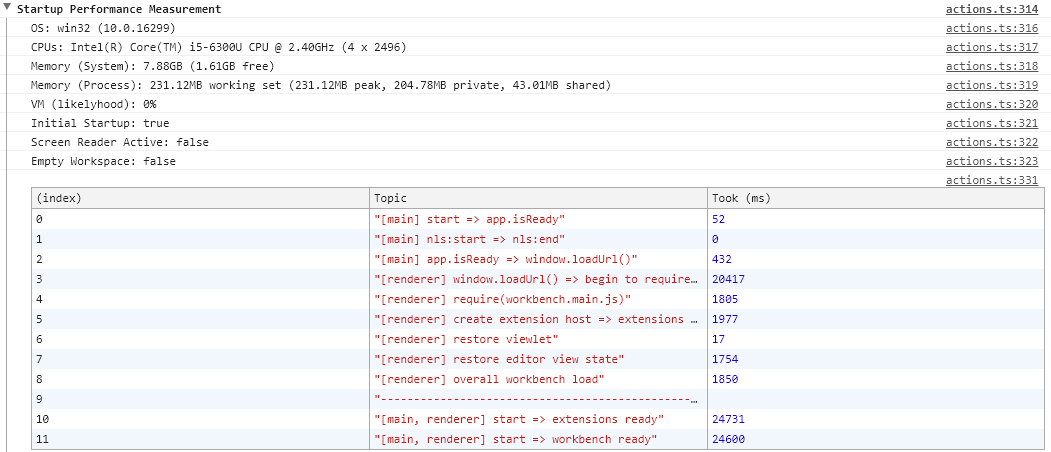
@cboillat can you see if you can reproduce the same issue with a newer version of VSCode that is using Electron 3.0.x? Download from here.
 bpasero
on 23 Aug 2018
bpasero
on 23 Aug 2018
@bpasero thanks for helping !
Unfortunately, the "Exploration" version of vscode does not change anything :-(
To answer @jrieken, the only AV installed on my PC is Windows Defender. And I do not have any other issues with other programms on this computer.
Here is the Startup Performance screenshot :
cboillat
on 23 Aug 2018
@jrieken @bpasero FYI switching back to june version 1.2.5.1 fixed the problem
cboillat
on 23 Aug 2018
Crazy... Must be somehow related to the Electron update (1.26 uses a newer version than 1.25). Everything seems super fast on your computer, except for creation of the renderer process (the window in which we paint VS Code).
@cboillat Once the windows shows, can you leave it and open another, second window (F1 > New Window)? Then, in the new window perform the 'F1 > Startup Performance' command. Wonder if creating the second renderer process is equally slow.
jrieken
on 23 Aug 2018
Crazy... Must be somehow related to the Electron update
Maybe the previous electron version was whitelisted by now in most AV software and with the update it takes some time until AV software catches up with the changed DLLs that this update brings?
bpasero
on 23 Aug 2018
Btw I wonder if https://github.com/electron/electron/issues/12895 could be related
bpasero
on 23 Aug 2018
@jrieken here is the second window Startup Performance :
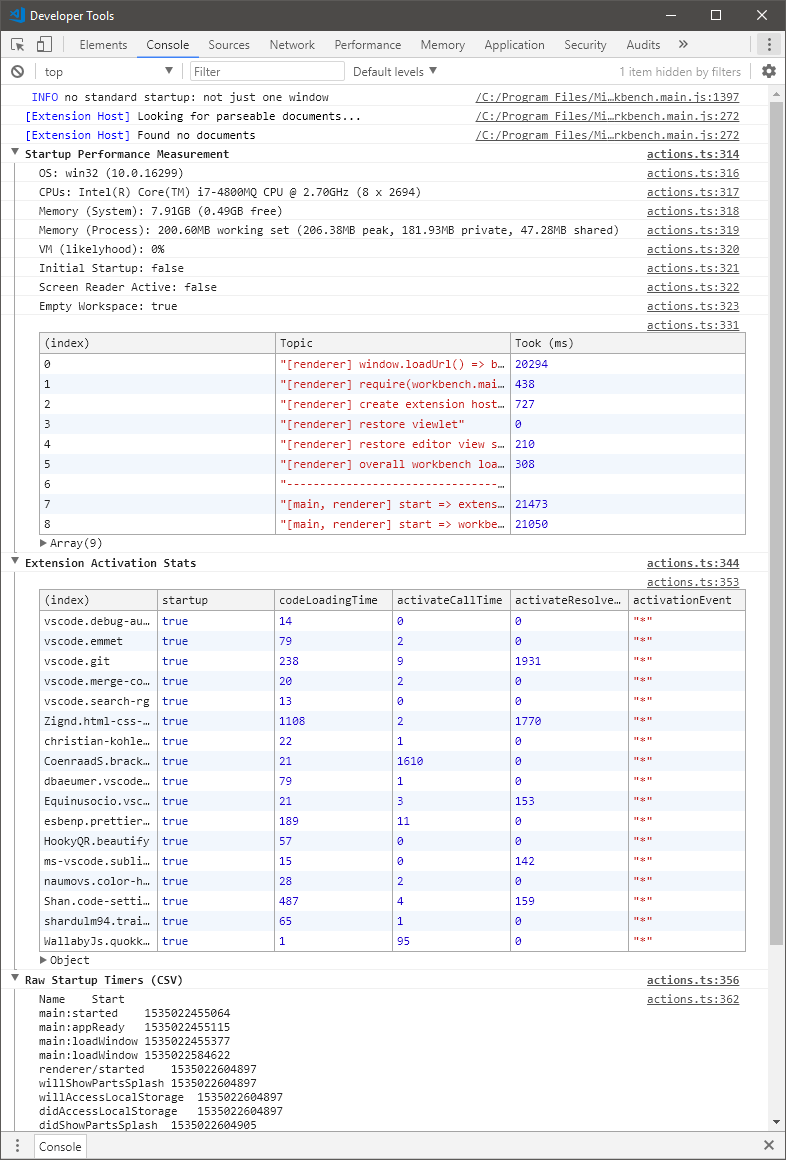
cboillat
on 23 Aug 2018
Ok, same disaster. At least consistent... 🐌
jrieken
on 23 Aug 2018
I am also having this same problem since the last July update and the switch to the user version.
 quivocal
on 24 Aug 2018
quivocal
on 24 Aug 2018
Same issue.
Version 1.25.1 works great.
Version 1.26.0 and above is about 20 seconds to startup.
It's diffenetly Electron issue.
I tried to start https://github.com/electron/electron-quick-start on different versions.
1.8.7 - open instantly.
2.0.7 and 3.0.0-beta.5 - terrible slow start.
 overburner
on 24 Aug 2018
overburner
on 24 Aug 2018
I wonder what's different on your windows installations... Are you guys using Chrome? That's fast to start, right?
jrieken
on 29 Aug 2018
@jrieken I use Chrome and Opera. No problem, all browsers fast.
 Koljasha
on 29 Aug 2018
Koljasha
on 29 Aug 2018
@jrieken I'm using Chrome too. Everything's fast, no other particular problem.
cboillat
on 29 Aug 2018
I'll chime in as well since there seems to be more activity on this issue vs mine in the electron repo. I'm also using chrome Version 68.0.3440.75, and the startup performance is fine.
It's my opinion that the update to electron is definitely the cause of the slow down. I write electron apps a lot for work, and I have been stuck on electron v 1.8.X for a while now because of similar slow startup issues with 2.X and 3.X versions.
My VSCode startup profile looks very similar to the ones above. (About 20 seconds for the renderer window.loadURL process)
They've changed A LOT in the electron 2.0 release. They've upgraded just about every major part of the framework:
"Major bumps to several important parts of Electron's toolchain, including Chrome 61, Node 8.9.3, V8 6.1.534.41, GTK+ 3 on Linux, updated spellchecker, and Squirrel."
I don't suspect anything with the node version, as we're currently running 8.9.X for our development and it works just fine.
We're at a bit of a loss at the moment, but we're going to continue to dig. I'll keep this thread updated if we narrow down the issue in our particular environment. I hope any others will do the same. In the meantime I've just reinstalled v1.25 without issue and it works well.
 dough654
on 29 Aug 2018
dough654
on 29 Aug 2018
same for 1.26.1 windows 7 67 bit. Disabled plugins, no help. Clicking wait ind it proceeds, no crashing
 algorusa
on 3 Sep 2018
algorusa
on 3 Sep 2018
Hi @jrieken, any news concerning this issue ?
cboillat
on 10 Sep 2018
@cboillat It's tracked as an upstream electron issue here: https://github.com/electron/electron/issues/12895 Tho, nothing yet from the electron team...
jrieken
on 10 Sep 2018
@cboillat can you provide the following details to eliminate some possible causes and further diagnose the issue.
- Do you see the issue when you run the app with
--no-proxy-resolver - If you have proxy auto detect settings can you try disabling it and run the app
- Can you provide the output of
--log-net-logfor the app,app.exe --log-net-log=netlog.json - Do you have any problems with loading pages on the system with chrome 61.0.3163.79
bpasero
on 17 Sep 2018
@bpasero
- Do you see the issue when you run the app with --no-proxy-resolver
- Yes same issue
If you have proxy auto detect settings can you try disabling it and run the app
- Same problem
Can you provide the output of --log-net-log for the app, app.exe --log-net-log=netlog.json
Do you have any problems with loading pages on the system with chrome 61.0.3163.79
- Is it ok to install different versions of Chrome on the same machine ? I don't want to mess up my current working system...
cboillat
on 18 Sep 2018
Experiencing the same issue now.
I've uninstall all versions of code (previously I installed code system/user and code-insider system/user.
And I've tried separately install code-insider system and code-insider user again. The issue still persists.
Is there any workaround you could suggest us to try?
I'm also wondering why all the profiles currently reported are showing roughly 20 secs (including mine)
I don't see high CPU usage during start up. It sounds to me that in start up logic of vs code it is waiting for something but timeout.
 ipip2005
on 18 Sep 2018
ipip2005
on 18 Sep 2018
@ipip2005 can you follow https://github.com/Microsoft/vscode/issues/56644#issuecomment-421893477
bpasero
on 19 Sep 2018
@cboillat @ipip2005 could you try and reproduce this from a smaller sample, by downloading Electron and just running that (Electron.exe)?
bpasero
on 19 Sep 2018
@cboillat @ipip2005 could you try and reproduce this from a smaller sample, by downloading Electron and just running that (Electron.exe)?
netlog.zip - output from the electron.exe --log-net-log=netlog.json
overburner
on 19 Sep 2018
@overburner could you try and reproduce this from a smaller sample, by downloading Electron and just running that (Electron.exe)?
bpasero
on 19 Sep 2018
@bpasero electron.exe takes more than 20 seconds to open.
overburner
on 19 Sep 2018
@bpasero same here, electron-v2.0.7 takes more than 20 seconds to open.
cboillat
on 19 Sep 2018
@bpasero
electron-v2.0.7-win32-x64:
$ time ./electron.exe -v
v2.0.7
real 0m20,337s
user 0m0,000s
sys 0m0,093s
electron-v2.0.7-win32-x64:
$ time ./electron.exe -v
v2.0.10
real 0m20,681s
user 0m0,000s
sys 0m0,109s
Koljasha
on 19 Sep 2018
Great, please hold tight, will have something to try out soon to find out more using just Electron (which makes this problem a bit easier).
bpasero
on 19 Sep 2018
@cboillat @Koljasha @overburner can you please try this:
git clone https://github.com/electron/electron-quick-start.gitcd electron-quick-startnpm install- open
main.jsand replace the contents with the contents below npm start- look at the console for the output "Tracing data recorded to..."
- attach that data as zip file
main.js:
const { app, BrowserWindow, contentTracing } = require('electron')

let mainWindow

function createWindow() {
  const traceOptions = {
    categoryFilter: '*',
    traceOptions: 'record-until-full,enable-sampling'
  }

  contentTracing.startRecording(traceOptions, _ => {
    mainWindow = new BrowserWindow({ width: 800, height: 600 })

    mainWindow.loadURL('data:text/html, <h1>Hello World!</h1>')

    mainWindow.webContents.once('did-finish-load', _ => {
      contentTracing.stopRecording('', path => {
        console.log('Tracing data recorded to ' + path)
      })
    })

    mainWindow.once('closed', function () {
      mainWindow = null
    })
  })
}

app.on('ready', createWindow)

app.on('window-all-closed', function () {
  if (process.platform !== 'darwin') {
    app.quit()
  }
})
@bpasero - tracing data: data.zip
overburner
on 20 Sep 2018
@bpasero data:
data.zip
Koljasha
on 20 Sep 2018
@overburner @Koljasha thanks. could you run another test: see if this still reproduces with Electron 2.0.10 that was just released: Download
bpasero
on 20 Sep 2018
Oh, looks like you did that already in https://github.com/Microsoft/vscode/issues/56644#issuecomment-422801816 and it reproduces still.
bpasero
on 20 Sep 2018
@bpasero tracing data : data.zip
cboillat
on 20 Sep 2018
@bpasero tracing data :
data.zip
 buckeyeconroy
on 21 Sep 2018
buckeyeconroy
on 21 Sep 2018
@bpasero any news on it?
ipip2005
on 28 Sep 2018
Could somebody provide the zipped (no admin needed) version 1.25 for download? I just was able to find the sources or binaries that need admin privilege. I will remove 1.27 cause is unusable here in work (Windows) and will continue using it only on Linux (home). Thank you!
 sdlins
on 28 Sep 2018
sdlins
on 28 Sep 2018
I use 1.26 &1.27 in Windows 10 also very very slow.
1.25 is very fast.
 yellowdragon1
on 3 Oct 2018
yellowdragon1
on 3 Oct 2018
Thanks @yellowdragon1 , I downgraded to 1.25 and it works fast for me now
ipip2005
on 4 Oct 2018
Just uninstalled 1.28 - also super slow (just like 1.26 & 1.27). Downgraded to 1.25 and everything is good now!
 JoshBAR
on 8 Oct 2018
JoshBAR
on 8 Oct 2018
FYI I'm having the same slowlyness problem with the Whatsapp electron app.
cboillat
on 10 Oct 2018
Seems that the problem with a very slow startup time was resolved.
I just tried to start the Electron 4.0.0-nightly.20181010 and it started as fast as Electron 1.8.7.
overburner
on 15 Oct 2018
@overburner in Electron:
electron-v4.0.0-beta.3-win32-x64
$ time ./electron.exe -v
v4.0.0-beta.3
real    0m0,518s
user    0m0,000s
sys     0m0,140s
1.29 also slow.
yellowdragon1
on 16 Nov 2018
Issue Type: Performance Issue
Hi,
Since the last july update and the switch to the user version (vs. all users version) of vscode, everything is slow. Vscode takes like 20 seconds to open and then when I click on a file it takes another 10 seconds to open it.
I tried to disable all extensions, nothing changed.
The problem came right after I downloaded the "user version" of vscode. Before that, I had the "all users version" installed and everything was ok. Maybe it's because I'm on an entreprise computer linked to a windows domain and our user PATH is special and located on a network drive.
Thanks in advance for your help !
Regards
ClémentVS Code version: Code 1.26.0 (4e93618, 2018-08-13T16:29:31.933Z)
OS version: Windows_NT x64 10.0.16299System Info
Process Info
Workspace Info
Extensions (21)
My VSCode use to take about 20 seconds to load. I accidentally found that the issue has something to do with the User Data Directory, as I ran "code --user_data_dir .vscode" from the terminal and now VSCode starts within 3 seconds
 morganlombard
on 22 Nov 2018
morganlombard
on 22 Nov 2018
@morganlombard
no difference: installation for one or all users;
I understand from the tests - the case in the electron version
when the version is updated to v4, everything will be fast again
(old version - fast)
$ time electron-v1.8.8-win32-x64/electron.exe -v
v1.8.8
real 0m0,453s
user 0m0,000s
sys 0m0,109s
(slow)
$ time electron-v2.0.14-win32-x64/electron.exe -v
v2.0.14
real 0m20,720s
user 0m0,000s
sys 0m0,078s
$ time electron-v3.0.10-win32-x64/electron.exe -v
v3.0.10
real 0m20,560s
user 0m0,000s
sys 0m0,109s
$ time electron-v4.0.0-beta.7-win32-x64/electron.exe -v
v4.0.0-beta.7
real 0m0,701s
user 0m0,000s
sys 0m0,156s
Koljasha
on 22 Nov 2018
1.30 also slow.
yellowdragon1
on 17 Dec 2018
I think the answer to this issue may be a bit straightforward: we have to stick with 1.25 until VSCode is updated to Electron 4.0.
It’s a bit unfortunate because of all the features we are missing, but it’s the “cost” of having a fast editor.
Anyone from the VSCode team willing to share the status on this upgrade? (if this is the solution you guys are aiming for)
 bopinto
on 17 Dec 2018
bopinto
on 17 Dec 2018
We have our exploration builds ready with Electron 4, they should be fine to use, though Electron is still beta in those:
Download:
bpasero
on 18 Dec 2018
@cboillat do you still experience this with our insider builds that recently switched to Electron 4?
bpasero
on 1 Jul 2019
I'm experiencing the same issue. My vscode needs 40 sec - 1 min to be able to write/modify something to file from launching.
Btw It is also happening to me even I'm on version 1.25.1. And extensions market place is really slow. it takes 30sec ~ 1min to open details on marketplace.
 tomocrafter
on 27 Nov 2019
tomocrafter
on 27 Nov 2019
Version: 1.40.2
OS: Linux x64 4.15.0-70-generic
I noticed something strange. When I start from the menu, it starts very slowly.
Log from the bash console:
# /usr/share/code/code --no-sandbox --unity-launch %F

Option 'sandbox' is unknown. Ignoring.
[main 2019-11-29T07:23:21.278Z] update#setState idle
[main 2019-11-29T07:23:21.278Z] update#ctor - manual checks only; automatic updates are disabled by user preference
bash: cannot set terminal process group (-1): Inappropriate ioctl for device
bash: no job control in this shell
tar: _data: Cannot mkdir: Permission denied
tar: _data: Cannot mkdir: Permission denied
tar: _data/initialized: Cannot open: No such file or directory
tar: _data: Cannot mkdir: Permission denied
tar: _data/pg_stat_tmp: Cannot mkdir: No such file or directory
tar: _data: Cannot mkdir: Permission denied
tar: _data/pg_tblspc: Cannot mkdir: No such file or directory
tar: _data: Cannot mkdir: Permission denied
tar: _data/global: Cannot mkdir: No such file or directory
tar: _data: Cannot mkdir: Permission denied
tar: _data/global/2845: Cannot open: No such file or directory
tar: _data: Cannot mkdir: Permission denied
tar: _data/global/2844: Cannot open: No such file or directory

====== More similar logs ======

tar: _data: Cannot mkdir: Permission denied
tar: _data/base/11566/159746: Cannot open: No such file or directory
tar: _data: Cannot mkdir: Permission denied
tar: _data/base/11566/159626: Cannot open: No such file or directory
tar: _data: Cannot mkdir: Permission denied
tar: _data/pg_twophase: Cannot mkdir: No such file or directory
tar: _data: Cannot mkdir: Permission denied
tar: _data/server.crt: Cannot open: No such file or directory
tar: Exiting with failure status due to previous errors
rm: cannot remove '/var/lib/docker/volumes/db_promocje_data': Permission denied
I don't know why VsCode try to remove my docker volume.
What's more, when I start VsCode from # /usr/bin/code, it starts normally (fast).
 dbanaszkiewicz
on 29 Nov 2019
dbanaszkiewicz
on 29 Nov 2019
@dbanaszkiewicz It is not happening to me. It is slow even I start vscode by code.exe (I'm on windows)
tomocrafter
on 18 Dec 2019
I'm seeing the same issue it takes electron applications around 30-60 seconds to start on Windows 10. I'm not using a proxy like the upstream issue linked previously.
I've ran VSCode without extensions, with extensions doesn't matter. It's time to renderer shown not extensions loaded. Same happens when opening a file / folder.
It happens with native electron as well.
 nijikokun
on 24 Dec 2019
nijikokun
on 24 Dec 2019
any known workarounds? still taking a while to open (tested on insiders)
 amit177
on 8 Feb 2020
amit177
on 8 Feb 2020
I am experiencing slow startup as well (_even with extensions disabled_).
I ran code with --prof-startup but my home directory has no profile text files.
Edit: One curious thing about it, when launching from the start menu. The start menu doesn't actually close after clicking on the VSCode icon for approximately 10 seconds. Any other applications, the start menu closes immediately.
 Chris-Dickerson
on 28 Feb 2020
Chris-Dickerson
on 28 Feb 2020
Got the same bug. It was in 1.42.0, later fixed in 1.42.1 and as soon as I updated vscode to 1.43.0 it appeared again.
And this behaviour is observed on Windows and on Linux as well.
 SkeLLLa
on 15 Mar 2020
SkeLLLa
on 15 Mar 2020
Also got the same bug in 1.42.0. Fixed by uninstalling a program (in that case, Badlion Client) that was completely slowing down VSCode.
Startup time with bug: ~20 secs to load everything
Without it: at least 5 seconds to load huge projects
 mazzlabs
on 17 Mar 2020
mazzlabs
on 17 Mar 2020
@Ma15fo43 how did you know what program caused it?
also i don't have any av, but it's so slowwwwww
 z4cH3r
on 6 Apr 2020
z4cH3r
on 6 Apr 2020
@Ma15fo43 how did you know what program caused it?
also i don't have any av, but it's so slowwwwww
@z4cH4r I figured it out by uninstalling a lot of my programs 😅
Quite annoying because it takes a lot of time but when you get your 2 sec startup back you're happy :)
mazzlabs
on 6 Apr 2020
Malwarebytes (AV) was the issue for me. Once I disabled that, things were fine.
 coalpha
on 6 Apr 2020
coalpha
on 6 Apr 2020
@coalpha I tried safe mode of windows so any av and other software never affect vscode.
tomocrafter
on 7 Apr 2020
I'd imagine that the extensions marketplace is largely dependent on your network connection.
As for file editing, it's possible that you have some vscode extensions that have save participants that take a long time to run.
coalpha
on 7 Apr 2020
Also got the same bug in 1.42.0. Fixed by uninstalling a program (in that case, Badlion Client) that was completely slowing down VSCode.
Startup time with bug: ~20 secs to load everything
Without it: at least 5 seconds to load huge projects
THANK YOU! Badlion Client was the issue for me too...
I was having this issue since months (~40s startup) with no idea what was causing it.... uninstalled badlion client, restarted, and now code is super fast to open!
 dukio
on 15 Apr 2020
dukio
on 15 Apr 2020
@Ma15fo43 @dukio THANK YOU!!!!!!!
OMFG, It actually worked for me. All I did thing is just uninstall badlion client and then restart the pc.
now code is extremely fast...
EDIT: I tried other electron apps like discord, postman. and It was also taking like 1 min to launch but now launches within 1 sec.
tomocrafter
on 15 Apr 2020
No problem! We're now sure that the Badlion Client is slowing down all the Electron apps installed on the PC. Maybe talking with the Badlion Staff Team will help resolving this issue?
Edit: I found a similar issue on the Badlion forums: https://www.badlion.net/forum/thread/240288
mazzlabs
on 15 Apr 2020
Hi. We will investigate why the Badlion Client could be causing a slowdown like this. Didn't know it was on such a mass scale as is being shown here in this thread. Had one isolated report a while back (not the one linked), but I see there are more reports coming in with time.
 mastergberry
on 15 Apr 2020
mastergberry
on 15 Apr 2020
im having the same problem,
i only have windows native AV and i deleted badlion (and 20 other apps). it takes around ~50 seconds to startup
vscode info
Version: 1.44.2 (user setup)
Commit: ff915844119ce9485abfe8aa9076ec76b5300ddd
Date: 2020-04-16T16:36:23.138Z
Electron: 7.1.11
Chrome: 78.0.3904.130
Node.js: 12.8.1
V8: 7.8.279.23-electron.0
OS: Windows_NT x64 10.0.18363
i mainly program in python and i do alot of small projects, often wanting to have 3 instances open but it just takes too long to open to be worth it.
it has been a probelm for about a month and its just getting annoying now.
i have re-isntalled vscode multiple times, restarted my computer etcetera
i have 1 extension (python 2020.4.74986) and it is disabled
things like:
opening vscode
opening workspaces
deleting shells
if anyone can help let me know
 Lach993
on 26 Apr 2020
Lach993
on 26 Apr 2020
Hi. Just wanted to drop an update that the issue related to Badlion Client should now be resolved with VSCode.
Anything else that is happening is 100% out of our scope. Good luck on any other problems :)
mastergberry
on 26 Apr 2020
@mastergberry what was the causing this problem?
tomocrafter
on 27 Apr 2020
@mastergberry Thanks for the update and the fast turn-around
Now, let's find out what other applications/settings/etc exist that can slow things down.
jrieken
on 27 Apr 2020
After the Windows 10 update process, VS Code and other programs I used had slowed down. I noticed that the Cortana service was open after the update. I turned off this service and restarted Windows. It's now back to normal.
 alialtun14
on 19 Aug 2020
alialtun14
on 19 Aug 2020
After the Windows 10 update process
Do you know the fully detailed version of windows that you have updated to?
jrieken
on 19 Aug 2020
August 11, 2020—KB4566782 (OS Build 19041.450)
August 11, 2020-KB4569745 Cumulative Update for .NET Framework 3.5 and 4.8 for Windows 10 Version 2004
alialtun14
on 19 Aug 2020
Related issues
 vsccarl
·
3Comments
vsccarl
·
3Comments
 mrkiley
·
3Comments
mrkiley
·
3Comments
 sirius1024
·
3Comments
sirius1024
·
3Comments
 shanalikhan
·
3Comments
shanalikhan
·
3Comments
 philipgiuliani
·
3Comments
philipgiuliani
·
3Comments
Most helpful comment
Also got the same bug in 1.42.0. Fixed by uninstalling a program (in that case, Badlion Client) that was completely slowing down VSCode.
Startup time with bug: ~20 secs to load everything
Without it: at least 5 seconds to load huge projects