Vscode: Wrong command being executed for keybinding
Two users of Dart Code have reported this issue but I'm stuck on how to troubleshoot.
We keybind Ctrl+F5 in Dart Code to the "Flutter: Hot Reload" with a condition of inDebugMode && flutterProejctLoaded. The default Ctrl+F5 provided by VS Code has a condition of !inDebugMode so there should be no conflict.
Here's a screenshot of the keybinds for Ctrl+F5:

However, when these users press Ctrl+F5 during a debug session, they see this error:

This error comes from Code, and I presume it's because it's invoking "Start Without Debugging" (the keybind when not debugging). However, the orange status bar (and that they're trying to hot reload) suggests they are indeed in a debug session. Invoking our command from the palette works fine, so I don't think there's an issue with our command.
I don't know if this is a VS Code issue, but if not, I'm hoping for some ideas on how to track down what's happening.
 DanTup
All 47 comments
@DanTup thanks for finding this. I have pushed a potential fix, you can try it out in tomorrow insiders and let us know if the issue is fixed for you.
If not, please put a breakpoint here and check if it gets hit when you ctrl + F5
 isidorn
on 16 Jul 2018
isidorn
on 16 Jul 2018
Great, thanks! I was never able to repro it, do you know what might have triggered it so that I might be able to test it myself (this may be easier if the users don't have/wan't to grab Insiders).
DanTup
on 16 Jul 2018
@DanTup something like this:
- start debugging
- have an empty debug console
- stop debugging
- ctrl + F5
isidorn
on 16 Jul 2018
@isidorn Following those instructions I ended up in a debug session, but the status bar is still blue (not orange). Ctrl+F5 actually works correctly (calls our command).
In the issue reported, the users have an orange status bar but Ctrl+F5 is trying to start a debug session. I think this might be a different issue?
DanTup
on 17 Jul 2018
@DanTup can you check with the user if he can repro with the latest insiders - if he can then we will for sure know this is not fixed.
I was only speculating about steps.
isidorn
on 17 Jul 2018
@isidorn Got a response here. Seems to do something different, but not what was expected - seems to have restarted without debugging.
DanTup
on 17 Jul 2018
The other user reports no change here.
DanTup
on 18 Jul 2018
@DanTup ok. I have simplified how we are computing debug contexts. Please try it out in tomorrows insiders. If it still does not work then please verify
isidorn
on 20 Jul 2018
Thanks; will get them to try again and see what we can find.
DanTup
on 21 Jul 2018
@DanTup pointed me here
- Does your hot restart command get triggered?
I presume the answer here is no (you don't see a message in the Debug Console saying we hot reloaded, even though the error appeared?)
Correct, no message in the Debug Console.
Does the Start Without Debugging get triggered (put a breakpoint here)
I'm sure the answer to this is yes, since that message is appearing, but it's worth putting a breakpoint there to verify (see below).
Yes, that breakpoint gets triggered.
If a wrong command is triggered we need to figure out why the contexts are not correct. For that put breakpoints here and check what is the last value that context is set to
I'm not sure what variable or value to report back here. Can you be specific about what variable or field I should be looking at?
Thanks
 SteveAlexander
on 24 Jul 2018
SteveAlexander
on 24 Jul 2018
@SteveAlexander do a stateLabel check and let me know what is the last value there before you try executing the hot reload. Thanks for help.
isidorn
on 24 Jul 2018
Okay, this is on Insiders
dae69dbf00357ff8a3fe740a1f211d66b0b4681c
2018-07-27T05:05:45.350Z
Sequence of events:
I set up the second breakpoint, line 560 of debugService.ts
I hit F5 "Start Debugging"
Breakpoint hit. stateLabel = "Initializing"
Breakpoint hit. stateLabel = "Running"
I wait until the Flutter application is running in the iPhone simulator.
I hit ctrl+F5
See error message "There is already a debug configuration of "Flutter" running"
hit red square "stop debugging" control with mouse
Breakpoint hit. stateLabel = "Initializing"
Breakpoint hit. stateLabel = "Inactive"
errror message "Cannot read property "end" of undefined"
Interestingly, the "Flutter: Hot Restart ^F5" entry was not present in the command palette on Insiders. I tried uninstalling and reinstalling the Flutter extension, and it still wasn't there.
On my VSC release version, the command is there.
SteveAlexander
on 28 Jul 2018
@SteveAlexander I pushed a fix for this, can you please try tomorrow's vscode insiders and let us know if it still repros. Thanks a lot
isidorn
on 30 Jul 2018
@isidorn just tried with 0707dd4940b3fdbea8339595de478f354f6dda83 (2018-07-31T05:05:43.344Z), and still seeing the problem. Perhaps I need to wait for a later build?
SteveAlexander
on 31 Jul 2018
I have the same problem... Trying to debug and the first time it's working but when I restart the debug it says i already have a debug configuration running...
 marc1161
on 1 Aug 2018
marc1161
on 1 Aug 2018
@marc1161 Out of curiosity, is this with Dart/Flutter or something else?
DanTup
on 1 Aug 2018
@DanTup is with Golang
marc1161
on 1 Aug 2018
It's happening to me too, but with Golang.
 andre-paris
on 1 Aug 2018
andre-paris
on 1 Aug 2018
Also seeing this same error message when debugging Go, with the latest insiders (4fa62b, 2018-08-03T12:23:37.823Z). Not sure if it's actually related to the issue in question, but just to add a datapoint.
To me this error message starts showing only when there is an error while building, as everything works normally when the code builds succesfully (eg. debugger starts and stops as expected).
After a build failure, the 'debug bar' is no longer visible, status bar is blue and trying to debug results in the error message. Start without debugging does not work either and stop/restart are greyed out.
The only resolution I have found is to restart Code which is rather annoying. Commands such as debug: terminate thread or debug: disconnect seem to have no effect.
edit: I think the Go issue might actually be related to Microsoft/vscode-go#1814
 moitias
on 4 Aug 2018
moitias
on 4 Aug 2018
I'm also getting this constantly when debugging Go. It requires me to restart Go. Seems to happen more frequently when the application fails to exit cleanly
 stevegore
on 6 Aug 2018
stevegore
on 6 Aug 2018
(EDIT) SOLUTION:
@DanTup @stevegore @moitias @andre-paris @SteveAlexander @isidorn
Although I've been using this for weeks, this exact problem started happening to me today. I solved it by modifying launch.json and removing the flutter 'configurations' attributes (I'm using vscode of course):
PRIOR ˇTO EDIT (WITH ORIGINAL BUG)
{
    "version": "0.2.0",
    "configurations": [
        {
            "name": "Flutter",
            "request": "launch",
            "type": "dart"
        }
    ]
}
AFTER EDIT (BUG GONE)
{
    "version": "0.2.0",
    "configurations": [
       <"empty"!>
    ]
}
After modifying launch.json, I no longer get "There is already a debug configuration "Flutter" running" msg that I suddenly started getting today.
__BTW, I believe this started happening when I clicked on "Debug->Start Debugging" rather than the usual "Debug->Start Without Debugging".__ I have no idea why this happened or why editing launch.json fixes it.
I hope this helps.
PS: I had also deleted the 'build' folder but restored it after recognizing only the launch.json required the change. FYI.
 momoadeli
on 8 Aug 2018
momoadeli
on 8 Aug 2018
@momoadeli I can't explain that either. Can you reproduce this by putting it back? If so, can you post exactly what was in your launch config here (or in the linked Dart Code issue)?
We do have a lot of complex logic in the function that resolves the debug config, but I can't think why anything would be different between it not being there and being populated with the defaults. If I can repro it locally, I might be able to figure out what's going on.
DanTup
on 13 Aug 2018
@DanTup Thanks. I've edited my original post to included both pre and post launch.json contents. I am unable to mimic this currently as I don't have access to my machine until later but will post as soon as I find something. Meanwhile, please note __how__ I originally triggered the problem as indicated (including deleting and reinstating build folder). I'll try again.
momoadeli
on 13 Aug 2018
Very strange - I can't think of any reason that would change anything (you haven't supplied any interesting values in the launch.json so it really ought to be the same). I think it's unlikely the build folder affects this at all (that's really internal to Flutter, the Dart/Flutter plugins know nothing about it).
Please do let me know if it repros though, and the exact steps you're performing so I can try the same here.
DanTup
on 13 Aug 2018
I tried with your launch.json and (not all that surprisingly) I couldn't repro. I tried a few different combinations of launching/reloading/stopping :-(
DanTup
on 13 Aug 2018
vscode version: June 2018 (version 1.25)
@DanTup , I was able to repro with launch.json contents:
{
    "version": "0.2.0",
    "configurations": [
        {
            "name": "Flutter",
            "request": "launch",
            "type": "dart"
        }
    ]
}
I am concurrently running both iOS and Android emulators.
Action 1: (currently chosen emulator bottom right of vscode: IPhone)
.vscode toolbar: Debug->Start Without Debugging----- (works)Action 2: (chose android emulator bottom right of vscode: Android)
.vscode toolbar: Debug->Start Without Debugging----- (ERROR with image below:)
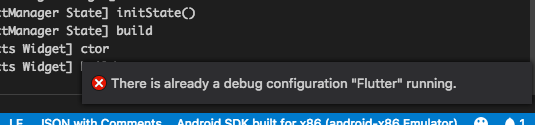
- Action 3 __.vscode removed launch.json's 'configuration' contents and both emulators work and the above error msg disappears.__
Current plugins:
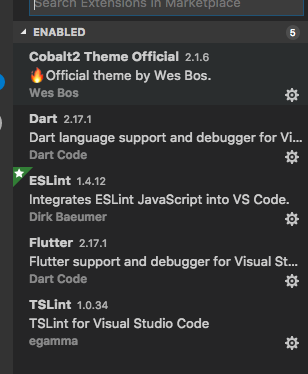
momoadeli
on 13 Aug 2018
I still can't repro or explain this. Sounds like @isidorn is working on changes to eliminate it though.
If you can run the Dart: Capture Logs command and then reproduce it (if you have to run twice, please ensure the log covers both debug sessions) and send me the log, I can see if there's anything obviously wrong (my guess is something weird is happening during shutting down the first debug session, leaving things in a weird state).
DanTup
on 20 Aug 2018
@DanTup I refactored quite a bit on the vscode regarding state changes. Can you please give this another try tomorrow (tuesday) on insiders. If you can still repro I would need a volunteer so I skype debug this with him. Thanks people.
isidorn
on 20 Aug 2018
Closing this since nobody complained that it is not working with latest vscode insiders.
If it still does not work let me know and I will reopen
isidorn
on 22 Aug 2018
I could never repro this, so can't test. @momoadeli can you confirm it's good in the latest Insiders?
DanTup
on 22 Aug 2018
I just tested with the latest insiders.
I'm still seeing the problem. Perhaps we should re-open this?
Version 1.27.0-insider (1.27.0-insider)
e0a68266321d1518bc12428b71d80524461a275b
2018-08-22T05:06:02.002Z
SteveAlexander
on 22 Aug 2018
@DanTup I am still seeing error on my updated VSCode (Version 1.26.1 ...can't mess with 'insiders' right now-- @SteveAlexander does see issue in insiders. ).
Again, all i need to do is add previously mentioned attributes to 'configurations' in launch.json. Problem immediately occurs. @isidorn
Mo
momoadeli
on 23 Aug 2018
@momoadeli I did try many things to repro with your steps without success. If you can open a clean VS Code instance and run Dart: Capture Logs and then repro and send me the logs, it might help me identify what's different.
DanTup
on 23 Aug 2018
There is a good chance it is a duplicate of https://github.com/Microsoft/vscode/issues/57255
Can you try in Tuesday insiders.
I appologize for asking you to try it out many times since I do not have nice repro steps on my machine I can not verify it mystelf.
isidorn
on 27 Aug 2018
@DanTup @isidorn Sorry for delay. I have the Dart log capture attached. I also have a short screen recording (QuickTime) I believe is helpful which I'm unable to attach here. I can share any way you suggest.
Also, this is VS Version 1.26.1 (not insiders):
Dart-Code-Log-2018-07-01 16-04.txt
momoadeli
on 27 Aug 2018
@momoadeli This log files seems to stop during the application launch:
[16:04:47 GMT-0400 (EDT)] [FlutterRun] [Info] <== [{"event":"app.debugPort","params":{"appId":"b78d1a0d-91f9-4522-b3f1-e0a9ce108537","port":52728,"wsUri":"ws://127.0.0.1:52728/ws","baseUri":"file:///Users/megabyzus_mbp/Library/Developer/CoreSimulator/Devices/93BABE77-7991-4670-B4C5-A0391EC6DF37/data/Containers/Data/Application/E9FB9F81-25DC-4654-9E1E-3BF3A2F990F5/tmp/academind_udmy_flutter_aug_2018_courseaJ9EVV/academind_udmy_flutter_aug_2018_course/"}}]
Mon Aug 27 2018 [16:04:47 GMT-0400 (EDT)] Log file ended
It's worth first checking if it's fixed in Insiders, since if so, we don't need to dig into it. Otherwise, it'd be useful to see a more complete log. I presume that this message is only seen the second time you try to launch a session, so the following steps should be a useful log:
- Open VS Code
- Start logging (you can untick
Analyzerto reduce the size of the log, it's a bit spammy here) - Run a debug session (the one I presume works)
- Try to run a second debug session (which shows the error)
- Stop the log (give it at least 5-10 secs before clicking Stop just to reduce chances of cutting off anything in-progress)
I'm particularly interested in the log for the shutting down of the first debug session. We do log a reasonable amount of things in the disconnect request, so if something isn't working correctly there, hopefully it'll show up. I'm curious what's different for you than me.
DanTup
on 28 Aug 2018
@DanTup upgraded to Version 1.27.0 (1.27.0). Problem still there. I assume this is NOT the 'insiders' version you're referring to?
momoadeli
on 5 Sep 2018
@momoadeli I'm not sure, I don't work on Code. Maybe @weinand can confirm if the fix from https://github.com/Microsoft/vscode/issues/57255 is expected in 1.27 (I would've thought so).
Also, a full log would still be useful - the one you previously attached seemed to be incomplete.
DanTup
on 6 Sep 2018
The fix for #57255 definitely fixed the issue I was seeing (which was unrelated to this issue).
above @isidorn said:
There is a good chance it is a duplicate of #57255
So let's assume that this issue is not a duplicate of #57255 then.
 weinand
on 6 Sep 2018
weinand
on 6 Sep 2018
@momoadeli I did make some changes to some termination code recently - could you try with v2.18.1 Beta 1 to see if you still see the issue:
https://github.com/Dart-Code/Dart-Code/releases/tag/v2.18.1-beta.1
Download the .vsix file and then run the Extensions: Install from VSIX command in VS Code, select to the vsix and then click the Reload button when the prompt appears.
If it still repros, a log file (using Dart: Capture Logs and included Observatory + Flutter Run) would definitely still be useful.
DanTup
on 6 Sep 2018
@DanTup, issue persists. I installed v2.18.1-beta.1 and followed your instructions. I see the first/Android launch mentioned in the log but I don't see the second/iPhoneX session mentioned, although I clicked on it. As mentioned before, this works without configuration attributes added in launch.json.
I also want to note I am working without it currently and it hasn't stopped my progress, so hopefully this hasn't created pressures for you. Attached is the capture log:
Dart-Code-Log-2018-08-04 15-28.txt
Many Thanks.
momoadeli
on 6 Sep 2018
Thanks for testing. I'm not surprised the second debug session doesn't appear in the logs (since based on the message, I don't think Code is trying to start it), though it looks like you may have not included the Observatory log category - which is the bit I was mostly interested (specifically to see the shutdown code). Is it possible you can re-do and ensure both Flutter Run and Observatory are ticked for the log?
DanTup
on 7 Sep 2018
I don't know if it's the same issue as this, but I was just trying to set a command up to use Ctrl+Shift+F5 when not debugging. However, whenever I press that keybinding it starts a debug session. I believe it's running the Restart Debugging keybind:

However that one has inDebugMode on it and I am not in debug mode :/
DanTup
on 19 Sep 2018
Scratch that last comment - I had a typo which meant my keybinding wasn't valid. Seems to work as expected with that fixed. I think maybe Cmd+Shift+F5 is triggering Start Debugging when Restart is not valid.
DanTup
on 19 Sep 2018
Ok people this sounds a lot like an issue I fixed yesterday https://github.com/Microsoft/vscode/issues/59331
One last time I would kindly ask if you can still repro with latest insiders if yes then I would need a volunteer for a skype debugging session so we fix this.
Thanks a lot!
isidorn
on 26 Sep 2018
This issue has been closed automatically because it needs more information and has not had recent activity. See also our issue reporting guidelines.
Happy Coding!
![vscodebot[bot] picture](https://avatars2.githubusercontent.com/in/2406?v=4&s=40) vscodebot[bot]
on 4 Oct 2018
vscodebot[bot]
on 4 Oct 2018
Dup of https://github.com/Microsoft/vscode/issues/60191
Fixed in tomorrows insiders
isidorn
on 9 Oct 2018
Related issues
 villiv
·
3Comments
villiv
·
3Comments
 borekb
·
3Comments
borekb
·
3Comments
 trstringer
·
3Comments
trstringer
·
3Comments
 philipgiuliani
·
3Comments
philipgiuliani
·
3Comments
 curtw
·
3Comments
curtw
·
3Comments
Most helpful comment
It's happening to me too, but with Golang.