Vscode: showOpenDialog API on ubuntu will make systen crash
- VSCode Version: 1.24.1
- OS Version: Ubuntu 17.04
Steps to Reproduce (use Azure Functions extension):

- Click 'Create New Project'
- Click 'Browse'
- Folder dialog is opened
- Then the system crashed (could not do anything on system)
Steps to Reproduce (use Azure IoT Toolkit extension):
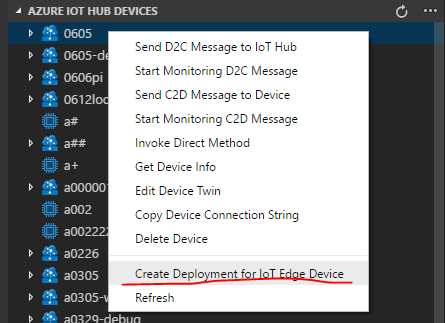
- Create an IoT Edge device
- Select "Create Deployment for IoT Edge Device"
- Folder dialog is opened
- Then the system crashed (could not do anything on system)
 formulahendry
All 27 comments
(Experimental duplicate detection)
Thanks for submitting this issue. Please also check if it is already covered by an existing one, like:
![vscodebot[bot] picture](https://avatars2.githubusercontent.com/in/2406?v=4&s=40) vscodebot[bot]
on 25 Jun 2018
vscodebot[bot]
on 25 Jun 2018
Can you please follow the steps in https://github.com/Microsoft/vscode/wiki/Native-Crash-Issues to get at more details around the crash and attach the result here? Thanks!
 bpasero
on 25 Jun 2018
bpasero
on 25 Jun 2018
Hi @bpasero , thanks for the fast response! It seems the steps is for the crash of VS Code? However, this issue is crash of the OS (Ubuntu), nothing I could do unless I force reboot the system. (Please point out if I an wrong)
formulahendry
on 25 Jun 2018
@formulahendry so does the dialog open and then everything freezes?
bpasero
on 25 Jun 2018
Yes, dialog opens and everything freezes
formulahendry
on 25 Jun 2018
Please see if you can find any logged output that could help us find the source of the issue:
- run
code --verbosefrom the command line and attach the output - in Code select Help | Toggle Developer Tools and select the Console
- attach any output you see in the Console you can find
Thanks!
bpasero
on 25 Jun 2018
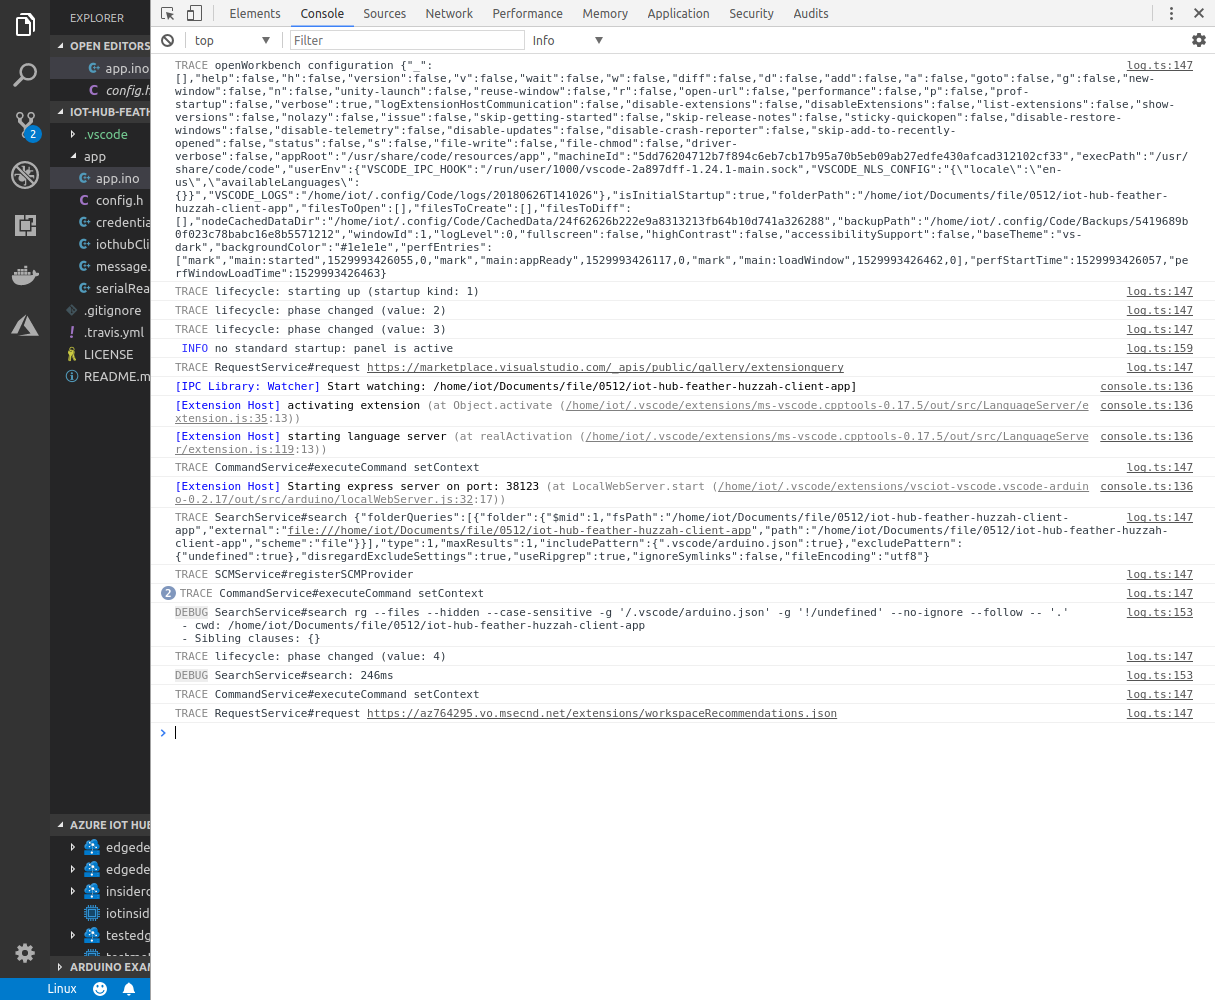
Please see the below logs, let me know if you need you more info.
formulahendry
on 26 Jun 2018
- VSCode version: 1.24.1
- OS Version: Ubuntu 16.04.4 LTS, Gnome
I can replicate this problem using the steps outlined, but have also been having this same issue with other dialogs being opened, such as the "You have unsaved changes" box on switching to another project via Project Manager. It completely locks up the desktop environment.
I can switch to command line, and kill the code process, which allows me to return to the desktop environment as it was, no longer in a hung state.
The output from code --verbose when this happens via steps above:
[21657:0628/105447.920978:INFO:CONSOLE(268)] "%c[IPC Library: Watcher] %c >> normalized", source: file:///usr/share/code/resources/app/out/vs/workbench/workbench.main.js (268)
[21657:0628/105447.936986:INFO:CONSOLE(1310)] "%cTRACE", source: file:///usr/share/code/resources/app/out/vs/workbench/workbench.main.js (1310)
[21657:0628/105448.770193:INFO:CONSOLE(1310)] "%cTRACE", source: file:///usr/share/code/resources/app/out/vs/workbench/workbench.main.js (1310)
[21657:0628/105449.545579:INFO:CONSOLE(268)] "%c[IPC Library: Watcher] %c[CHANGED]", source: file:///usr/share/code/resources/app/out/vs/workbench/workbench.main.js (268)
[21657:0628/105449.596014:INFO:CONSOLE(268)] "%c[IPC Library: Watcher] %c >> normalized", source: file:///usr/share/code/resources/app/out/vs/workbench/workbench.main.js (268)
[21657:0628/105449.664238:INFO:CONSOLE(268)] "%c[IPC Library: Watcher] %c[ADDED]", source: file:///usr/share/code/resources/app/out/vs/workbench/workbench.main.js (268)
[21657:0628/105449.705083:INFO:CONSOLE(1310)] "%cTRACE", source: file:///usr/share/code/resources/app/out/vs/workbench/workbench.main.js (1310)
[21657:0628/105449.714550:INFO:CONSOLE(268)] "%c[IPC Library: Watcher] %c >> normalized", source: file:///usr/share/code/resources/app/out/vs/workbench/workbench.main.js (268)
[21657:0628/105449.768887:INFO:CONSOLE(268)] "%c[IPC Library: Watcher] %c[DELETED]", source: file:///usr/share/code/resources/app/out/vs/workbench/workbench.main.js (268)
[21657:0628/105449.819199:INFO:CONSOLE(268)] "%c[IPC Library: Watcher] %c >> normalized", source: file:///usr/share/code/resources/app/out/vs/workbench/workbench.main.js (268)
[21657:0628/105455.329942:INFO:CONSOLE(1310)] "%cTRACE", source: file:///usr/share/code/resources/app/out/vs/workbench/workbench.main.js (1310)
[21657:0628/105501.119330:INFO:CONSOLE(1310)] "%cTRACE", source: file:///usr/share/code/resources/app/out/vs/workbench/workbench.main.js (1310)
[21657:0628/105502.247707:INFO:CONSOLE(1310)] "%cTRACE", source: file:///usr/share/code/resources/app/out/vs/workbench/workbench.main.js (1310)
[21657:0628/105503.263649:INFO:CONSOLE(1310)] "%cTRACE", source: file:///usr/share/code/resources/app/out/vs/workbench/workbench.main.js (1310)
[21657:0628/105504.410088:INFO:CONSOLE(1310)] "%cTRACE", source: file:///usr/share/code/resources/app/out/vs/workbench/workbench.main.js (1310)
[21657:0628/105516.023972:INFO:CONSOLE(1310)] "%cTRACE", source: file:///usr/share/code/resources/app/out/vs/workbench/workbench.main.js (1310)
[main 10:55:17] windowsService#showOpenDialog 1
/usr/bin/code: line 35: 21650 Killed                  ELECTRON_RUN_AS_NODE=1 "$ELECTRON" "$CLI" "$@"
And the output from switching projects and having the "Unsaved changes" box appear:
[23334:0628/110035.948349:INFO:CONSOLE(1310)] "%cTRACE", source: file:///usr/share/code/resources/app/out/vs/workbench/workbench.main.js (1310)
[main 11:00:54] update#checkForUpdates, state =  idle
[main 11:00:54] update#setState checking for updates
[main 11:00:54] RequestService#request https://vscode-update.azurewebsites.net/api/update/linux-x64/stable/24f62626b222e9a8313213fb64b10d741a326288
[main 11:00:55] update#setState idle
[23334:0628/110313.183565:INFO:CONSOLE(1310)] "%cTRACE", source: file:///usr/share/code/resources/app/out/vs/workbench/workbench.main.js (1310)
[23334:0628/110315.242763:INFO:CONSOLE(1310)] "%cTRACE", source: file:///usr/share/code/resources/app/out/vs/workbench/workbench.main.js (1310)
[23334:0628/110315.253314:INFO:CONSOLE(1310)] "%cTRACE", source: file:///usr/share/code/resources/app/out/vs/workbench/workbench.main.js (1310)
[23334:0628/110316.009171:INFO:CONSOLE(1310)] "%cTRACE", source: file:///usr/share/code/resources/app/out/vs/workbench/workbench.main.js (1310)
[23334:0628/110316.009598:INFO:CONSOLE(1310)] "%cTRACE", source: file:///usr/share/code/resources/app/out/vs/workbench/workbench.main.js (1310)
[main 11:03:16] windowsService#openWindow
[main 11:03:16] Lifecycle#unload() 1
[23334:0628/110316.020949:INFO:CONSOLE(1310)] "%cTRACE", source: file:///usr/share/code/resources/app/out/vs/workbench/workbench.main.js (1310)
[main 11:03:16] windowsService#getWindowCount
[main 11:03:16] windowsService#showMessageBox 1
[1]    23321 killed     code --verbose
The final lines are from me killing the process.
EDIT: Adding to this, if I try closing a file with unsaved changes, the dialog pop up is responsive, and allows me to continue. The issue only arises when the dialog is triggered by attempting to switch projects. To ensure that no other extensions are causing it - I disabled all extensions except Project Manager and the issue is still there.
 sjdawson
on 28 Jun 2018
sjdawson
on 28 Jun 2018
@formulahendry @sjdawson can you reproduce this issue from another build ("Code Exploration") that uses GTK3 for native dialogs: https://az764295.vo.msecnd.net/exploration/163e64ca7bbd0a69c727cfd9f5610e7546207a71/code-exploration_1.24.0-1526535091_amd64.deb
?
bpasero
on 28 Jun 2018
Sure, here's the results from me:
Using @formulahendry's method above, the dialog opens fine, and the system remains usable and stable. The process that causes it for me, however, still causes the system to hang (that is changing a project via the Project Manager extension when there is an unsaved file). Output from --verbose is the same for both processes, with the exception of a different timestamp:
[main 13:21:41] windowsService#showOpenDialog 1
Gtk-Message: GtkDialog mapped without a transient parent. This is discouraged.
I've managed to recreate this issue with all plugins disabled (leaving only built-in ones active), on both current release and code exploration builds. Steps to recreate:
- Open a folder that is a git repository.
- Create some files / make some changes that would make the repository "dirty".
- Use the "Git: Checkout to" command from the palette, or via the branch name in the status bar.
- Choose another branch to checkout, which should fail, as the current branch needs cleaning.
The dialog that pops up at this point causes the system to enter a hung state as noted earlier.
sjdawson
on 28 Jun 2018
Updated to 1.25.0 this morning, just a quick confirmation that the bug is still present in this release.
sjdawson
on 6 Jul 2018
@bpasero
vscode version:1.25.1
os:ubuntu 18.04
i can give some information:
(1) i install ubuntu 18 recently
(2) the system freezes hourly when i use chrome and vscode,sometimes,i can move cursor,but nothing else,and sometimes,nothing can move.
(3) i resolve freezes cause by chrome(freeze 5~10 times each day):
a) when chrome cause this problem,i find large number logs in syslog:
org.gnome.Shell.desktop[4440]:
[16084:16084:0801/110711.157520:ERROR:gl_surface_presentation_helper.cc(115)]
       GetVSyncParametersIfAvailable() failed!
b)i google this problem,https://www.camratus.com/2017/09/18/chrome-on-ubuntu-fix-some-gpu-problem
c) i think it relate to gpu,so i disable gpu in chrome(Hardware Acceleration)
d) it work fine,it not freeze my system so far(about a week that not happen)
(4) i resolve freezes cause by vscode(freeze 10 times each day,i am a coder)
a) it happen when some dialog show(such as when press f5 and has some eslint error,it throw a dialog
to confirm if continue or stop)
b)sometimes,i can call out shell,execute:pkill code(run two time),maybe the second command will kill
the dialog,and system will recovery.
c)i want resolve this problem,and try run code --disable-gpu
d) it work fine!it not freeze my system by now(about a week that not happen)
(5)ok,those are all my information,i do not know which is the root cause.i guess vscode relate to electron,electron relate to chrome?
(6)anyhow,i think it relate to my gpu or gpu driver
(7) i hope it can be resolve,but not to disable gpu
 lerit
on 1 Aug 2018
lerit
on 1 Aug 2018
Updated to the 1.26 release this morning, and can still get the bug to occur.
However, I've noticed this morning that the arrow keys still navigate the buttons on the dialog. Enter will select the button and proceed, and Escape will still allow you to close the dialog without making a specific choice. I'm not sure if this was a thing before 1.26 as I've managed to avoid the processes that would cause this error as much as possible.
Whilst still not ideal, this is a much better stop-gap than my previous tact of having to drop out to the terminal and kill code completely. :joy:
sjdawson
on 14 Aug 2018
@formulahendry
Can you try to reproduce with our nightly insider builds? You can give our preview releases a try from: https://code.visualstudio.com/insiders/
bpasero
on 19 Sep 2018
@bpasero although not aimed at me, I tried the steps I outlined here: https://github.com/Microsoft/vscode/issues/52778#issuecomment-401064283 with the latest insider build, which is still causing VS code to hang the desktop environment to all but keyboard input with the dialog.
Verbose output:
[15132:0919/150615.291388:INFO:CONSOLE(1411)] "%cTRACE", source: file:///usr/share/code-insiders/resources/app/out/vs/workbench/workbench.main.js (1411)
[15132:0919/150615.291496:INFO:CONSOLE(1411)] "%cTRACE", source: file:///usr/share/code-insiders/resources/app/out/vs/workbench/workbench.main.js (1411)
[15132:0919/150616.709422:INFO:CONSOLE(276)] "%c[IPC Library: File Watcher (chokidar)] %c[ADDED]", source: file:///usr/share/code-insiders/resources/app/out/vs/workbench/workbench.main.js (276)
[15132:0919/150616.714287:INFO:CONSOLE(276)] "%c[IPC Library: File Watcher (chokidar)] %c[CHANGED]", source: file:///usr/share/code-insiders/resources/app/out/vs/workbench/workbench.main.js (276)
[15132:0919/150616.721433:INFO:CONSOLE(276)] "%c[IPC Library: File Watcher (chokidar)] %c[CHANGED]", source: file:///usr/share/code-insiders/resources/app/out/vs/workbench/workbench.main.js (276)
[15132:0919/150616.751594:INFO:CONSOLE(1411)] "%cTRACE", source: file:///usr/share/code-insiders/resources/app/out/vs/workbench/workbench.main.js (1411)
[15132:0919/150616.773921:INFO:CONSOLE(276)] "%c[IPC Library: File Watcher (chokidar)] %c >> normalized", source: file:///usr/share/code-insiders/resources/app/out/vs/workbench/workbench.main.js (276)
[15132:0919/150616.773969:INFO:CONSOLE(276)] "%c[IPC Library: File Watcher (chokidar)] %c >> normalized", source: file:///usr/share/code-insiders/resources/app/out/vs/workbench/workbench.main.js (276)
[15132:0919/150616.795137:INFO:CONSOLE(1411)] "%cTRACE", source: file:///usr/share/code-insiders/resources/app/out/vs/workbench/workbench.main.js (1411)
[main 15:06:16] windowsService#showMessageBox 1
Gtk-Message: GtkDialog mapped without a transient parent. This is discouraged.
[15132:0919/150616.858950:INFO:CONSOLE(276)] "%c[IPC Library: File Watcher (chokidar)] %c[DELETED]", source: file:///usr/share/code-insiders/resources/app/out/vs/workbench/workbench.main.js (276)
[15132:0919/150616.872025:INFO:CONSOLE(276)] "%c[IPC Library: File Watcher (chokidar)] %c >> normalized", source: file:///usr/share/code-insiders/resources/app/out/vs/workbench/workbench.main.js (276)
[15132:0919/150625.074549:INFO:CONSOLE(1411)] "%cTRACE", source: file:///usr/share/code-insiders/resources/app/out/vs/workbench/workbench.main.js (1411)
[15132:0919/150625.115128:INFO:CONSOLE(276)] "%c[IPC Library: File Watcher (chokidar)] %c[ADDED]", source: file:///usr/share/code-insiders/resources/app/out/vs/workbench/workbench.main.js (276)
[15132:0919/150625.145146:INFO:CONSOLE(1411)] "%cTRACE", source: file:///usr/share/code-insiders/resources/app/out/vs/workbench/workbench.main.js (1411)
[15132:0919/150625.152124:INFO:CONSOLE(276)] "%c[IPC Library: File Watcher (chokidar)] %c >> normalized", source: file:///usr/share/code-insiders/resources/app/out/vs/workbench/workbench.main.js (276)
[15132:0919/150625.211019:INFO:CONSOLE(276)] "%c[IPC Library: File Watcher (chokidar)] %c[DELETED]", source: file:///usr/share/code-insiders/resources/app/out/vs/workbench/workbench.main.js (276)
[15132:0919/150625.261647:INFO:CONSOLE(276)] "%c[IPC Library: File Watcher (chokidar)] %c >> normalized", source: file:///usr/share/code-insiders/resources/app/out/vs/workbench/workbench.main.js (276)
Also happening in latest live build, 1.27.2
sjdawson
on 19 Sep 2018
We are building exploration builds that use a much newer version of Electron (our UI framework). I wonder if this issue reproduces with one of these builds, could you try? Download:
bpasero
on 19 Sep 2018
Sure,
Sadly, the same problem is present in the exploration build; output of code-exploration --verbose (some pathnames snipped for privacy):
[24088:0919/153249.824553:INFO:CONSOLE(285)] "%c[IPC Library: File Watcher (chokidar)] %c[ADDED] {snip}/.git/index.lock", source: file:///usr/share/code-exploration/resources/app/out/vs/workbench/workbench.main.js (285)
[24088:0919/153249.839096:INFO:CONSOLE(1408)] "%cTRACE", source: file:///usr/share/code-exploration/resources/app/out/vs/workbench/workbench.main.js (1408)
[main 15:32:49] windowsService#showMessageBox 1
Gtk-Message: GtkDialog mapped without a transient parent. This is discouraged.


md5-d9686c0a35bfe355655e67a66f24f288


[24088:0919/153249.900893:INFO:CONSOLE(285)] "%c[IPC Library: File Watcher (chokidar)] %c >> normalized  [ADDED] {snip}/.git/index.lock", source: file:///usr/share/code-exploration/resources/app/out/vs/workbench/workbench.main.js (285)
[24088:0919/153249.940795:INFO:CONSOLE(285)] "%c[IPC Library: File Watcher (chokidar)] %c[DELETED] {snip}/.git/index.lock", source: file:///usr/share/code-exploration/resources/app/out/vs/workbench/workbench.main.js (285)
[24088:0919/153249.991463:INFO:CONSOLE(285)] "%c[IPC Library: File Watcher (chokidar)] %c >> normalized  [DELETED] {snip}/.git/index.lock", source: file:///usr/share/code-exploration/resources/app/out/vs/workbench/workbench.main.js (285)
[24088:0919/153256.084401:INFO:CONSOLE(1408)] "%cTRACE", source: file:///usr/share/code-exploration/resources/app/out/vs/workbench/workbench.main.js (1408)
[24088:0919/153256.085264:INFO:CONSOLE(1408)] "%cTRACE", source: file:///usr/share/code-exploration/resources/app/out/vs/workbench/workbench.main.js (1408)
The middle of the three blocks is the message in the console at the exact time the dialog is displayed.
sjdawson
on 19 Sep 2018
@sjdawson I think the output is something I have also seen. What happens in VSCode when the dialog opens?
bpasero
on 19 Sep 2018
Interestingly, after testing that build and swapping back to stable, I opened the same repository as where I was testing. Since it was still in the "dirty" state, I followed the same process to change my branch.
To my surprise, I was able to close the dialog using the mouse - no hang ups occurred. (Though the same error message about transient parent was visible in the output).
I seemed to be able to repeatedly do this in quick succession, every time I start VSCode. Then, after a short while, it would stop working.
I repeated this process using code --verbose multiple times, it looked like code was checking for updates about the same time that the dialogs stop working. I believe that to be entirely coincidental though, as I disabled background updates and set the update channel to none, and still had the dialogs stop working a short time after launching. Seems like something runs, around 30s into VSCode's launch that stops the dialogs from working.
What happens in VSCode when the dialog opens?
VSCode just sits in the background, dimmed, waiting for input to the dialog. There's no other changes.
As a secondary test, I ran htop in the integrated terminal, just to see if VSCode was fully hanging or not, when the dialog pops up, htop keeps updating, so it doesn't look like it's completely hanging VSCode.
Log (Window) shows the following:
[2018-09-19 15:55:35.657] [renderer1] [trace] CommandService#executeCommand _internal_command_delegation_1537368730599
[2018-09-19 15:55:35.789] [renderer1] [trace] CommandService#executeCommand setContext
[2018-09-19 15:55:37.702] [renderer1] [trace] DialogService#show Please clean your repository working tree before checkout.
Weird, I cannot explain that behaviour...
bpasero
on 19 Sep 2018
Yeah, certainly is weird. Got to my machine this morning, and even though code had been open for a while (around 10 minutes), the first appearance of the dialog worked okay. But on the second appearance, it hung.
Nothing appears/updates in Developer Tools console when this happens, either.
sjdawson
on 20 Sep 2018
In some debugging with @jakeeyturner on the issue above; noticed that not only does the vscode instance that opened the dialog freezes - but every other instance of vscode freezes as regards mouse input (there some response to the keyboard)
Not tried with whether another installation of vscode freezes as well;
This is also running inside virtual box - and there is no graphics acceleration enabled.
 mbwhite
on 19 Oct 2018
mbwhite
on 19 Oct 2018
In trying to get information about the problem I was single stepping through the code; observed that when doing this the dialog always worked corrected. Past experience (with other multi-threaded non-nodejs systems) says that when something works when stopped in the debugger then there's a high chance of threading issues.
Along the lines of https://expertcodeblog.wordpress.com/2018/07/05/typescript-how-to-sleep-a-thread/ I added a sleep directly before the open dialog.
    await UserInputUtil.delay(200);
    const folderSelect: vscode.Uri[]  await vscode.window.showOpenDialog(openDialogOptions);
A 200ms delay immediately before requesting the dialog be opened - is appearing to rectify the issue on my machine (VirtualBox 5.2.20 hosted Ubuntu 17.10). I started at 500ms and worked my way down. Not gone much lower to be honest as when it hands the restart process takes time.
The position of this delay does strike me as odd in that there is nothing at this point has started to open dialogs.
Would be interested to know if this approach solves the issues for others.
mbwhite
on 22 Oct 2018
I single stepped through some of the showOpenDialog code; in doing show I noticed that the dialog would always subsequently work correctly. Past experience in other multi-threaded systems suggests that behaviour that works when under debugger control is often threading related.
As such I added a 200ms timeout before the code, for example.
                await UserInputUtil.delayWorkaround(200);
                const fileBrowser: vscode.Uri[] = await vscode.window.showOpenDialog({
                    canSelectFiles: true,
                    canSelectFolders: false,
                    canSelectMany: false,
                    openLabel: 'Select'
                });
The delayWorkaround function is simply
  public static delayWorkaround(ms: number) {
    return new Promise((resolve) => setTimeout(resolve, ms));
  }
In all testing on my Ubuntu 17.10 inside VirtualBox 5.2 this has proved to be stable at solving the problem. The placement though is still puzzles me as to the real cause of the problem - this pause is before any dialog has been open. Assuming that the pause lets, other UI events be processed?
200ms is significant in that it was a small value that wasn't noticeable. I've not worked to lower the value at all.
Would be interested in if any others can try this approach.
mbwhite
on 22 Oct 2018
We are building exploration builds that use a much newer version of our UI framework (Electron version 6.0.x). I wonder if this issue reproduces with one of these builds, could you try? Download:
bpasero
on 8 Oct 2019
@bpasero thanks for the update!!
I've given a test run of our extension built by team here - and I can't recreate any problems :-)
mbwhite
on 9 Oct 2019
Related issues
 NikosEfthias
·
3Comments
NikosEfthias
·
3Comments
 biij5698
·
3Comments
biij5698
·
3Comments
 shanalikhan
·
3Comments
shanalikhan
·
3Comments
 DovydasNavickas
·
3Comments
DovydasNavickas
·
3Comments
 borekb
·
3Comments
borekb
·
3Comments