Vscode: Code Helper running at 100% CPU
Issue Type: Performance Issue
My Macbook Pro turned into a space heater after the CPU was pegged out. The process that was running over 100% was Code Helper. This happened while VS Code did not have focus (I was using Chrome at the moment).
Here's some process Info
cwd
/
txt
/Applications/Visual Studio Code.app/Contents/Frameworks/Code Helper.app/Contents/MacOS/Code Helper
txt
/Applications/Visual Studio Code.app/Contents/Frameworks/Electron Framework.framework/Versions/A/Electron Framework
txt
/Applications/Visual Studio Code.app/Contents/Frameworks/Squirrel.framework/Versions/A/Squirrel
txt
/Applications/Visual Studio Code.app/Contents/Frameworks/ReactiveCocoa.framework/Versions/A/ReactiveCocoa
txt
/Applications/Visual Studio Code.app/Contents/Frameworks/Mantle.framework/Versions/A/Mantle
txt
/usr/lib/libSystem.B.dylib
txt
/Applications/Visual Studio Code.app/Contents/Frameworks/Electron Framework.framework/Versions/A/Libraries/libnode.dylib
txt
/System/Library/Frameworks/IOKit.framework/Versions/A/IOKit
txt
/Applications/Visual Studio Code.app/Contents/Frameworks/Electron Framework.framework/Versions/A/Libraries/libffmpeg.dylib
txt
/System/Library/Frameworks/AVFoundation.framework/Versions/A/AVFoundation
txt
/System/Library/Frameworks/CoreMIDI.framework/Versions/A/CoreMIDI
txt
/usr/lib/libsandbox.1.dylib
txt
/System/Library/Frameworks/CFNetwork.framework/Versions/A/CFNetwork
txt
/usr/lib/system/libdyld.dylib
txt
/usr/lib/system/libsystem_kernel.dylib
txt
/usr/lib/system/libsystem_sandbox.dylib
txt
/usr/lib/system/libkxld.dylib
txt
/usr/lib/libexpat.1.dylib
txt
/Applications/Visual Studio Code.app/Contents/Frameworks/Electron Framework.framework/Versions/A/Resources/icudtl.dat
txt
/Applications/Visual Studio Code.app/Contents/Frameworks/Electron Framework.framework/Versions/A/Resources/snapshot_blob.bin
txt
/Applications/Visual Studio Code.app/Contents/Frameworks/Electron Framework.framework/Versions/A/Resources/natives_blob.bin
txt
/usr/lib/dyld
txt
/usr/share/icu/icudt57l.dat
txt
/private/var/db/dyld/dyld_shared_cache_x86_64h
0
->0x85804365c3c335e9
1
->0x85804365c3c33e81
2
->0x85804365c3c34651
3
->0x85804365c3c32c89
4
/Applications/Visual Studio Code.app/Contents/Frameworks/Electron Framework.framework/Versions/A/Resources/icudtl.dat
5
->0x85804365be2f4589
6
->0x85804365be2f29c9
7
count=3, state=0x8
8
->0x85804365be2f4649
9
->0x85804365be2f2909
10
->0x85804365be2f4889
11
->0x85804365be2f2fc9
12
/Applications/Visual Studio Code.app/Contents/Frameworks/Electron Framework.framework/Versions/A/Resources/snapshot_blob.bin
13
/Applications/Visual Studio Code.app/Contents/Frameworks/Electron Framework.framework/Versions/A/Resources/natives_blob.bin
14
/dev/urandom
15
/dev/null
16
->0x85804365b2e34e19
17
->0x858043659a67e4b9
18
->0x85804365beba7589
19
/var/folders/vw/b6mdptss0rn3q6h3p4247g_ngjctjp/T/vscode-d6b7e6916e601fcfe937153579a61f3c91b36f61.sock
24
->0x85804365ba38ab61
25
/Applications/Visual Studio Code.app/Contents/Resources/electron.asar
26
/Applications/Visual Studio Code.app/Contents/Resources/app/node_modules.asar
27
/Applications/Visual Studio Code.app/Contents/Resources/app/node_modules.asar
VS Code version: Code 1.24.0 (6a6e02cef0f2122ee1469765b704faf5d0e0d859, 2018-06-06T17:30:30.113Z)
OS version: Darwin x64 16.7.0
System Info
|Item|Value|
|---|---|
|CPUs|Intel(R) Core(TM) i7-4770HQ CPU @ 2.20GHz (8 x 2200)|
|GPU Status|2d_canvas: enabled
flash_3d: enabled
flash_stage3d: enabled
flash_stage3d_baseline: enabled
gpu_compositing: enabled
multiple_raster_threads: enabled_on
native_gpu_memory_buffers: enabled
rasterization: enabled
video_decode: enabled
video_encode: enabled
vpx_decode: enabled
webgl: enabled
webgl2: enabled|
|Load (avg)|3, 3, 2|
|Memory (System)|16.00GB (2.56GB free)|
|Process Argv|/Applications/Visual Studio Code.app/Contents/MacOS/Electron|
|Screen Reader|no|
|VM|0%|
Process Info
CPU %   Mem MB     PID  Process
   12       98   31071  code main
    0      115   31072     gpu-process
    0      246   31073     window (component.js — sa-ui)
    0       98   31248       extensionHost
    0       49   31272         electron_node jsonServerMain.js
  100      246   34066         electron_node electronForkStart.js tsserver.js
    0       66   34071           electron_node typingsInstaller.js tsserver.js typesMap.js
    0       82   34067         electron_node eslintServer.js
    0      115   31249       watcherService
    0       66   34068       searchService
    0       82   31074     shared-process
    0       98   37380     shared-process
    0        0   37382     /bin/ps -ax -o pid=,ppid=,pcpu=,pmem=,command=
Workspace Info
|  Window (component.js — sa-ui)
|    Folder (sa-ui): more than 51748 files
|      File types: js(36435) scss(3430) css(2393) json(1038) png(1029) md(831)
|                  hbs(688) gitkeep(677) map(628) html(515)
|      Conf files: package.json(573) gulp.js(13) jsconfig.json(12)
|                  launch.json(2) makefile(1) settings.json(1);
Extensions (11)
Extension|Author (truncated)|Version
---|---|---
ember-module-snippets|can|1.1.0
vscode-eslint|dba|1.4.12
vscode-babel-coloring|dza|0.0.4
emberjs|emb|1.0.1
vscode-ember|emb|0.2.0
json-tools|eri|1.0.2
vsc-ember-cli|fel|0.3.3
vscode-ember-snow|gtb|0.0.1
ember-related-files|jos|1.3.0
EmberES6Snippets|pha|2.3.3
ayu|tea|0.14.0
 gtb104
All 42 comments
What is the deal with these crazy code helpers since the last update. My Macbook Pro's CPU is going over 100%. So frustrating ...
 velozmontero
on 13 Jun 2018
velozmontero
on 13 Jun 2018
CPU %   Mem MB     PID  Process
   12       98   31071  code main
    0      115   31072     gpu-process
    0      246   31073     window (component.js — sa-ui)
    0       98   31248       extensionHost
    0       49   31272         electron_node jsonServerMain.js
  100      246   34066         electron_node electronForkStart.js tsserver.js
    0       66   34071           electron_node typingsInstaller.js tsserver.js typesMap.js
    0       82   34067         electron_node eslintServer.js
    0      115   31249       watcherService
    0       66   34068       searchService
    0       82   31074     shared-process
    0       98   37380     shared-process
    0        0   37382     /bin/ps -ax -o pid=,ppid=,pcpu=,pmem=,command=
From the process info, it looks like the typescript server is causing the problem
 RMacfarlane
on 13 Jun 2018
RMacfarlane
on 13 Jun 2018
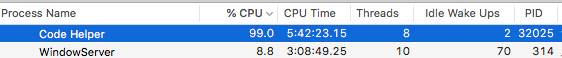
I'm tempted to open a new issue but I'll just add to this one. Last time I opened an issue about the crazy Code Helper.. which btw doesn't even quit after you quit VSCode!!!!!!!!!!
The only unhelpful reply I got was to use the 'Open Process Explorer' from the help menu to try and debug the problem
Well yet again my Code Helper in Activity Monitor was going at 99% CPU.. and I did use the Open Process Explorer and it was not helpful at all! See below screenshots! These were taken at the same time!

 vesper8
on 17 Jun 2018
vesper8
on 17 Jun 2018
@gtb104 Please test in the latest vscode insiders build with all extensions disabled. If you still see the issue, try upgrading your workspace to typescript@next by following these instructions
 mjbvz
on 19 Jun 2018
mjbvz
on 19 Jun 2018
@mjbvz It happens to me a lot on mac with all versions including the very last insider build.
It mostly happens with projects with very big .d.ts files.
I can almost always reproduce it after working for a while with nativescript projects. They use an android.d.ts which is really big.
 farfromrefug
on 20 Jun 2018
farfromrefug
on 20 Jun 2018
@mjbvz is there any way to get a tsserver log file? I am having the issue right now. If i could enable a log and get it for you i think it would greatly help

farfromrefug
on 21 Jun 2018
To collect the TS Server log:
- Set
"typescript.tsserver.log": "verbose", - Restart VS Code and reproduce the problem
- In VS Code, run the
TypeScript: Open TS Server logcommand - This should open a folder with a
tsserver.logfile in it
Look though that log file for errors or stack traces. If you can share the log, I can also take a look to see if anything stands out
⚠️Warning: The TypeScript log may include information from your workspace, including file paths and source code. If you have any concerns about posting this publicly on Github, just let me know and we can arrange something else. On our side, we only use these logs to investigate issues like this
mjbvz
on 27 Jun 2018
@mjbvz just facing it right now. CPU to 100%, vscode stuck searching after trying to click on a reference to open it.
Here is my log file. I hope you will find something
tsserver.log
EDIT: @mjbvz here is another one i am having right now (different project). This is one is quite big but might have more info
tsserver.log.zip
farfromrefug
on 28 Jun 2018
I am experiencing this issue too on my macbook and imac, both running macOS HS 10.13.5. The process continues even when VSCode is closed.

 tomastech
on 2 Jul 2018
tomastech
on 2 Jul 2018
so how to fix
 bailitugesu
on 10 Jul 2018
bailitugesu
on 10 Jul 2018
@farfromrefug Thanks. I don't see anything suspicion in the TS server log. Can you check the full process arguments of the process that has the high cpu usage. Is it the tsserver one?
Also test in VS Code insiders to make sure this is still happening with the latest changes
mjbvz
on 13 Jul 2018
@mjbvz always using the latest insider !
here is the ps aux result:
mguillon 20445 100.0 1.3 5813140 213952 ?? R 11:24AM 70:04.45 /Applications/Visual Studio Code - Insiders.app/Contents/Frameworks/Code - Insiders Helper.app/Contents/MacOS/Code - Insiders Helper /Applications/Visual Studio Code - Insiders.app/Contents/Resources/app/extensions/typescript-language-features/out/utils/electronForkStart.js /Applications/Visual Studio Code - Insiders.app/Contents/Resources/app/extensions/node_modules/typescript/lib/tsserver.js --useInferredProjectPerProjectRoot --enableTelemetry --cancellationPipeName /var/folders/0v/_p69syd96plgy916gb3rcqxm0000gn/T/vscode-tscancellation-e0c55c1261ef6b5976d3.sock* --locale en --noGetErrOnBackgroundUpdate
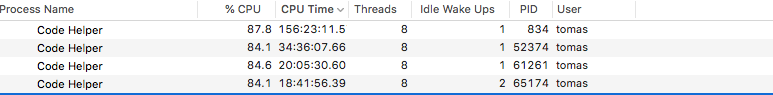
This is happening specially when I have multiple instances of VSCode open. With 3 projects I got at least 12 different Code Helper processes, all of them running at 100% (or more).
Update:
Also happening with Workspaces.
The screenshot above is for one instance of VSCode open with 3 folders within the Workspace.
 leonardorb
on 27 Jul 2018
leonardorb
on 27 Jul 2018
@mjbvz any news on this?
I think you should try to reproduce this. And I think it is doable:
- clone https://github.com/Akylas/nativescript-bluetooth
- open in vscode
- run npm install within the plugin folder
- go into plugin/src/android.
- now the thing is just to play with it, asking for definition, waiting for pop over, and things like that.
- what will put is the big android def file. You can go into it by going to definition for any android.*
That should bring you to android.17.d.ts. That's the big one.
Now I am not sure how fast this will happen but it should. Also as @LeonardoBraga I don't know for sure if it is related to multiple windows. I mostly always have a few opened.
farfromrefug
on 28 Jul 2018
Here the same
Version 1.25.1 (1.25.1)
Mac OS X 10.13.6
no TS only JavaScript
 bitsmakerde
on 29 Jul 2018
bitsmakerde
on 29 Jul 2018
Version: 1.25.1
Debian GNU/Linux buster/sid
Happens with all plug-ins disabled, POJS. Started with the installation of 1.25.0. Code base is quite large, several million lines.
 jayflaherty75
on 31 Jul 2018
jayflaherty75
on 31 Jul 2018
Version: 1.25.1
Mac OS X 10.13.6
On any type of file, after working for a while it takes a few seconds to save a single file. (This also excludes the fact my laptop turns into a space heater once it starts doing this.) A restart fixes it, but it comes back after a while again.
 MastaCoder
on 11 Aug 2018
MastaCoder
on 11 Aug 2018
Mac OSX 10.13.3 (17D47)
Version: 1.26.0-insider (1.26.0-insider) - but its happening for about 8 months...
File 200+ lines in a medium+- TS project - any change / autocomplete /save causes 99% CPU FOREVER.
tried debugging it for 8 hours it seems like many props on an item in a big file cause it to slow down until eventually, it fails.
I can now reproduce it on a whim, but can't do my job and write new code AT ALL.
for the time being, I'm going back to IntelliJ but I'm looking forward for a fix.
I'd be happy to assist if anyone wants to fix it...
 id0Sch
on 12 Aug 2018
id0Sch
on 12 Aug 2018
This one seems to be related https://github.com/Microsoft/vscode/issues/55070
 maxkomarychev
on 13 Aug 2018
maxkomarychev
on 13 Aug 2018
For those who are not using TS. It could be Import Cost plugin.
Here's the issue https://github.com/wix/import-cost/issues/35
Disabling Import Cost completely reduced Code Helper %CPU from 100 to 5.
Until that issue is fixed I would be disabling Import Cost.
 pxwee5
on 17 Aug 2018
pxwee5
on 17 Aug 2018
Don't have Import Cost installed and still experiencing the issue.
MastaCoder
on 17 Aug 2018
Same.
I managed to reproduce this without any plugin enabled / installed.
On Fri, Aug 17, 2018 at 11:56 AM Makan Dey notifications@github.com wrote:
Don't have Import Cost installed and still experiencing the issue.
—
You are receiving this because you commented.
Reply to this email directly, view it on GitHub
https://github.com/Microsoft/vscode/issues/51776#issuecomment-413802275,
or mute the thread
https://github.com/notifications/unsubscribe-auth/AFl9RGP6lBVSyGz338JJhmMf_H0QzZKuks5uRoVOgaJpZM4UmbvI
.
id0Sch
on 17 Aug 2018
I'm not sure if it's 100% related to this bug, but I can reproduce this by running npm install on my Node projects while I have the project folder open in VS Code. I suspect that the Code Helper goes crazy trying to index all of the new files that npm is creating.
 atomdmac
on 17 Aug 2018
atomdmac
on 17 Aug 2018
I don't use TypeScript and I don't have the Import Cost plugin, but sometimes I have the same issue with Code Helper going wild on one of the CPU cores and the culprit is electron_node index.js judging by the process explorer. When this happens to me, I notice there's a progress bar under the _explorer_ label (the one on top of the side bar) running continuously even when there's no file or folder open in the editor. As soon as I kill electron_node index.js from the process explorer, Code Helper stops and the progress bar disappears. Last time happened yesterday, with vscode version 1.26.0 running on macOS 10.12.6.
 nrk
on 18 Aug 2018
nrk
on 18 Aug 2018
@MastaCoder Thanks. My issue went away when I uninstalled Import Cost.
 rwschmitz
on 22 Aug 2018
rwschmitz
on 22 Aug 2018
Probably a TS Server hard bug they can't fix, or maybe a fix that hasn't been released yet.
To temporarily get around this until they have a fix, I turned on logging like the @mjbvz said, figure out which file it is croaking on, add that file or set of files to my "files.exclude", "files.watcherExclude" lists.
 datvong-wm
on 24 Aug 2018
datvong-wm
on 24 Aug 2018
i try to set the 'file.excludes' items but it does not work, then i uninstall the tslint extension, seems the problem fixed now.
 waka992
on 27 Aug 2018
waka992
on 27 Aug 2018
My vscode does not have an extension installed and is consuming 100% CPU in MacBook Pro
 marlonmleite
on 27 Aug 2018
marlonmleite
on 27 Aug 2018
Same here. I constantly have to force quite "Code Helper" which is using 100% CPU on my MacBook using the latest (1.26.1) version.
Edit: Had Import Cost enabled. Will disable and see if this fixes it.
 ghost
on 27 Aug 2018
ghost
on 27 Aug 2018
I'm experiencing this issue is well. My installed extensions are:
Auto Close Tag
Babel ES6/ES7
Document This
ESLint
Flow Language Support
HTML CSS Support
Prettier
Settings Sync
stylus
TODO Highlight
WakaTime
 yourfavorite
on 29 Aug 2018
yourfavorite
on 29 Aug 2018
I've been having the same issue. My _hunch_ is ESLint and Prettier but I'm not sure.
 nathan-dunn
on 1 Sep 2018
nathan-dunn
on 1 Sep 2018
[UPDATE] This has helped immensely (though it does still run around 20-30% after running for a while):
    "eslint.autoFixOnSave": true,
    "eslint.run": "onSave",
    "eslint.provideLintTask": false,
    "[javascript]": {
        "editor.formatOnSave": true,
    },
    "typescript.validate.enable": false,
    "javascript.validate.enable": false,
    "files.watcherExclude": {
        "**": true
    },
    "files.useExperimentalFileWatcher": false,
    "git.ignoreLimitWarning": true
The most effective changes were disabling continuous validation, limiting the watcher and disabling files.useExperimentalFileWatcher.
jayflaherty75
on 4 Sep 2018
Doesn't seem to work. I have node_modules in my exclude and watcherExclude list, but still scanning that directory.
"**/node_modules/**": true
useExperimentalFileWatcher is false by default.
I'm going back to Vim until the next VSCode release comes out.
datvong-wm
on 5 Sep 2018
This message is probably useless for those who will be debugging the issue. But anyways here's "workaround" I made to keep using vscode.
I removed vscode as well as all it's settings and all plugins.
I installed it from scratch and added some most important plugins I use. I see no CPU consumption unless I really do something.
Below is current config I use:
{
  "workbench.colorTheme": "One Dark Pro",
  "editor.fontSize": 14,
  "workbench.editor.enablePreview": false,
  "editor.rulers": [80],
  "workbench.iconTheme": "vscode-icons",
  "prettier.eslintIntegration": true,
  "editor.formatOnPaste": false,
  "editor.formatOnSave": true,
  "editor.formatOnType": false,
  "flow.useNPMPackagedFlow": true,
  "javascript.validate.enable": false,
  "jest.showCoverageOnLoad": true,
  "[yaml]": {
    "editor.formatOnPaste": false,
    "editor.formatOnType": false,
    "editor.formatOnSave": false
  },
  "window.zoomLevel": 0
}
and extensions I installed again
dbaeumer.vscode-eslint
eamodio.gitlens
esbenp.prettier-vscode
flowtype.flow-for-vscode
ms-vsliveshare.vsliveshare
Orta.vscode-jest
robertohuertasm.vscode-icons
vscodevim.vim
zhuangtongfa.Material-theme
here is what my original config looked like and list of original extensions:
{
  "gitlens.advanced.messages": {
    "suppressShowKeyBindingsNotice": true
  },
  "workbench.colorTheme": "One Dark Pro",
  "editor.rulers": [80],
  "editor.formatOnPaste": true,
  "editor.formatOnSave": true,
  "editor.formatOnType": true,
  "prettier.eslintIntegration": true,
  "workbench.iconTheme": "vscode-icons",
  "window.zoomLevel": 0,
  "editor.fontSize": 14,
  "workbench.editor.enablePreviewFromQuickOpen": false,
  "workbench.editor.enablePreview": false,
  "editor.formatOnSaveTimeout": 5000,
  "gitlens.blame.ignoreWhitespace": true,
  "todo-tree.showInExplorer": false,
  "docker.showExplorer": false,
  "[xml]": {
    "editor.formatOnPaste": false,
    "editor.formatOnSave": false,
    "editor.formatOnType": false
  },
  "workbench.sideBar.location": "left",
  "editor.largeFileOptimizations": true,
  "flow.enabled": true,
  "flow.useNPMPackagedFlow": true,
  "eslint.autoFixOnSave": true,
  "javascript.validate.enable": false,
  "editor.minimap.enabled": false,
  "eslint.enable": true,
  "liveshare.guestApprovalRequired": true,
  "flow.showUncovered": false
}
RoscoP.ActiveFileInStatusBar
alexkrechik.cucumberautocomplete
dbaeumer.vscode-eslint
DotJoshJohnson.xml
eamodio.gitlens
emilast.LogFileHighlighter
esbenp.prettier-vscode
flowtype.flow-for-vscode
formulahendry.auto-close-tag
formulahendry.auto-rename-tag
Gruntfuggly.todo-tree
ionutvmi.path-autocomplete
jdforsythe.add-new-line-to-files
jpoissonnier.vscode-styled-components
mikestead.dotenv
ms-python.python
ms-vscode.cpptools
ms-vscode.Go
ms-vscode.node-debug2
ms-vsliveshare.vsliveshare
msjsdiag.debugger-for-chrome
Orta.vscode-jest
patrys.vscode-code-outline
PeterJausovec.vscode-docker
redhat.java
robertohuertasm.vscode-icons
sadesyllas.explorer-excluded-files
shd101wyy.markdown-preview-enhanced
sleistner.vscode-fileutils
tomphilbin.lodash-snippets
vscjava.vscode-java-debug
vscjava.vscode-java-pack
vscjava.vscode-java-test
vscjava.vscode-maven
vscodevim.vim
vsmobile.vscode-react-native
wayou.vscode-todo-highlight
yaruson.ascii-unicode-escape
yzhang.markdown-all-in-one
zhuangtongfa.Material-theme
Closing this issue as it has become a catch-all for many unrelated performance problems and we never heard back from @gtb104
If you are still seeing performance issues, please open a new issue so we can investigate your problem individually
mjbvz
on 8 Sep 2018
@mjbvz, sorry, I seem to have missed the notification for this issue. I just upgraded to 1.27.2. If I see any issues I'll open a new issue.
gtb104
on 14 Sep 2018
I had this issue a couple days ago. It went away when I uncommented "typescript.validate.enable": true in my global settings, altho I wasn't even working in a typescript project - no tsconfig / jsconfig.
 jcrben
on 16 Sep 2018
jcrben
on 16 Sep 2018
I had the same issue: Code Helper using 100+% CPU when large projects are open, even when all extensions were disabled. The problem is completely gone now that I turned _on_ "Use Experimental File Watcher" which excludes node_modules from the watch list... (in files.watcherExclude property)
 peterzimon
on 17 Sep 2018
peterzimon
on 17 Sep 2018
I think it's safe to presume the latest update has caused this.
 krazyjakee
on 18 Sep 2018
krazyjakee
on 18 Sep 2018
Disabling extensions is not enough. I solved it by uninstalling ms-vscode.csharp en then reinstalling. Plays nice at around 0.4% now.
 feralventures
on 28 Sep 2018
feralventures
on 28 Sep 2018
I think Code Helper is kind of a shared lib that get's instantiated several times, once per each installed extension that requires/uses it (or not, and i can be totally wrong!).
That's why several users reported the problem got solved when they disabled extension X or Y.
In my case: after several hours facing 99% CPU loading and fiddling with a minimum set of extensions, and even enabling/disabling some extensions settings, I found out that the culprit was the Settings Sync extension.
When I set sync.autoUpload=false all other extensions run nicely and Code Helper started to behave and not stressing out CPU anymore.
Reporting this to extension authors.
 antonio-rodrigues
on 4 Oct 2018
antonio-rodrigues
on 4 Oct 2018
I'm locking this issue because it is not the correct place to report these problems. If you are seeing a bug with high cpu usage, please open a new issue and we will continue to investigate.
High cpu usage usage is a symptom with a very large number of potential root causes, so it usually must be investigated on a case-by-case basis. We will mark your issue as a duplicate if needed
mjbvz
on 4 Oct 2018
Related issues
 lukehoban
·
3Comments
lukehoban
·
3Comments
 trstringer
·
3Comments
trstringer
·
3Comments
 villiv
·
3Comments
villiv
·
3Comments
 NikosEfthias
·
3Comments
NikosEfthias
·
3Comments
 chrisdias
·
3Comments
chrisdias
·
3Comments
Most helpful comment
so how to fix