Vscode: Debug.toolBarLocation :docked doesn't works well
Issue Type: Bug
after updating the vs code I changed my code to
"debug.toolBarLocation": "docked"
This doesn't work all the time, the debugging panel disappears time to time.
VS Code version: Code 1.24.0 (6a6e02cef0f2122ee1469765b704faf5d0e0d859, 2018-06-06T17:35:40.560Z)
OS version: Windows_NT x64 6.3.9600
System Info
|Item|Value|
|---|---|
|CPUs|Intel(R) Core(TM) i3-2120 CPU @ 3.30GHz (4 x 3293)|
|GPU Status|2d_canvas: enabled
flash_3d: enabled
flash_stage3d: enabled
flash_stage3d_baseline: enabled
gpu_compositing: enabled
multiple_raster_threads: enabled_on
native_gpu_memory_buffers: disabled_software
rasterization: unavailable_software
video_decode: enabled
video_encode: enabled
vpx_decode: unavailable_software
webgl: enabled
webgl2: enabled|
|Memory (System)|7.94GB (1.45GB free)|
|Process Argv|C:\Program Files\Microsoft VS Code\Code.exe|
|Screen Reader|no|
|VM|0%|
Extensions (6)
Extension|Author (truncated)|Version
---|---|---
vscode-css-formatter|aes|1.0.1
es7-react-js-snippets|dsz|1.8.2
vscode-babel-coloring|dza|0.0.4
debugger-for-chrome|msj|4.6.0
js-jsx-snippets|sky|0.0.9
vscode-react-native|vsm|0.6.11
(1 theme extensions excluded)
 dholakiyaankit
All 10 comments
I am experiencing the same thing, the UI panel just disappears at times (still running tho)
 cROSs116
on 14 Jun 2018
cROSs116
on 14 Jun 2018
The debugging panel should only appear while you are debugging, that is designed behavior.
If this is not the case then please provide a video showing the issue.
Or exact steps to repro. Thanks
 isidorn
on 14 Jun 2018
isidorn
on 14 Jun 2018
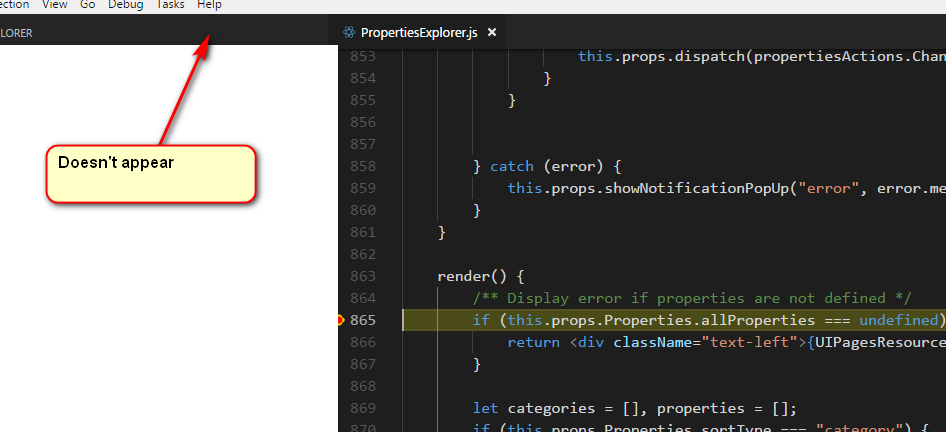
as you can see it doesn't appears event if I am on debugging mode.
For more info:
I have this in my console
Error: Set breakpoints request timed out
    at Timeout.setTimeout [as _onTimeout] (c:\Users\.vscode\extensions\msjsdiag.debugger-for-chrome-4.6.0\node_modules\vscode-chrome-debug-core\out\src\utils.js:71:24)
    at ontimeout (timers.js:386:14)
    at tryOnTimeout (timers.js:250:5)
    at Timer.listOnTimeout (timers.js:214:5)
That error is not connected to this.
You have the explorer open, it is only shown in the debug viewlet. Please open the debug viewlet for the bar to be visible.
isidorn
on 14 Jun 2018
Oh, i see what u mean, its only on the debug tab, not the behavior that i was expecting with docked :(, going back to "floating", would have loved it on the explore window aswell. Please make it a feature?
cROSs116
on 14 Jun 2018
@isidorn I see what you mean, I think this should be visible for explorer too.
dholakiyaankit
on 14 Jun 2018
Just put floating, and drag it to the viewlet area, then you will see it for every viewlet, even the explorer
isidorn
on 14 Jun 2018
I know that, but how will you justify docked feature? it should be visible to any area even for the explorer.
dholakiyaankit
on 14 Jun 2018
Why would I want to only have access to the debug toolbar when on the debug panel. It makes no sense that I would have to switch to the explorer panel to open a file to set break points then go back to the debug panel in order to step through code via the toolbar. Why can't it just be docked under the menu like every other windows applications works. I have hated the floating toolbar since I started using VSCode.
 nhdoublek
on 21 Jun 2018
nhdoublek
on 21 Jun 2018
@nhdoublek Exactly, Its been quite a few days I want to explain the same to them, But looks like they are not listening.
dholakiyaankit
on 21 Jun 2018
Related issues
 trstringer
·
3Comments
trstringer
·
3Comments
 DovydasNavickas
·
3Comments
DovydasNavickas
·
3Comments
 biij5698
·
3Comments
biij5698
·
3Comments
 VitorLuizC
·
3Comments
VitorLuizC
·
3Comments
 sijad
·
3Comments
sijad
·
3Comments
Most helpful comment
@isidorn I see what you mean, I think this should be visible for explorer too.