Vscode: Issue debugging node with "serverless-offline" "webpack-serverless" and TypeScript - Unverified breakpoint, Breakpoints set but not yet bound
- VSCode Version: 1.21.1
- OS Version: macOD 10.12.6
The problem is in the combination of "serverless-framework" working offline and the interactive debugging facilities of VSCode.
I am running "serverless-framework" with the "webpack-serverless" and "serverless-offline" plugins. Node is the runtime environment naturally.
I use TypeScript.
The code is very simple, and works well when run from command line, i.e. I can launch the "serverless-framework" to work offline with the command "serverless offline start" and my Lambda functions are correclty executed.
The Node debugger of VSCode works fine with TypeScript, i.e. if I have a TypeScript function or class, I can set a breakpoint and the Debugger gently stops there showing me all the variables, their values and so on.
When I try though to set breakpoints in serverless functions, than some weird behaviors occur.
Here are the steps I follow
I launch "serverless-framework" offline using the following "launch" configuration
{
    "type": "node",
    "request": "launch",
    "name": "Debug - 1",
    "program": "/usr/local/bin/serverless",
    "args": [
      "offline",
      "start",
      "--lazy"
    ],
    "env": {
      "NODE_ENV": "development"
    },
    "outFiles": [
        "${workspaceRoot}/.webpack/service/*"
    ],
    "sourceMaps": true,
    "cwd": "${workspaceRoot}",
    "localRoot": "${workspaceRoot}",
    "smartStep": true,
    "protocol": "inspector",
}
Consider that I have installed "serveless-framework" globally, and therefore the "program" path is like it is.
- As soon as I try to set a breakpoint, I see it greyed-out, as you can see from here

- The structure of the project is simple - worth noticing that the "handler.ts" is in the root, while the rest of the code in in the "src" folder

- If I launch a request to execute one of the functions I have coded, e.g. issuing a get request from browser bar, than the code execution actually stops where the breakpoint was set, even if the breakpoint was originally greyed-out, as you can see from here

and after the execution is continued, the breakpoint remains red as you can see here
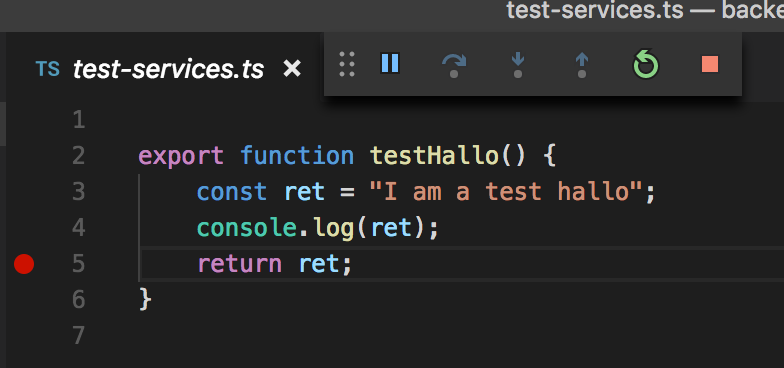

- Unfortunately though, the context of the execution seems to be lot, i.e. I can not see the variables and their values, as you can see from here

Other relevant configuration files
package.json
{
  "name": "backend-serverless",
  "version": "1.0.0",
  "description": "serverless backend for Picci site",
  "main": "handler.js",
  "scripts": {
    "test": "mocha -r ts-node/register transform/src/**/*.spec.ts src/**/**/*.spec.ts",
    "tsc": "tsc",
    "serverless": "serverless offline start",
    "debug": "export SLS_DEBUG=* && node --inspect-brk=5858 /usr/local/bin/serverless offline start --skipCacheInvalidation"
  },
  "author": "",
  "license": "ISC",
  "devDependencies": {
    "@types/aws-lambda": "0.0.34",
    "@types/chai": "^4.1.2",
    "@types/mocha": "^5.0.0",
    "@types/node": "^9.6.0",
    "chai": "^4.1.2",
    "mocha": "^5.0.5",
    "serverless-offline": "^3.18.0",
    "serverless-webpack": "^5.1.1",
    "ts-loader": "^4.1.0",
    "ts-node": "^5.0.1",
    "typescript": "^2.7.2",
    "webpack": "^4.3.0"
  }
}
tsconfig.json
   {
        "compilerOptions": {
         "target": "es6",
          "module": "commonjs",
          "outDir": "dist",
          "sourceMap": true,
          "allowJs": true,
          "noUnusedLocals": true,
          "noUnusedParameters": true
    },
    "include": [
        "src/**/*.ts", "*.ts", "src/*.ts"
    ],
    "exclude": [
         "node_modules"
    ],
    "typeRoots": [
         "node_modules/@types"
    ],
     "lib": [
         "es2016",
          "dom"
       ]
    }
webpack.config.js
  const path = require('path');
  const slsw = require('serverless-webpack');

  module.exports = {
    devtool: 'source-map',
    entry: slsw.lib.entries,
    resolve: {
      extensions: [
        '.js',
        '.json',
        '.ts',
        '.tsx'
      ]
    },
    output: {
      devtoolModuleFilenameTemplate: '[absolute-resource-path]',
      // devtoolFallbackModuleFilenameTemplate: '[absolute-resource-path]?[hash]',
      libraryTarget: 'commonjs',
      path: path.join(__dirname, '.webpack'),
      filename: '[name].js'
    },
    target: 'node',
    module: {
      rules: [
        {
          test: /\.ts(x?)$/,
          use: [
            {
              loader: 'ts-loader'
            }
          ],
        }
      ]
    }
  };
launch configuration which allows me to debug nicely TypeScript code (i.e. when I use this launch configuration I can set breakpoints on TypeScript code, and they behave as expected, stopping execution when hit and showing all variables)
   {
        "name": "Current TS File",
        "type": "node",
        "request": "launch",
        "args": ["${relativeFile}"],
        "runtimeArgs": ["--nolazy", "-r", "ts-node/register"],
        "sourceMaps": true,
        "cwd": "${workspaceRoot}",
        "protocol": "inspector"
    }
Does this issue occur when all extensions are disabled?: Yes
 EnricoPicci
All 13 comments
@auchenberg did you try "serverless" before? I do not really know whether we are supporting this. I suggest that we investigate in order to create a recipe or to better understand what the problems are (and try to fix them).
 weinand
on 29 Mar 2018
weinand
on 29 Mar 2018
The issue with the breakpoint starting out gray, then turning red once it's hit, it expected if the code is not actually loaded initially. The breakpoint only turns red once it's bound to a real location in loaded code.
The issue with not seeing the real local variables is strange... Did it stop in the correct location? If you step over the console.log line, does the log show up in the console at the correct step?
 roblourens
on 29 Mar 2018
roblourens
on 29 Mar 2018
@roblourens
Here my answers to your questions
1) It does not stop necessarily in the right location
First I place the breakpoint on the console.log line

I then execute the function and the debugger stops at the last line
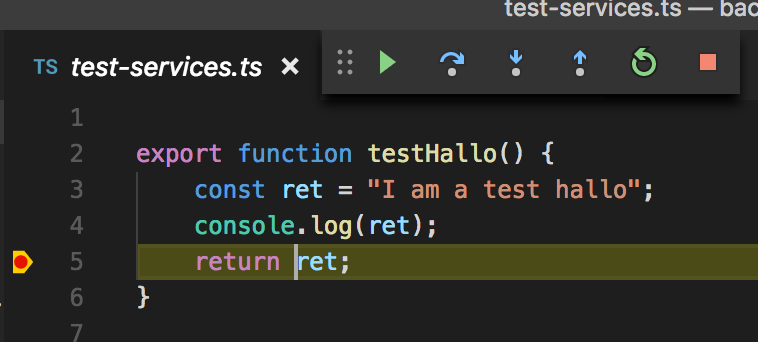
2) I am not able to step over the console.log function - if I put the breakpoint on the console.log line, the breakpoint is moved to the last line of the method - if I put the breakpoint before the console.log line, then the breakpoint is moved a the beginning of the method and then the "spepover" seems to go randomly around snippets of code which seems to belong to node or webpack.
I have also noted that the callstack reproduced is not correct

I am executing the method hallo1 but in the stacktrace it seems that I am executing the method hallo
EnricoPicci
on 30 Mar 2018
Ok, it sounds like there might be some problem with the sourcemaps...
roblourens
on 30 Mar 2018
Anything new with this? @EnricoPicci did you find a solution? Thanks!
 marvinli
on 25 Apr 2018
marvinli
on 25 Apr 2018
no
On Wed, Apr 25, 2018 at 4:00 PM, Marvin Li notifications@github.com wrote:
Anything new with this? @EnricoPicci https://github.com/EnricoPicci did
you find a solution? Thanks!—
You are receiving this because you were mentioned.
Reply to this email directly, view it on GitHub
https://github.com/Microsoft/vscode/issues/46913#issuecomment-384297191,
or mute the thread
https://github.com/notifications/unsubscribe-auth/APSjUgRgvOl58Nt2wwiT8dfmX7TbJfTYks5tsIGPgaJpZM4S_8BY
.
EnricoPicci
on 25 Apr 2018
@weinand We have an open issue tracking writing a recipe for Serverless in https://github.com/Microsoft/vscode-recipes/issues/24, but I agree. We should do an investigation on what it would take.
 auchenberg
on 2 May 2018
auchenberg
on 2 May 2018
Experiencing same issue in code 1.28.2 and Babel.
According to this question this behaviour is a regression introduced in 1.21.1. That seems to be the version reported initially in this issue
 cortopy
on 14 Nov 2018
cortopy
on 14 Nov 2018
Same here. Also, if I unset a breakpoint, it still breaks at that point at random. Looks like some kind of lag.
PS: No TypeScript here, just regular JS.
Version: 1.29.1
Commit: bc24f98b5f70467bc689abf41cc5550ca637088e
Date: 2018-11-15T19:07:43.495Z
Electron: 2.0.12
Chrome: 61.0.3163.100
Node.js: 8.9.3
V8: 6.1.534.41
Architecture: x64
 rafaelrenanpacheco
on 28 Nov 2018
rafaelrenanpacheco
on 28 Nov 2018
Did anyone figured it out easily?
 Elyx0
on 28 Jun 2019
Elyx0
on 28 Jun 2019
One workaround is putting debugger; at the start of the function, then it will stop there and all breakpoint after that will be woken up, and work properly (vscode 1.35)
 trungtin
on 30 Jun 2019
trungtin
on 30 Jun 2019
Sorry that this issue was left behind. If someone has a simple project that reproduces this issue that I can try, I can help investigate. From https://github.com/microsoft/vscode/issues/46913#issuecomment-377467701, it just sounds like the sourcemaps are not correct/do not actually match the source.
roblourens
on 8 Oct 2019
Please don't close it. The project from @Enrico is pretty simple
Elyx0
on 8 Oct 2019
Related issues
 biij5698
·
3Comments
biij5698
·
3Comments
 sijad
·
3Comments
sijad
·
3Comments
 philipgiuliani
·
3Comments
philipgiuliani
·
3Comments
 lukehoban
·
3Comments
lukehoban
·
3Comments
 ryan-wong
·
3Comments
ryan-wong
·
3Comments
Most helpful comment
@weinand We have an open issue tracking writing a recipe for Serverless in https://github.com/Microsoft/vscode-recipes/issues/24, but I agree. We should do an investigation on what it would take.